Assessing FMG and OZL: A Comprehensive Analysis of Risk and Return

Verified

Added on  2024/05/29

|10
|323
|159
Report
AI Summary
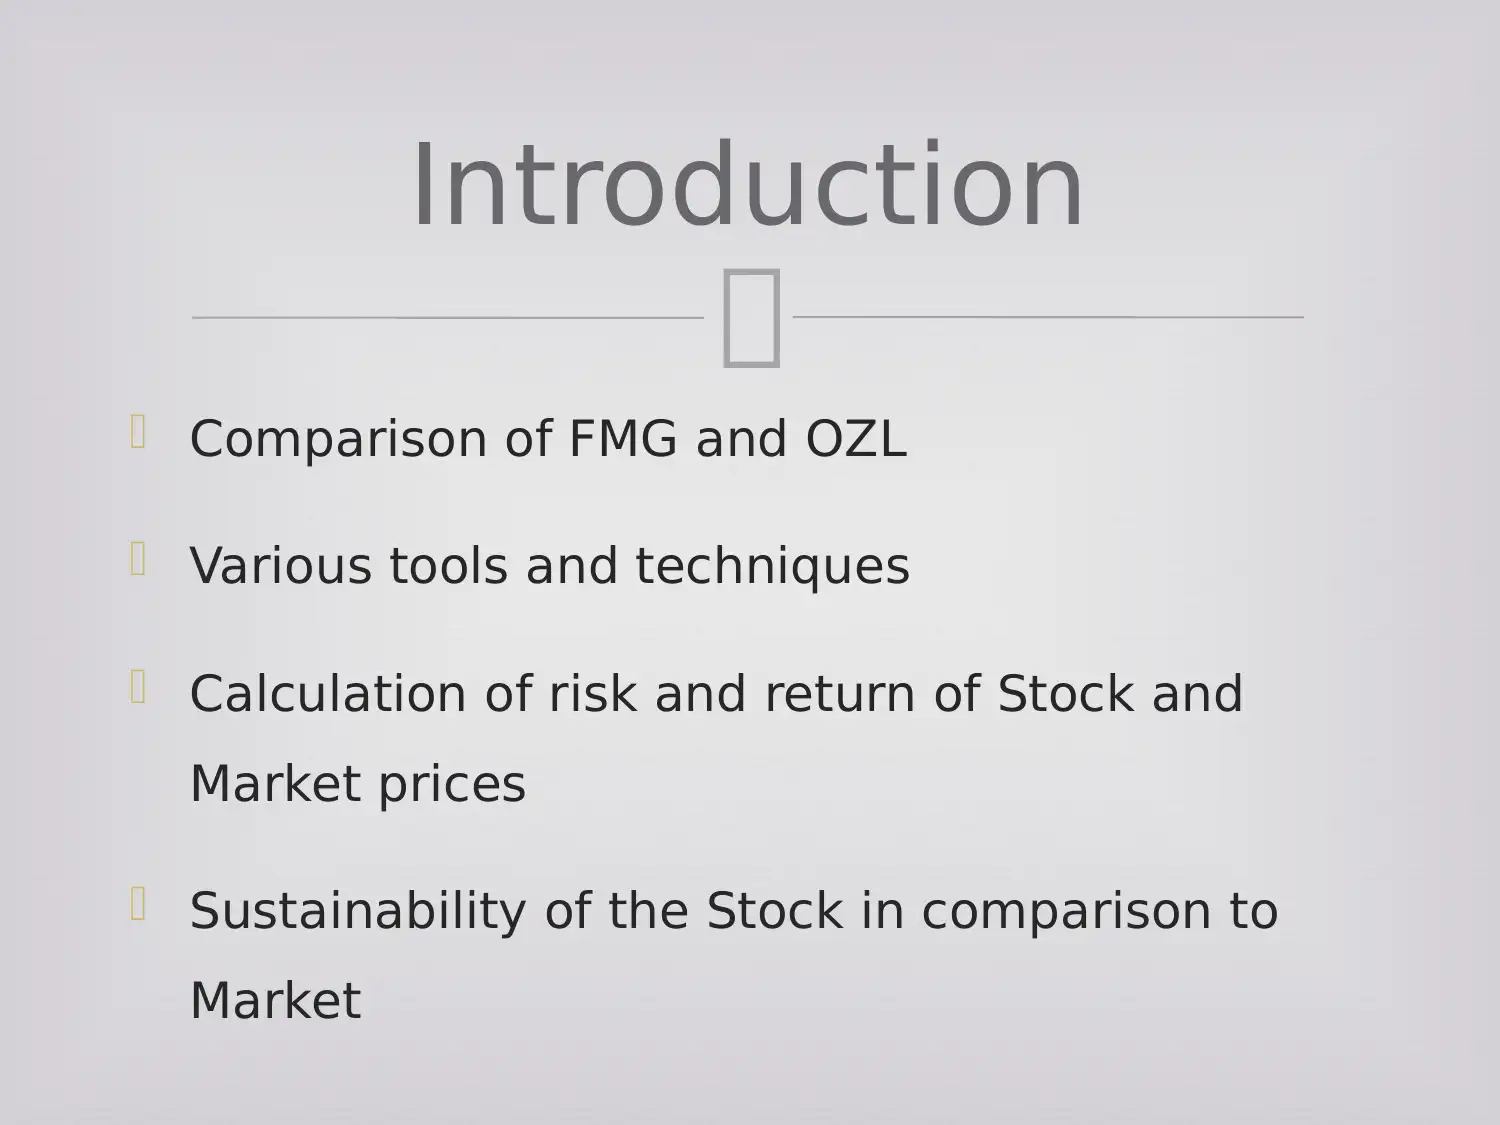
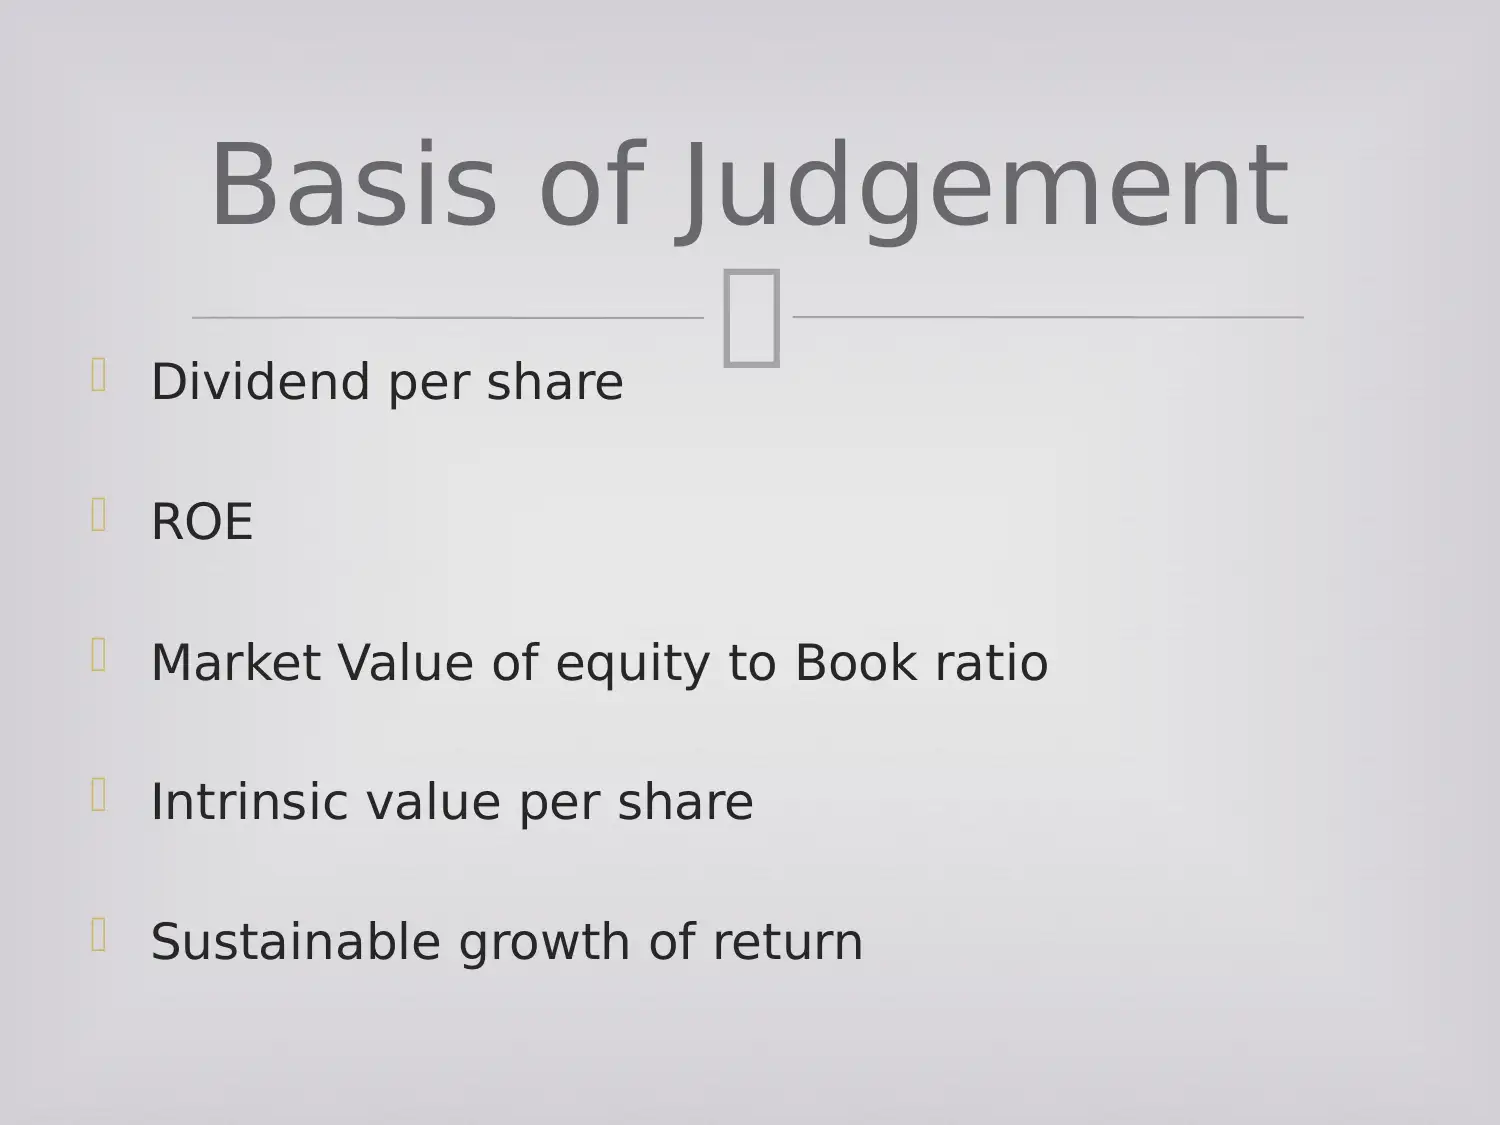
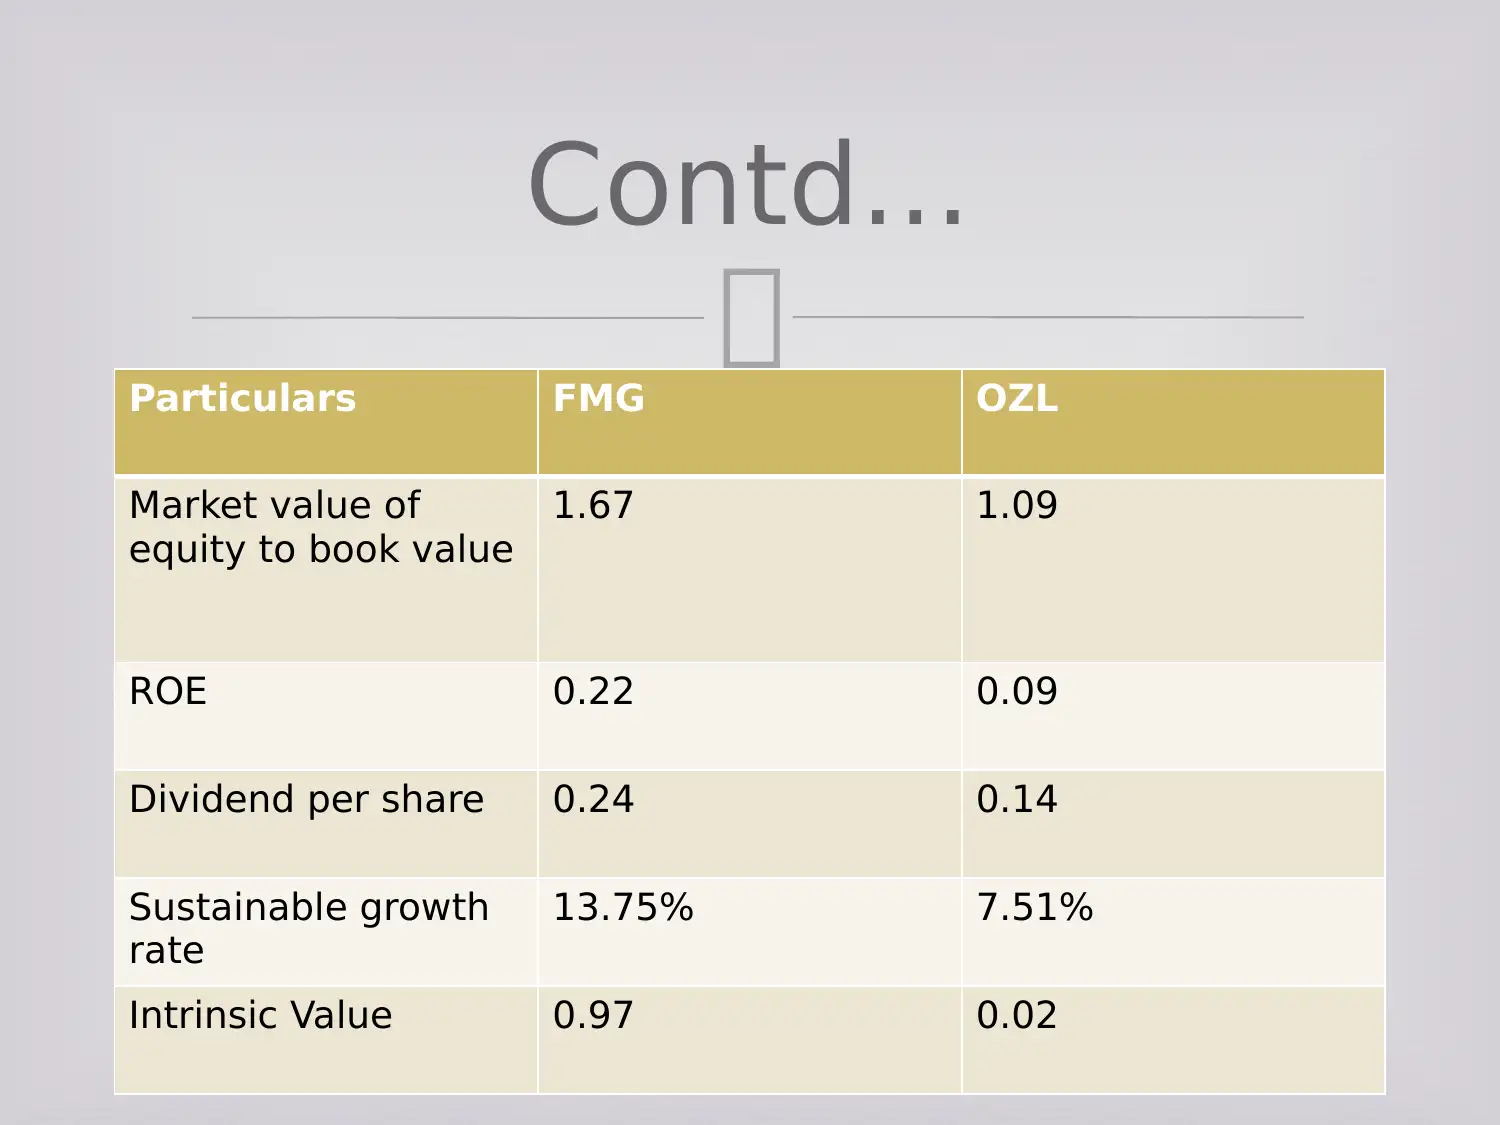
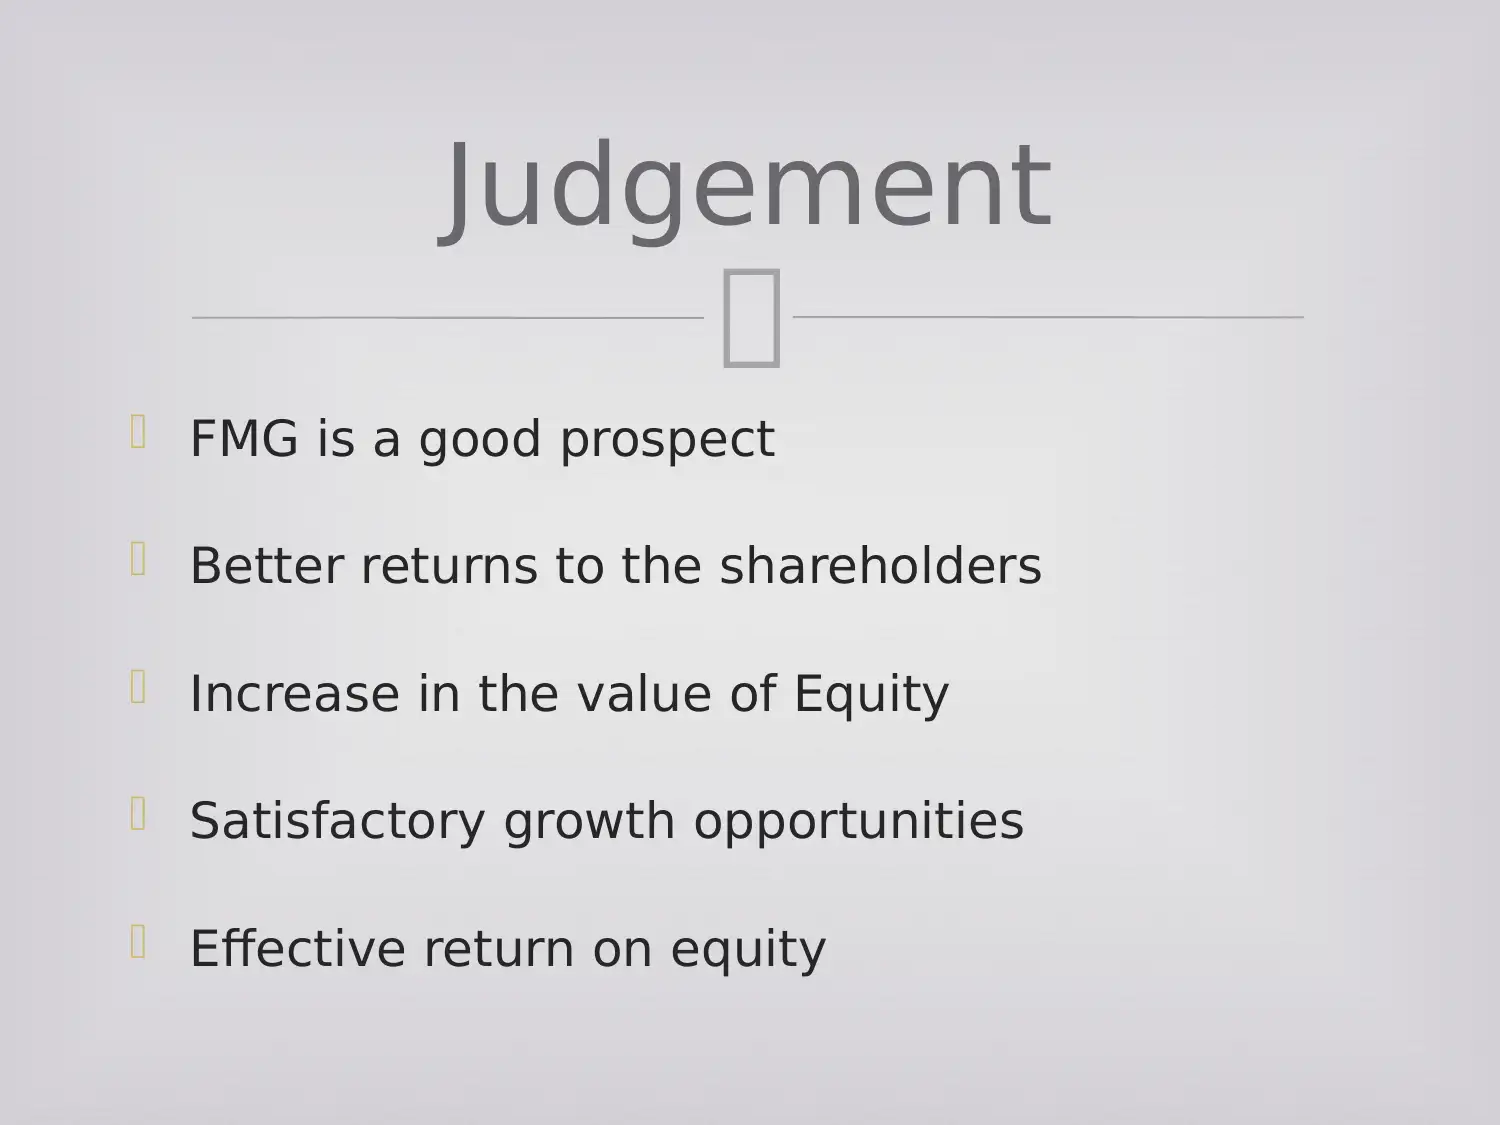
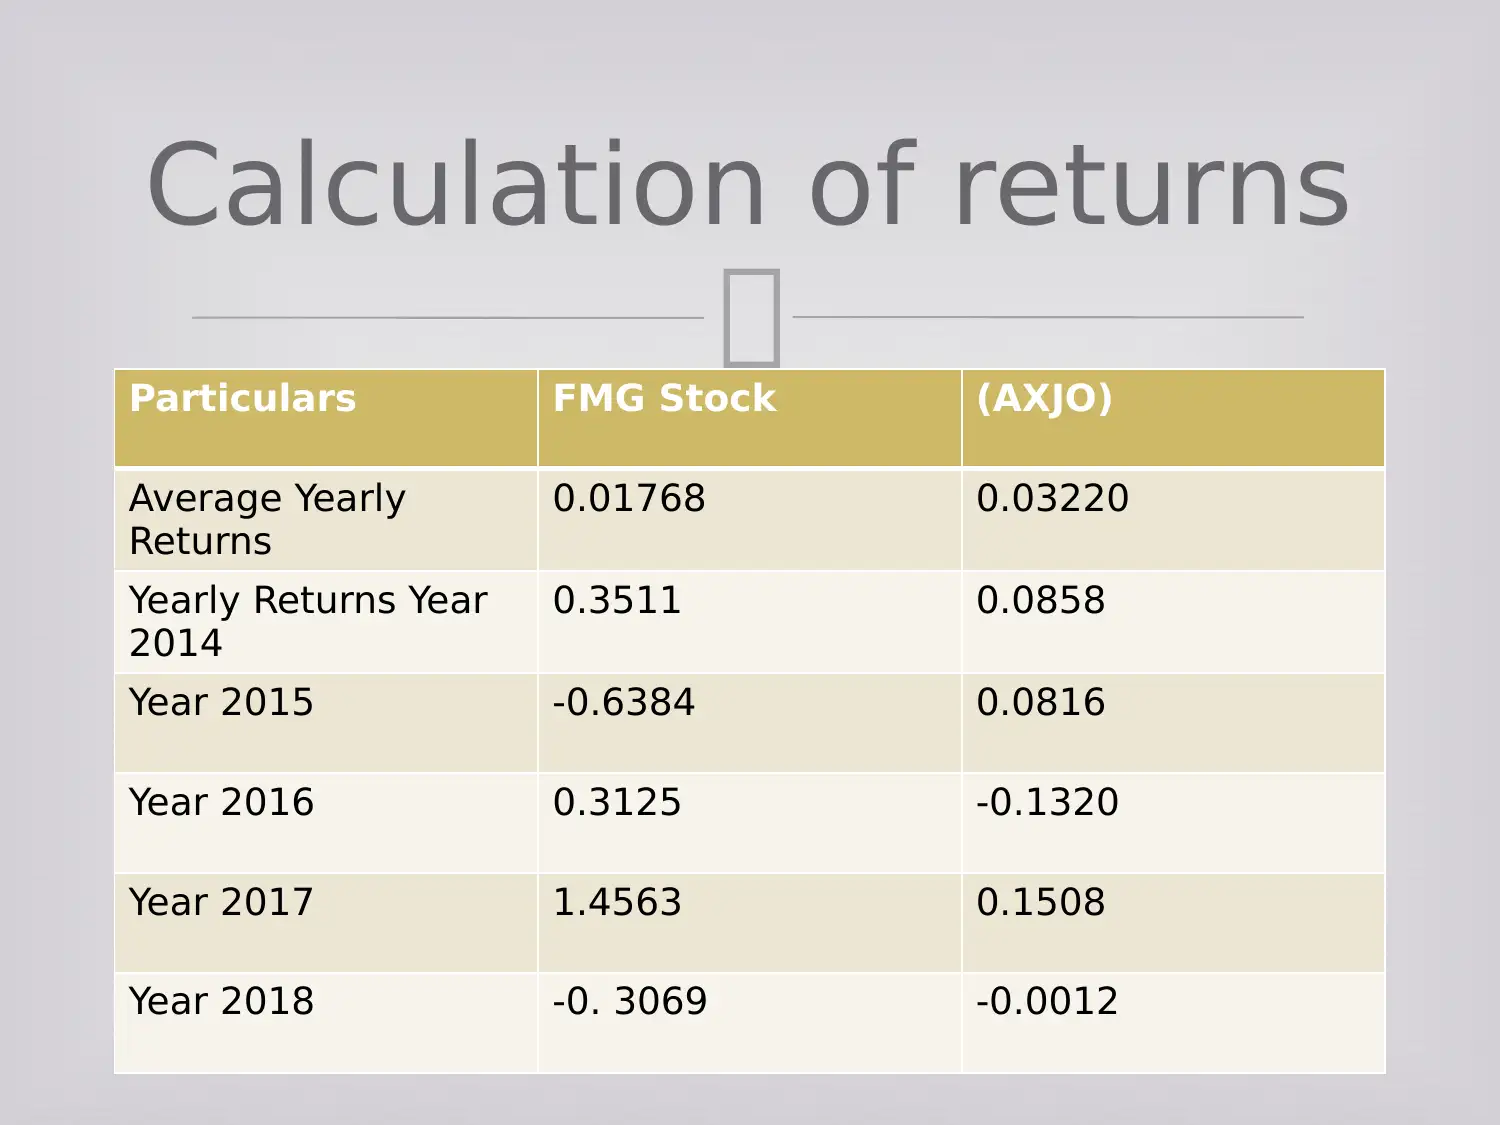
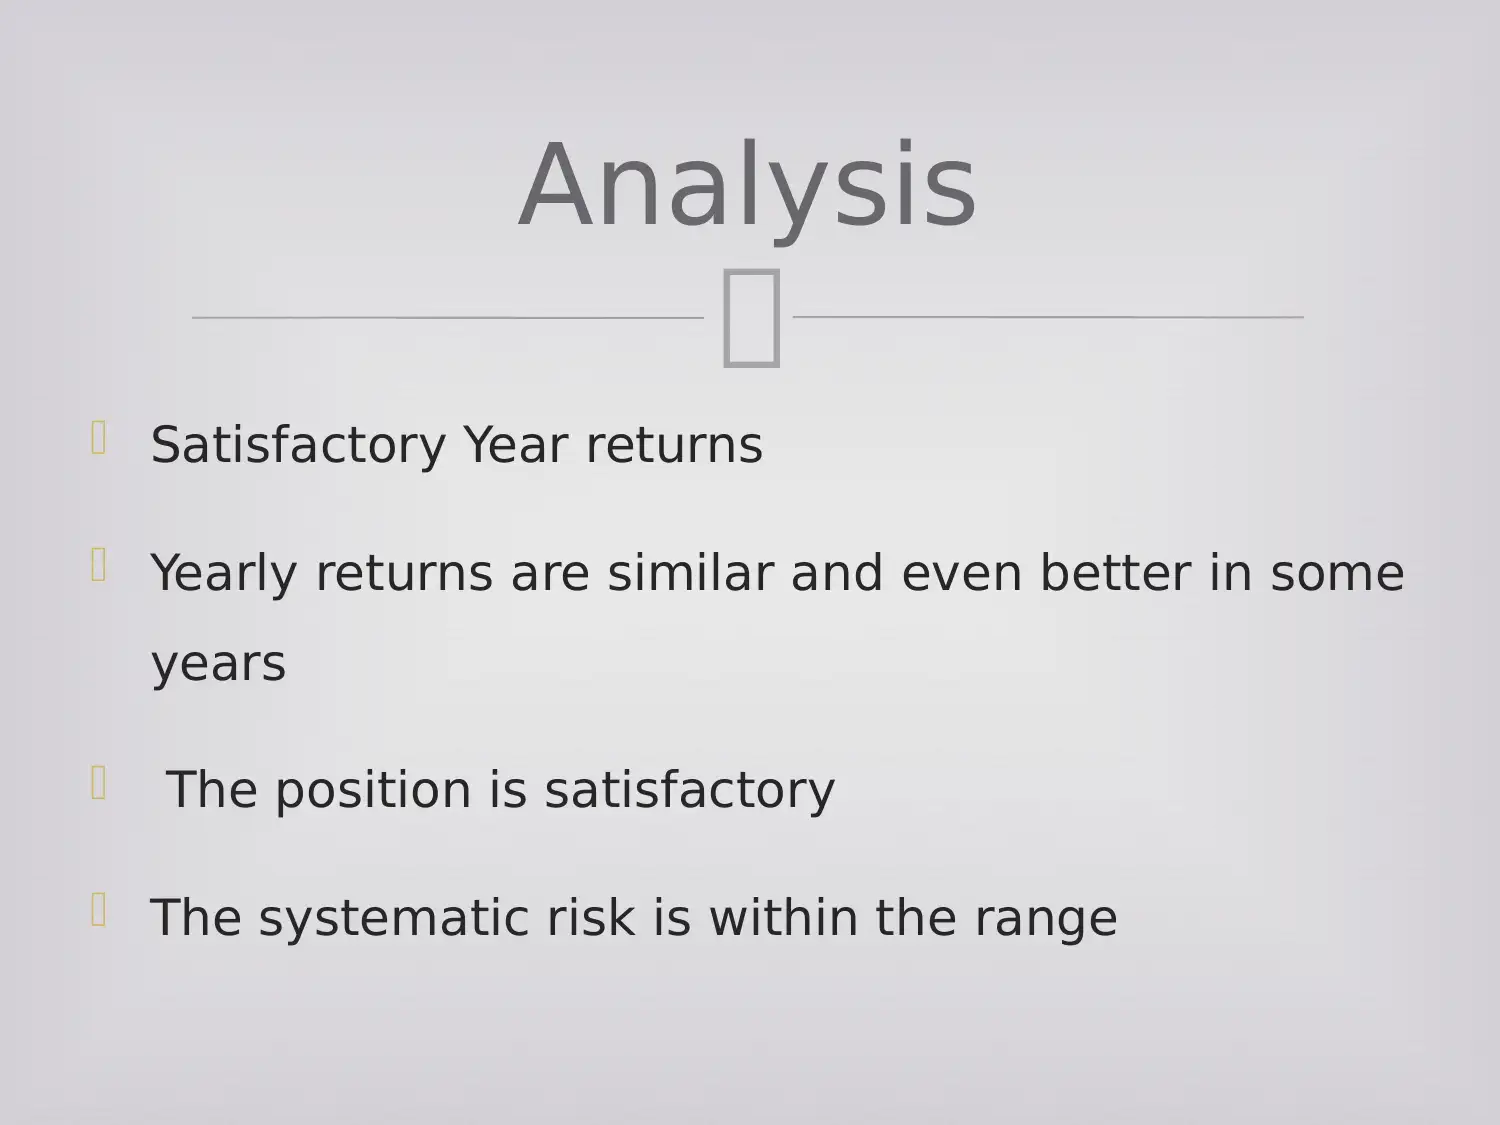
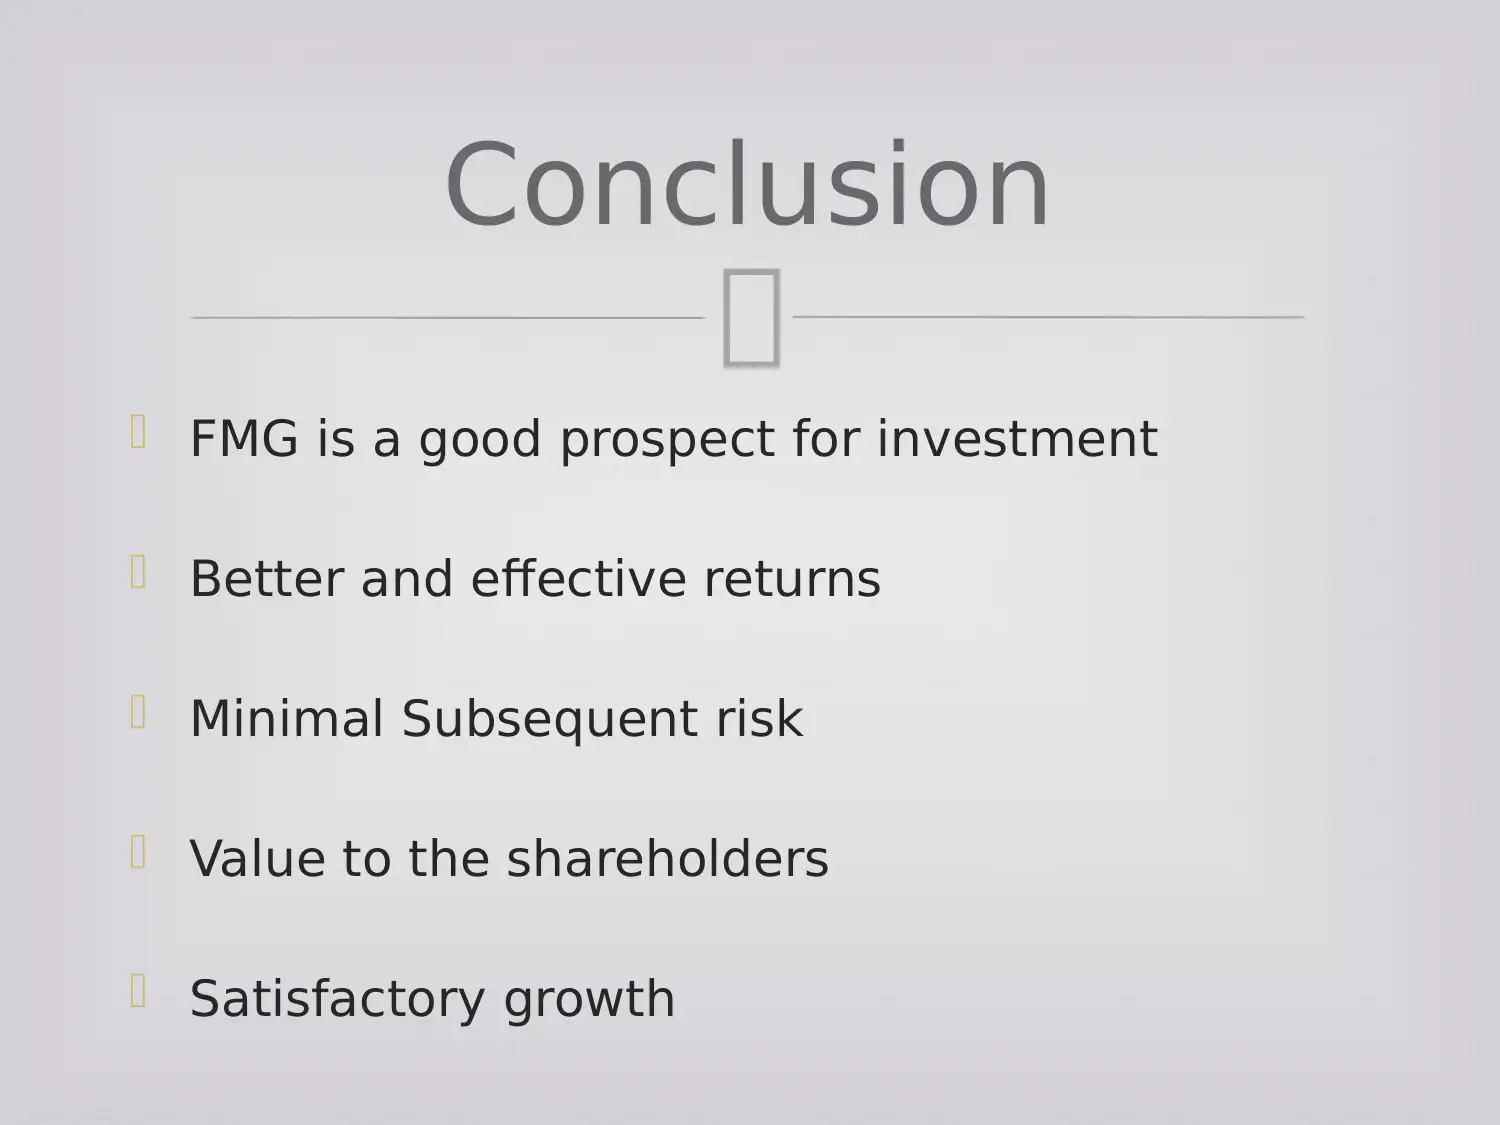
This report provides a comprehensive analysis of the risk and return profiles of Fortescue Metals Group (FMG) and OZ Minerals (OZL) stocks. It uses various financial metrics such as dividend per share, return on equity (ROE), market value to book value ratio, intrinsic value per share, and sustainable growth rate to assess the investment potential of each stock. The analysis includes a calculation of average yearly returns for both FMG stock and the broader Australian Securities Exchange (AXJO) market, comparing yearly returns from 2014 to 2018. The report concludes that FMG presents a good investment prospect due to its better returns to shareholders, increase in equity value, satisfactory growth opportunities, and effective return on equity, while also acknowledging the importance of considering systematic risk. The findings are supported by references to ASX and Reuters data.
Document Page

Risk and Return
N8-FINA2006
tabler-icon-diamond-filled.svg

Paraphrase This Document

Need a fresh take? Get an instant paraphrase of this document with our AI Paraphraser
Document Page

Introduction
Basis of Judgement case 2
Judgement
Calculation of risk and return
Analysis
Table of Contents
Document Page

Comparison of FMG and OZL
Various tools and techniques
Calculation of risk and return of Stock and
Market prices
Sustainability of the Stock in comparison to
Market
Introduction
Document Page
Dividend per share
ROE
Market Value of equity to Book ratio
Intrinsic value per share
Sustainable growth of return
Basis of Judgement
tabler-icon-diamond-filled.svg

Paraphrase This Document

Need a fresh take? Get an instant paraphrase of this document with our AI Paraphraser
Document Page

Particulars FMG OZL
Market value of
equity to book value
1.67 1.09
ROE 0.22 0.09
Dividend per share 0.24 0.14
Sustainable growth
rate
13.75% 7.51%
Intrinsic Value 0.97 0.02
Contd…
Document Page

FMG is a good prospect
Better returns to the shareholders
Increase in the value of Equity
Satisfactory growth opportunities
Effective return on equity
Judgement
Document Page

Particulars FMG Stock (AXJO)
Average Yearly
Returns
0.01768 0.03220
Yearly Returns Year
2014
0.3511 0.0858
Year 2015 -0.6384 0.0816
Year 2016 0.3125 -0.1320
Year 2017 1.4563 0.1508
Year 2018 -0. 3069 -0.0012
Calculation of returns
tabler-icon-diamond-filled.svg

Paraphrase This Document

Need a fresh take? Get an instant paraphrase of this document with our AI Paraphraser
Document Page

Satisfactory Year returns
Yearly returns are similar and even better in some
years
The position is satisfactory
The systematic risk is within the range
Analysis
Document Page

FMG is a good prospect for investment
Better and effective returns
Minimal Subsequent risk
Value to the shareholders
Satisfactory growth
Conclusion
Document Page

ASX, 2018. Charting. ASX. [Online]. Also available at
https://www.asx.com.au/prices/charting/index.html?
code=XKO&compareCode=&chartType=line&priceM
ovingAverage1=&priceMovingAverage2=&volumeIn
dicator=Bar&volumeMovingAverage=&timeframe=.
[Accessed on 03-05-2018]
Reuters, 2018. Fortescue Metals Group Ltd
(FMG.AX). Reuters. [Online]. Also available at
https://www.reuters.com/finance/stocks/chart/FMG.A
X [Accessed on 03-05-2018]
References
chevron_up_icon
1 out of 10
circle_padding
hide_on_mobile
zoom_out_icon
[object Object]