Functional MRI Analysis: Preprocessing and GLM Report

Verified

Added on  2022/08/11

|6
|967
|51
Report
AI Summary
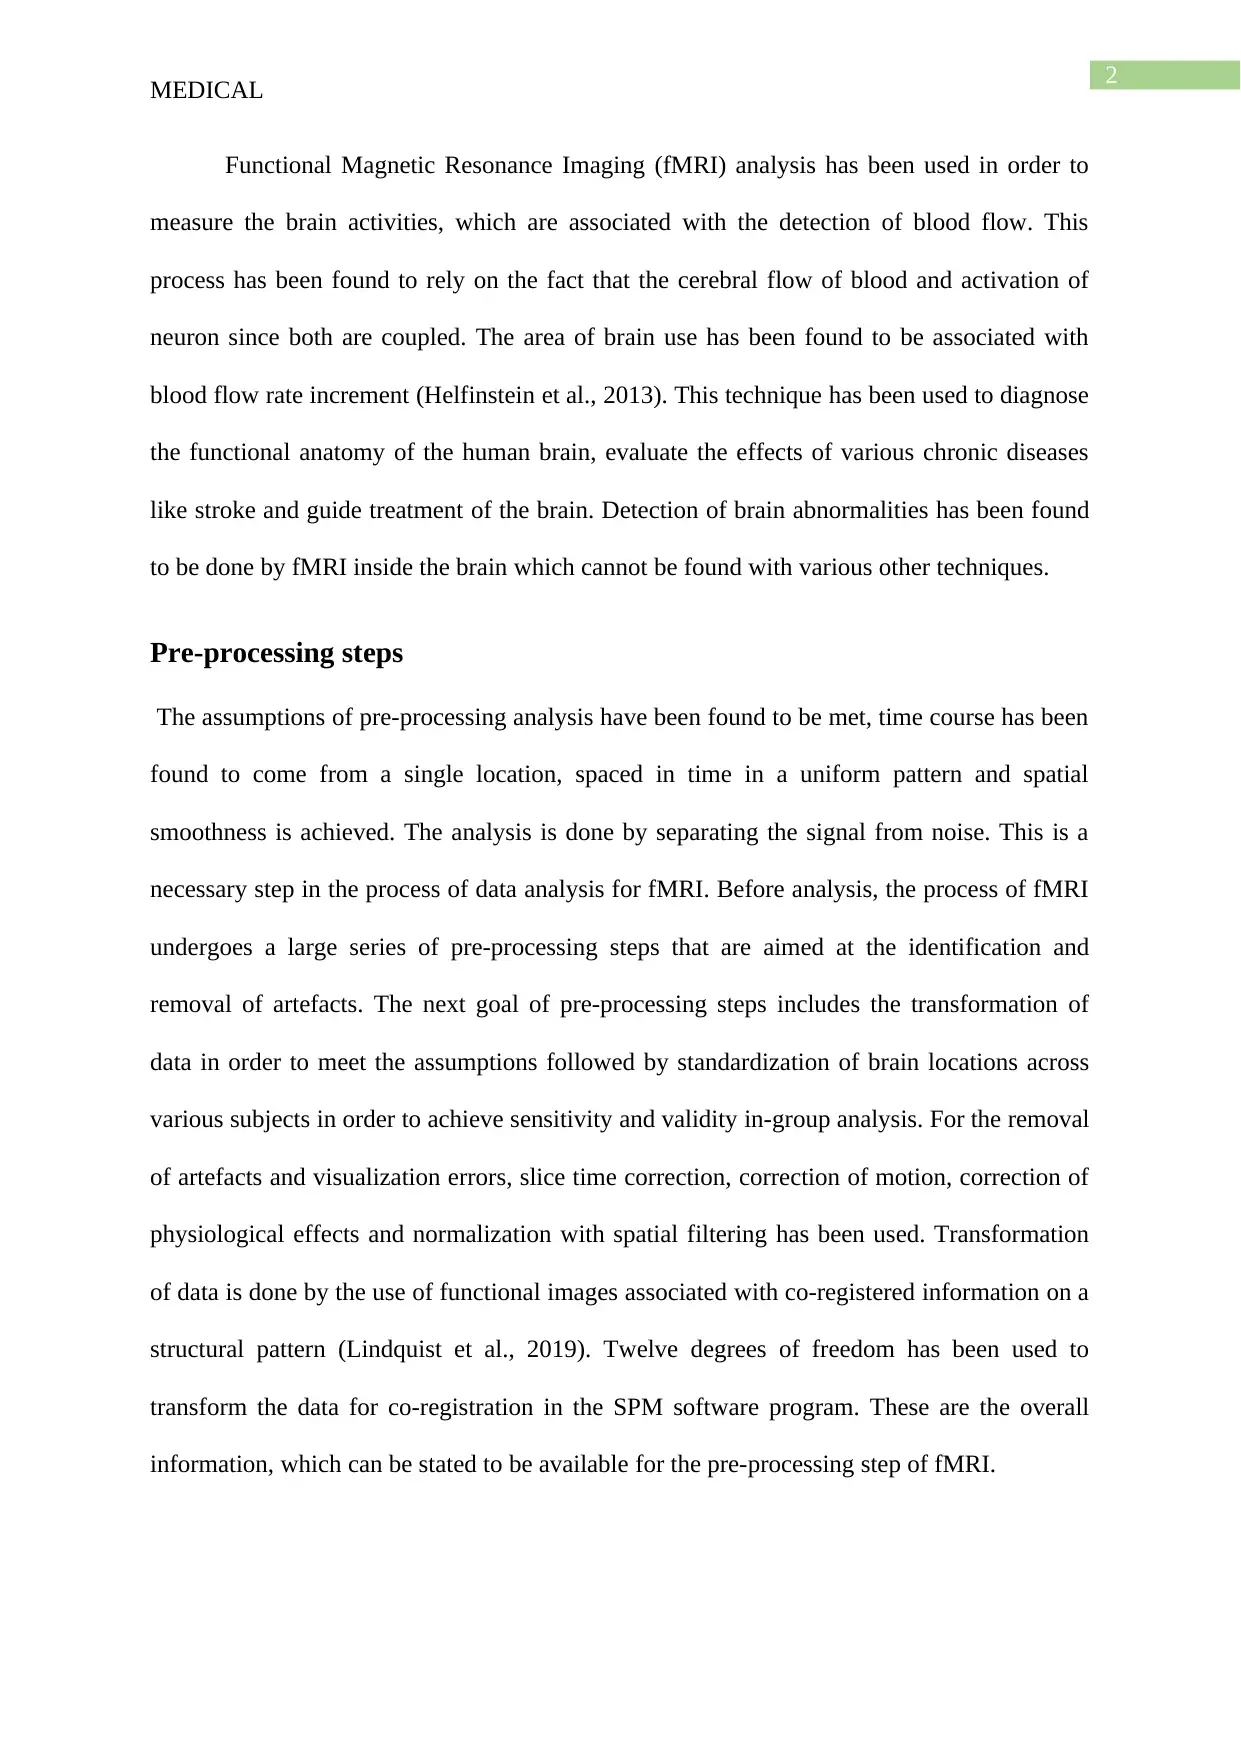
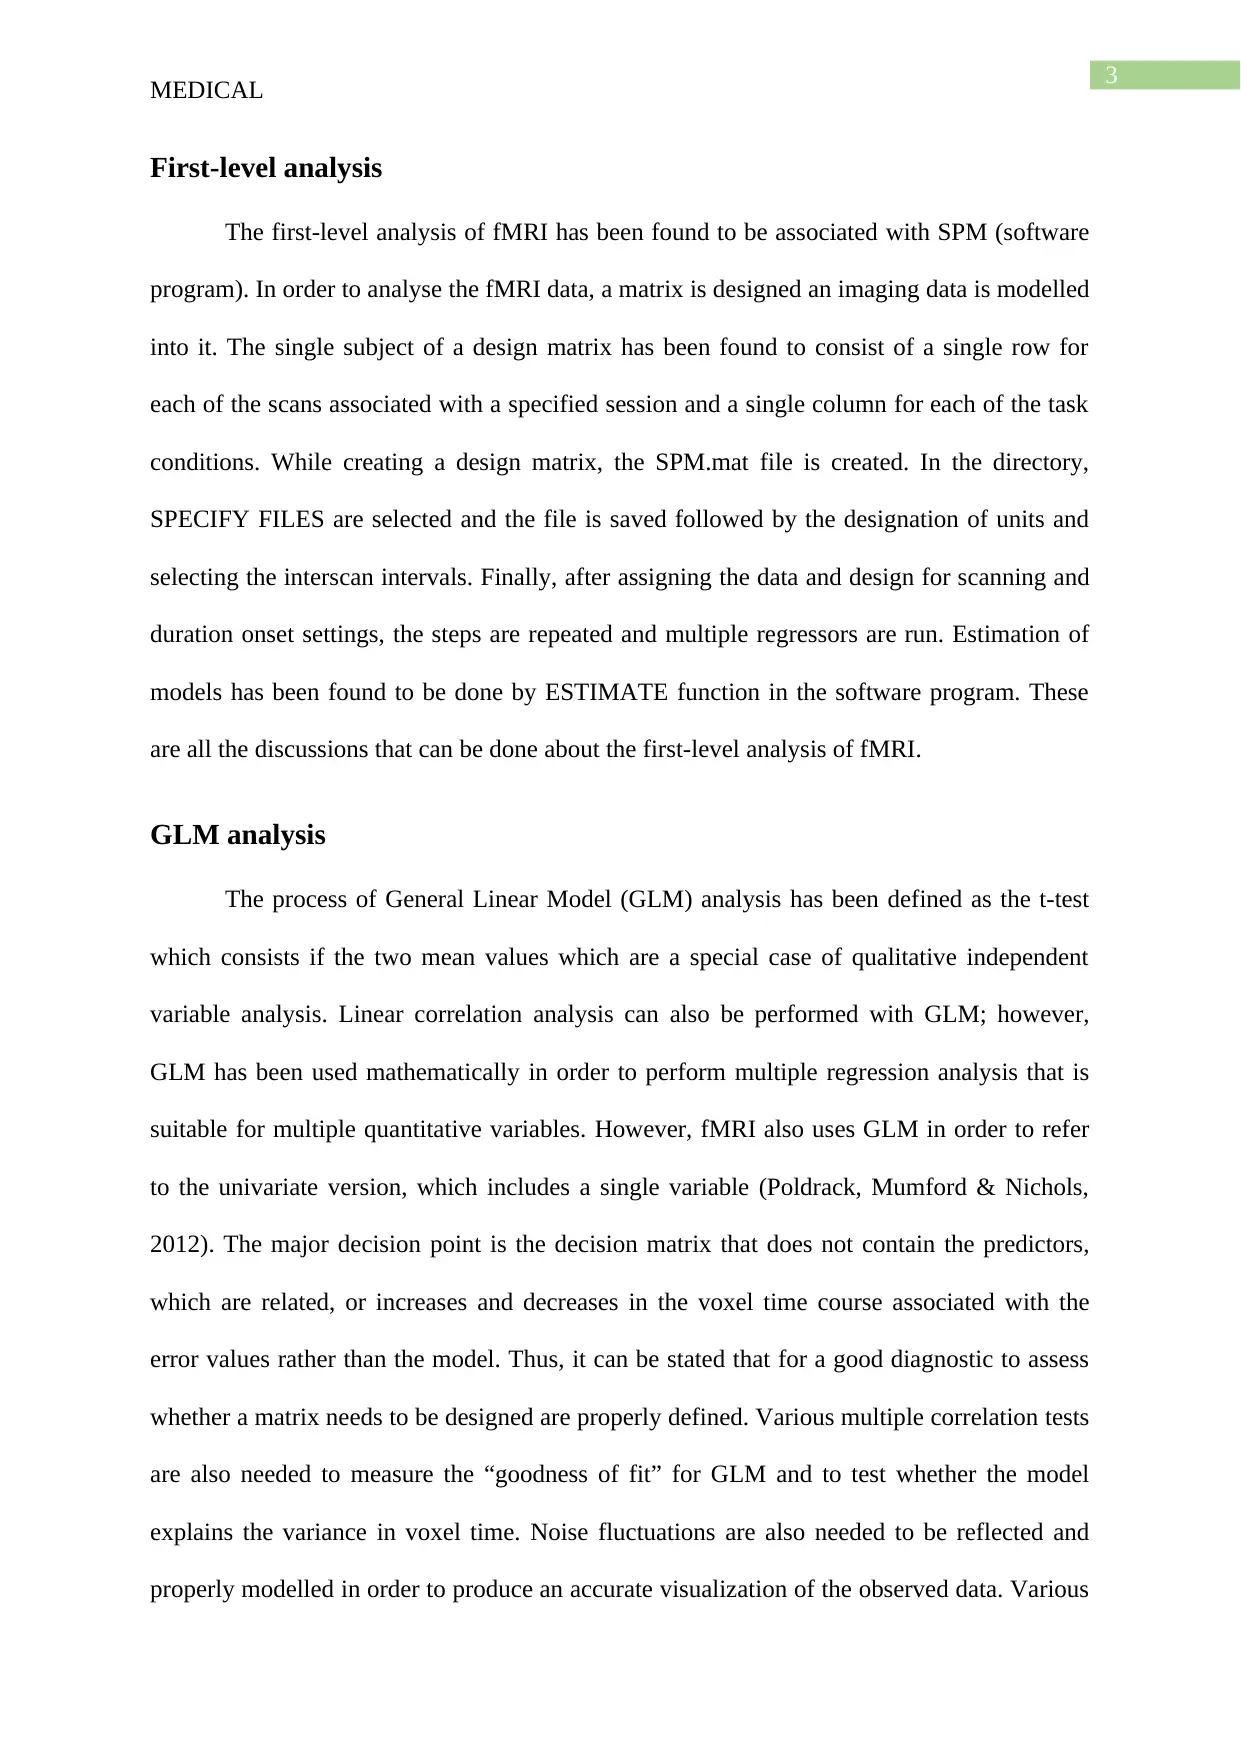
This report provides an analysis of Functional Magnetic Resonance Imaging (fMRI) data. It begins by outlining the pre-processing steps essential for preparing fMRI data, including artifact removal and data transformation to meet analysis assumptions. The report then delves into first-level analysis using the SPM software program, describing the creation of design matrices and model estimation. Finally, the report explores the General Linear Model (GLM) analysis, explaining its application in fMRI to assess brain activity related to blood flow, emphasizing the importance of a well-defined design matrix and accurate modeling of noise fluctuations for reliable results. The document provides a comprehensive overview of fMRI data analysis techniques, making it a valuable resource for understanding the process.
Document Page
Running head: MEDICAL
FMRI ANALYSIS
Name of the Student
Name of the University
Author Note
tabler-icon-diamond-filled.svg

Secure Best Marks with AI Grader

Need help grading? Try our AI Grader for instant feedback on your assignments.
Document Page
1
MEDICAL
Table of Contents
Pre-processing steps...................................................................................................................2
First-level analysis.....................................................................................................................3
GLM analysis.............................................................................................................................3
References..................................................................................................................................5
Document Page
2
MEDICAL
Functional Magnetic Resonance Imaging (fMRI) analysis has been used in order to
measure the brain activities, which are associated with the detection of blood flow. This
process has been found to rely on the fact that the cerebral flow of blood and activation of
neuron since both are coupled. The area of brain use has been found to be associated with
blood flow rate increment (Helfinstein et al., 2013). This technique has been used to diagnose
the functional anatomy of the human brain, evaluate the effects of various chronic diseases
like stroke and guide treatment of the brain. Detection of brain abnormalities has been found
to be done by fMRI inside the brain which cannot be found with various other techniques.
Pre-processing steps
The assumptions of pre-processing analysis have been found to be met, time course has been
found to come from a single location, spaced in time in a uniform pattern and spatial
smoothness is achieved. The analysis is done by separating the signal from noise. This is a
necessary step in the process of data analysis for fMRI. Before analysis, the process of fMRI
undergoes a large series of pre-processing steps that are aimed at the identification and
removal of artefacts. The next goal of pre-processing steps includes the transformation of
data in order to meet the assumptions followed by standardization of brain locations across
various subjects in order to achieve sensitivity and validity in-group analysis. For the removal
of artefacts and visualization errors, slice time correction, correction of motion, correction of
physiological effects and normalization with spatial filtering has been used. Transformation
of data is done by the use of functional images associated with co-registered information on a
structural pattern (Lindquist et al., 2019). Twelve degrees of freedom has been used to
transform the data for co-registration in the SPM software program. These are the overall
information, which can be stated to be available for the pre-processing step of fMRI.
Document Page
3
MEDICAL
First-level analysis
The first-level analysis of fMRI has been found to be associated with SPM (software
program). In order to analyse the fMRI data, a matrix is designed an imaging data is modelled
into it. The single subject of a design matrix has been found to consist of a single row for
each of the scans associated with a specified session and a single column for each of the task
conditions. While creating a design matrix, the SPM.mat file is created. In the directory,
SPECIFY FILES are selected and the file is saved followed by the designation of units and
selecting the interscan intervals. Finally, after assigning the data and design for scanning and
duration onset settings, the steps are repeated and multiple regressors are run. Estimation of
models has been found to be done by ESTIMATE function in the software program. These
are all the discussions that can be done about the first-level analysis of fMRI.
GLM analysis
The process of General Linear Model (GLM) analysis has been defined as the t-test
which consists if the two mean values which are a special case of qualitative independent
variable analysis. Linear correlation analysis can also be performed with GLM; however,
GLM has been used mathematically in order to perform multiple regression analysis that is
suitable for multiple quantitative variables. However, fMRI also uses GLM in order to refer
to the univariate version, which includes a single variable (Poldrack, Mumford & Nichols,
2012). The major decision point is the decision matrix that does not contain the predictors,
which are related, or increases and decreases in the voxel time course associated with the
error values rather than the model. Thus, it can be stated that for a good diagnostic to assess
whether a matrix needs to be designed are properly defined. Various multiple correlation tests
are also needed to measure the “goodness of fit” for GLM and to test whether the model
explains the variance in voxel time. Noise fluctuations are also needed to be reflected and
properly modelled in order to produce an accurate visualization of the observed data. Various
tabler-icon-diamond-filled.svg

Secure Best Marks with AI Grader

Need help grading? Try our AI Grader for instant feedback on your assignments.
Document Page
4
MEDICAL
fMRI analysis of data has been observed where the data is not correctly modelled and the
plots of residues show less frequency instead of a stationary noise course. Thus, it can be
stated that these are the overall findings that can be stated in a paragraph for GLM analysis
decision-making points in fMRI.
Document Page
5
MEDICAL
References
Helfinstein, S. M., Kirwan, M. L., Benson, B. E., Hardin, M. G., Pine, D. S., Ernst, M., &
Fox, N. A. (2013). Validation of a child-friendly version of the monetary incentive
delay task. Social cognitive and affective neuroscience, 8(6), 720-726.
Lindquist, M. A., Geuter, S., Wager, T. D., & Caffo, B. S. (2019). Modular preprocessing
pipelines can reintroduce artifacts into fMRI data. Human brain mapping, 40(8),
2358-2376.
Poldrack, R., Mumford, J., & Nichols, T. (2012). Handbook of functional MRI data analysis.
Cambridge: Cambridge University Press.
chevron_up_icon
1 out of 6
circle_padding
hide_on_mobile
zoom_out_icon
logo.png

Your All-in-One AI-Powered Toolkit for Academic Success.

Available 24*7 on WhatsApp / Email

[object Object]