Financial Analysis and Management Report: F&N Holdings Bhd (2016-2019)
VerifiedAdded on 2023/01/13
|22
|4377
|37
Report
AI Summary
This report provides a comprehensive financial analysis of Fraser & Neave Holdings Bhd (F&N), a major Malaysian corporation. It begins with an introduction to financial analysis and its importance in evaluating organizational success. Task 1 involves a competitive analysis using PEST and Porter's Five Forces models, assessing F&N's market position and competitive landscape. The report then delves into a four-year financial performance review (2016-2019), examining profitability through gross and net profit margins, liquidity via current ratios, capital structure using debt/equity ratios, and efficiency through asset turnover ratios. The analysis includes tables of financial data, calculations, and interpretations of trends, offering insights into F&N's financial health and strategic positioning. The report concludes with overall findings and a discussion of factors influencing F&N's financial performance, along with recommendations for future strategies.

Financial Analysis and
Management
Management
Paraphrase This Document
Need a fresh take? Get an instant paraphrase of this document with our AI Paraphraser
Table of Contents
INTRODUCTION...........................................................................................................................3
TASK 1............................................................................................................................................3
Overview:...............................................................................................................................3
1. Competitive Analysis of F & N:.........................................................................................4
2. FOUR years of financial performance Profitability:.........................................................9
3. Cash flow statement over the FOUR years .....................................................................14
CONCLUSION .............................................................................................................................16
REFERENCES................................................................................................................................1
APPENDIX .....................................................................................................................................2
INTRODUCTION
Financial analysis includes the use of financial information to evaluate the success of an
organization and to provide suggestions about how it better the future (Antonopoulos and Hall,
2018). Financial analysts do their research mainly in Excel, utilizing a table to evaluate historical
data as well as to create predictions of how they expect the business will succeed in near future.
Financial analysis defined as aspect of the general mechanism of corporate finance involving the
review of historical records in order to learn about company's current and long term financial
health. It may be used to provide business leaders with the knowledge they want to make
strategic decisions in broad range of circumstances. This study analyse the financial performance
of Fraser & Neave Holdings Bhd along with competitive analysis of the key competitors and
marketing offerings in sector. This study also evaluates key drivers of change that have affected
sector.
TASK 1
Overview:
Fraser & Neave Holdings Bhd is Malaysia’s top diversified blue-chip corporation with
turnover of above RM4 billion through manufacturing operations and sales of different drinks,
beverages and wide range of dairy products. Company has experience of around 135 years and
its different brands are enjoying market leadership throughout in different categories.
Mission: Being a multinational corporation of the world class offering our investors with
superior yields, great value as well as a fulfilling needs of customers.
Vision: Becoming Malaysia and region's leading global drinking corporation.
⊘ This is a preview!⊘
Do you want full access?
Subscribe today to unlock all pages.
Trusted by 1+ million students worldwide
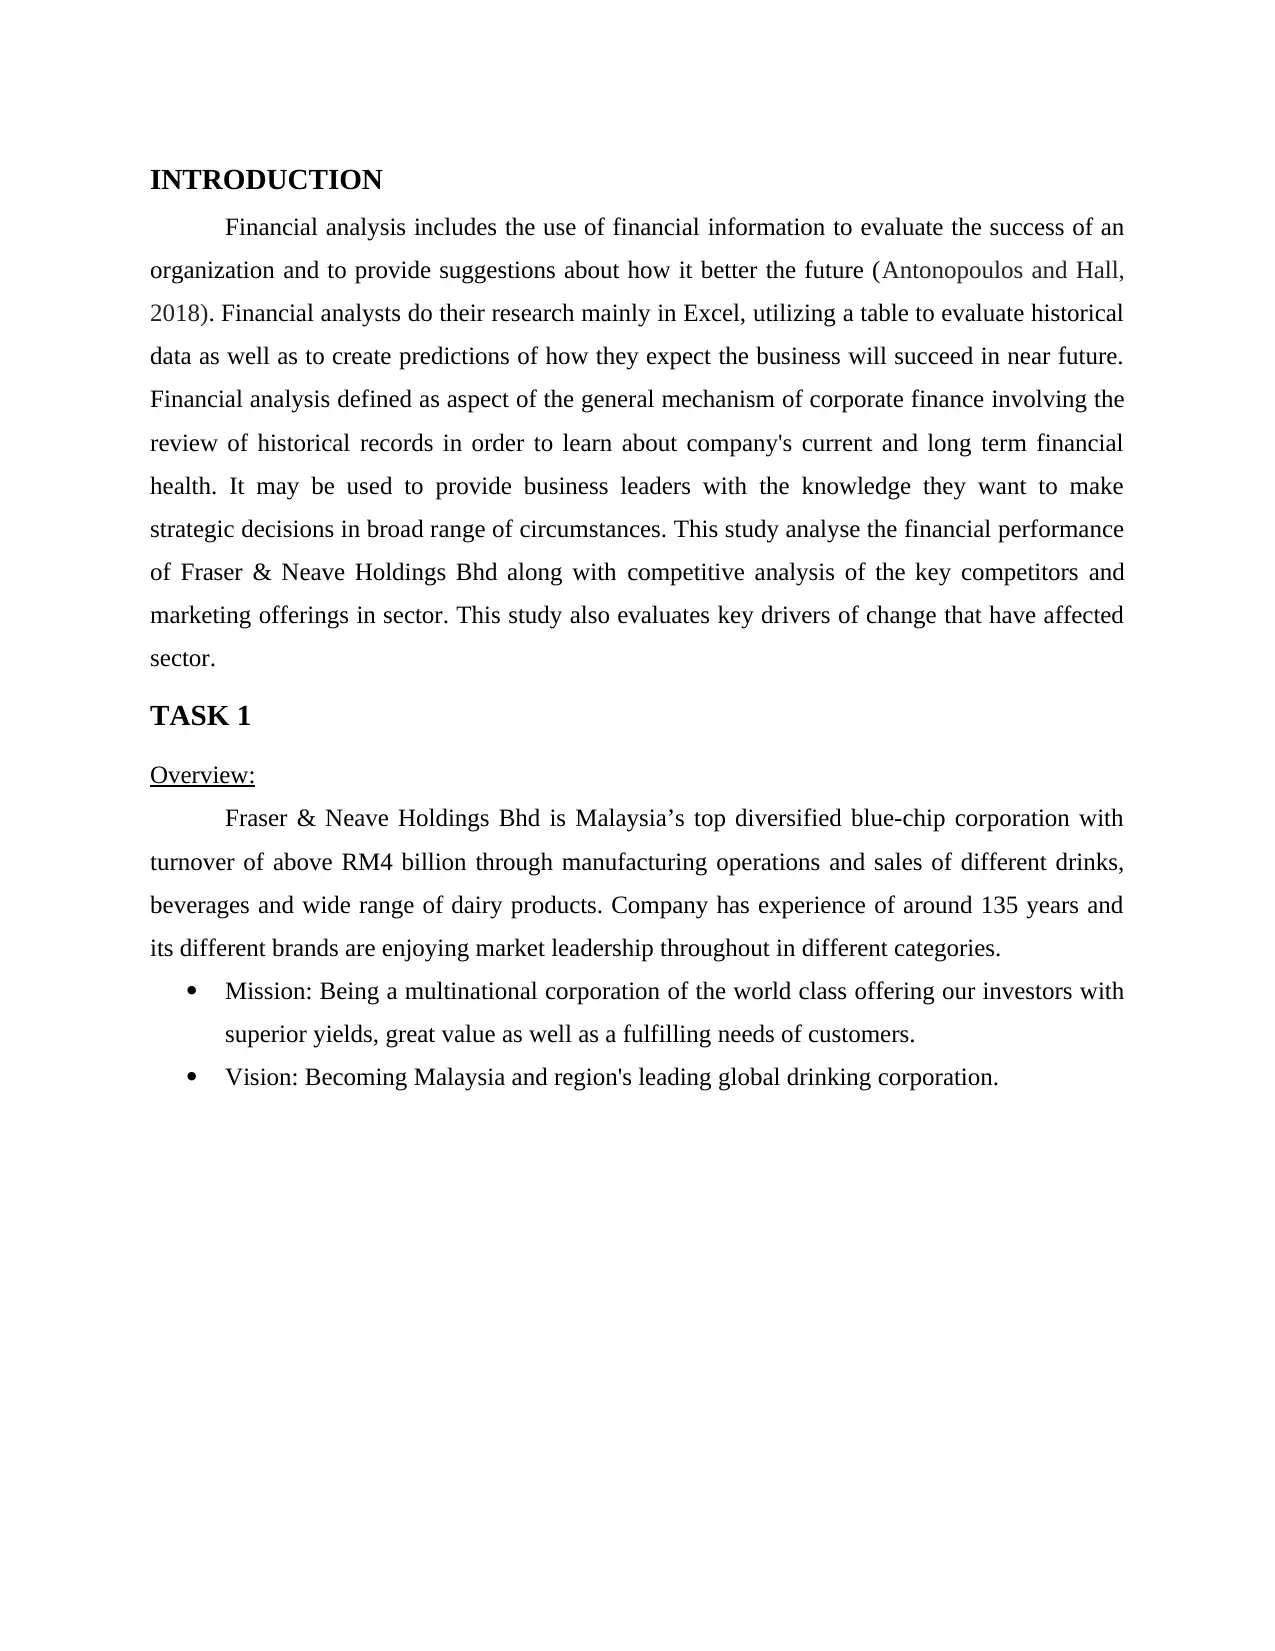
1. Competitive Analysis of F & N:
A competition analysis is a method in which significant rivals are established and goods,
sales and marketing methods are critically evaluated. Corporation can develop strong business
policies to enhance corporation competitor's performance (Banerjee and et.al., 2016). Here in
study for the purpose of competitive analysis of F & N plc, PEST analysis and porter's five
forces model has been utilised, as below:
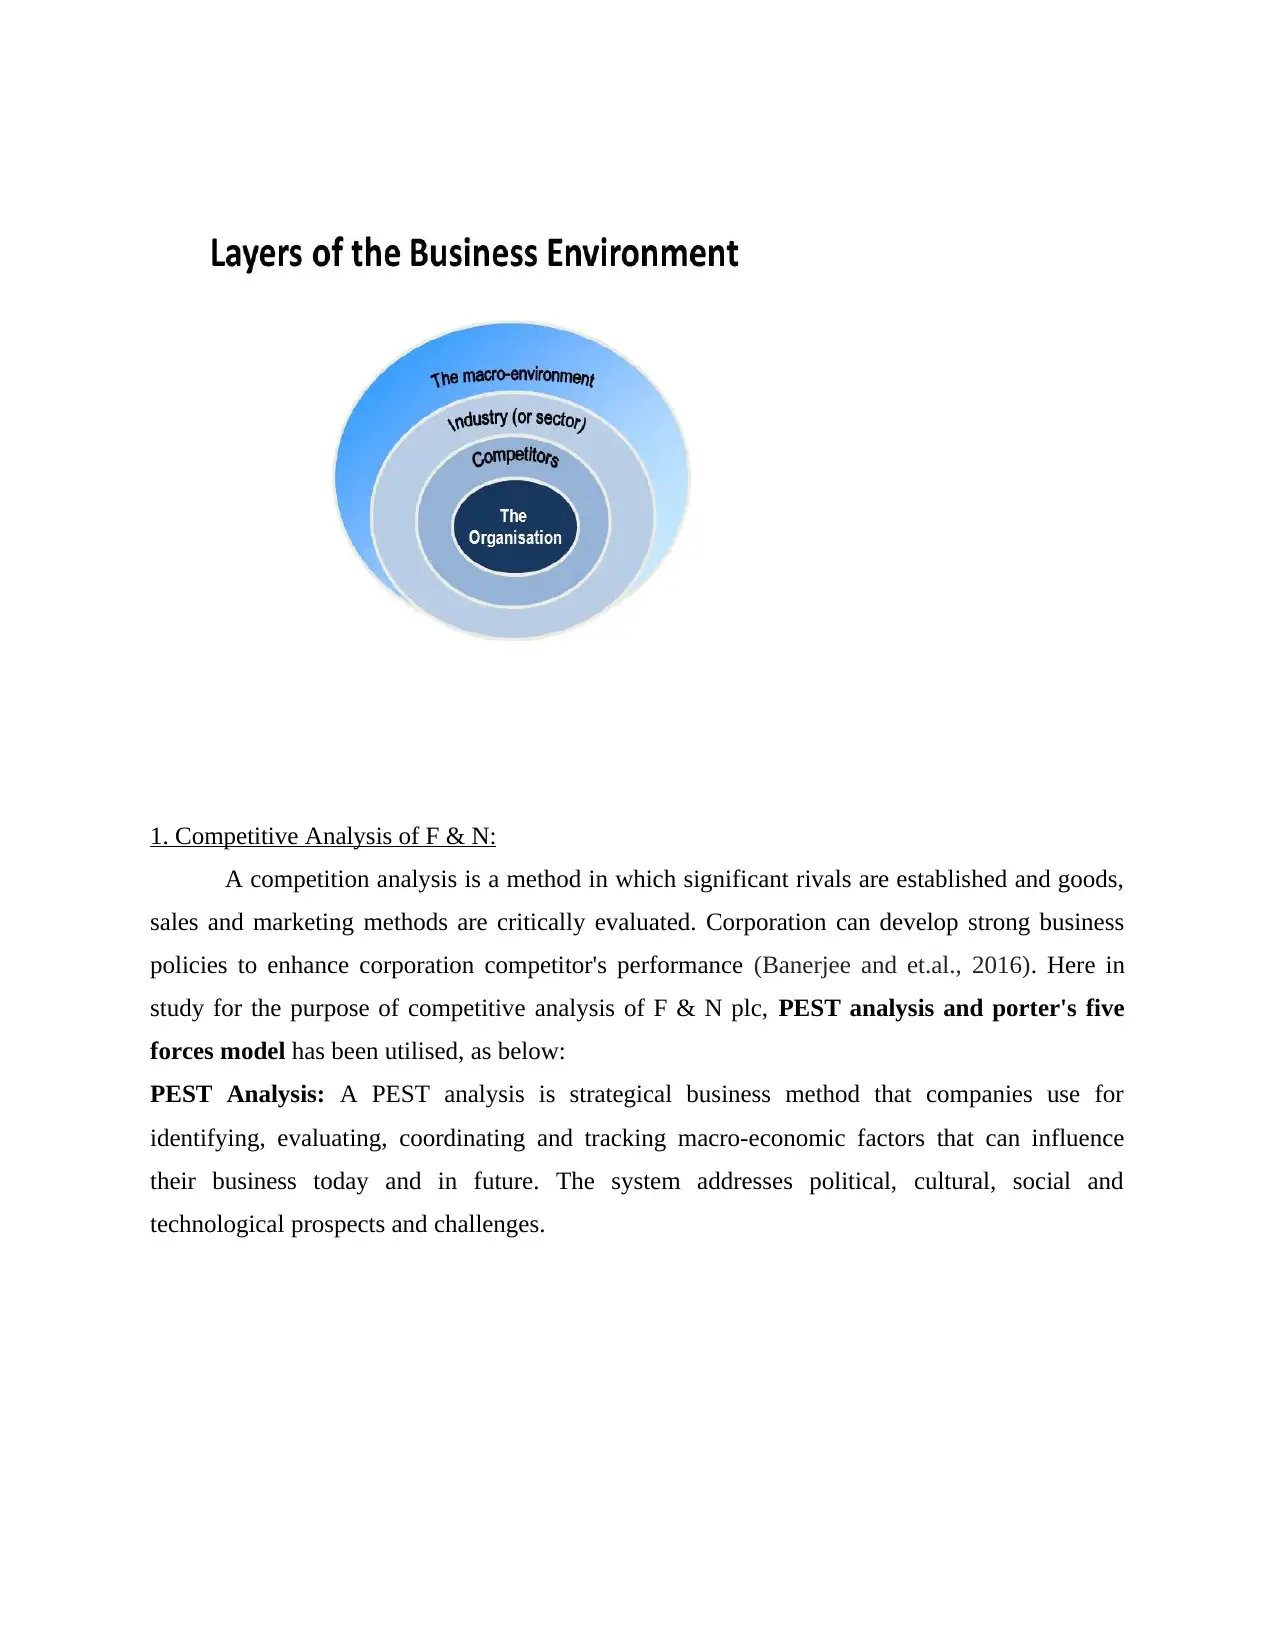
PEST Analysis: A PEST analysis is strategical business method that companies use for
identifying, evaluating, coordinating and tracking macro-economic factors that can influence
their business today and in future. The system addresses political, cultural, social and
technological prospects and challenges.
A competition analysis is a method in which significant rivals are established and goods,
sales and marketing methods are critically evaluated. Corporation can develop strong business
policies to enhance corporation competitor's performance (Banerjee and et.al., 2016). Here in
study for the purpose of competitive analysis of F & N plc, PEST analysis and porter's five
forces model has been utilised, as below:
PEST Analysis: A PEST analysis is strategical business method that companies use for
identifying, evaluating, coordinating and tracking macro-economic factors that can influence
their business today and in future. The system addresses political, cultural, social and
technological prospects and challenges.
Paraphrase This Document
Need a fresh take? Get an instant paraphrase of this document with our AI Paraphraser
Political
Political factors are the policies and rules which political party of a country frame for
people (Brusca, Gómez‐villegas and Montesinos, 2016). In Malaysia and Singapore, government
had put many initiative for boosting the spending of consumer with the introduction of new
economic model (NEW). With this model the sales and purchasing power of country has actually
proven to increase. From the increase in economic sales, the sales of Fraser & Neave will also
increase directly or indirectly. It is also said that, the products of Fraser & Neave are entitled for
Halal Hub Tax incentive. By availing such incentive company made more profits compare to
those companies which are not qualified for such incentives.
Social Economic
With the improving growth in country, the income also increases which lead to increase
in purchasing power of the people also. If purchasing power of people increases the sales for the
companies also will increase. The prospect growth of country will directly or indirectly result in
increase in its growth. As related with Fraser Neave, the production of products gets increased
as with the rise with GDP. Along with this, the ASEAN countries are also growing quick in their
economy giving a chance for Fraser Neave to expand and diversify its business. Through
expanding and diversifying the market share and growth of the company will also expand or
increase resulting to more profit. By expanding, the company can build a strong brand image
domestically and internationally, and can position itself in the minds of people. Therefore,
analysing the economic condition is very necessary before enter into any type of market.
Technological
In early 2011, F&N launched Ice Mountain, a revolutionary product as well as a higher
share of brewer waters, that accounted for 5% of the business in Malaysia. In Oct. 2011 F&N
introduced Zesta drink throughout Malaysia. Zesta's delightful berry drink is beautifully sweet. It
contains the rainbows of Amazon, South America, Guarana. Therefore, tropical Guarana berries
strengthen body and mind.
Environmental: Raw materials costs increased and business income was impacted by
the Sichuan Earthquake of Mai 2008. natural catastrophe meets the corporation's standards and
regulation (Cantillon, Maître and Watson, 2016). In 2008, gain before interests and taxes only
increased by 5%. In order to accomplish their endeavour, this environmental variable impacted
companies. Natural disasters could prevent F&N from providing shareholders with higher
returns.
Porter's five forces model of Fraser & Neave
⊘ This is a preview!⊘
Do you want full access?
Subscribe today to unlock all pages.
Trusted by 1+ million students worldwide
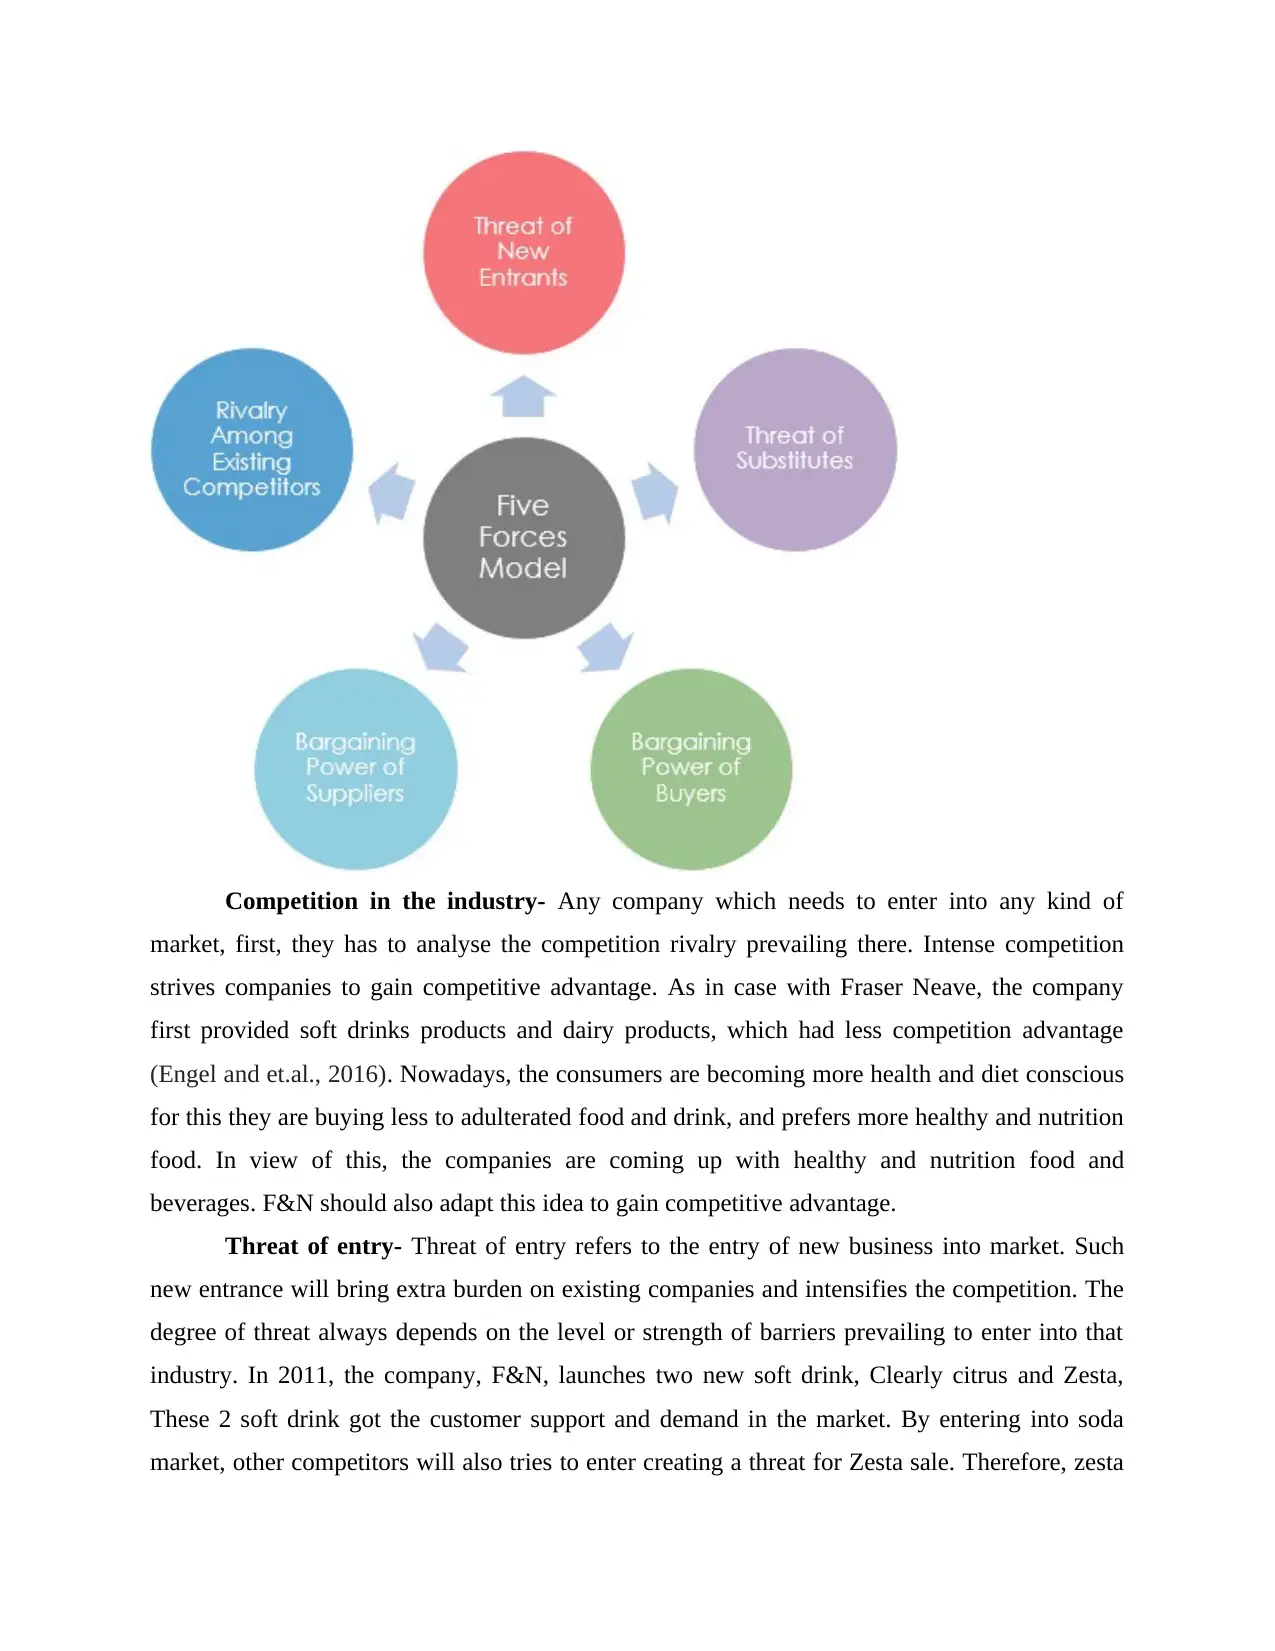
Competition in the industry- Any company which needs to enter into any kind of
market, first, they has to analyse the competition rivalry prevailing there. Intense competition
strives companies to gain competitive advantage. As in case with Fraser Neave, the company
first provided soft drinks products and dairy products, which had less competition advantage
(Engel and et.al., 2016). Nowadays, the consumers are becoming more health and diet conscious
for this they are buying less to adulterated food and drink, and prefers more healthy and nutrition
food. In view of this, the companies are coming up with healthy and nutrition food and
beverages. F&N should also adapt this idea to gain competitive advantage.
Threat of entry- Threat of entry refers to the entry of new business into market. Such
new entrance will bring extra burden on existing companies and intensifies the competition. The
degree of threat always depends on the level or strength of barriers prevailing to enter into that
industry. In 2011, the company, F&N, launches two new soft drink, Clearly citrus and Zesta,
These 2 soft drink got the customer support and demand in the market. By entering into soda
market, other competitors will also tries to enter creating a threat for Zesta sale. Therefore, zesta
Paraphrase This Document
Need a fresh take? Get an instant paraphrase of this document with our AI Paraphraser
should cautiously defence from competitor who entered into soda market. Besides this, 90% of
F&N products use sugar in their production, so sugar occupies a major raw material in product's
production (Yulihantini and Wardayati, 2017).
Bargaining power of supplier- Bargain power refers to how strong the suppliers stand
on their terms and conditions for supplying the company's products (Tang and Baker, 2016). The
more strong the power of supplier would be in an industry, the more it will become difficult for
the company to supply its products. In case with F&N, the company faces some sugar quality
problem with its current supplier. Now to cover up the company has to buy quality sugar, though
it costs more to them, to get back to their original status (Ferguson and Morton-Huddleston,
2016). For this they have to search for suppliers who provides them it with quality products at
affordable prices.
Bargaining power of buyer- It refers to the power of buyers which forces to cut down
prices and quality improvement. Buyers are full aware about all the products available into
market, they also know features along with their prices. They know which product provides best
quality and is cheaper. The F&N should try their level best to retain their customers by offering
best quality products with affordable prices.
Threat of substitute product- Substitute products are the products which are offered by
other companies with same features, benefits and price that your products got to offer
(Nkundabanyanga and et.al., 2017). This threat may affect the company competitive
environment and burden the it with entrance of such products. In regards with company, F&N
came up with the Pasteurised fresh milk, the range for children and adults, which when mixed
with any other food or beverages they innovate into Lo-Fat Hi-Cal milk that provides less fat and
more healthier fresh milk to body. This product was appreciated by the people very well. But
later on many other substitute products also got available into the market with same features.
2. FOUR years of financial performance Profitability:
Gross Profit Ratio:
RM'000 (Except Gross Profit
Margin) Year 2019 Year 2018 Year 2017 Year 2016
Gross Profit 1266766 1149682 1368491 1484014
Revenues 4077138 3870954 4101374 4167567
Gross Profit Margin =
Gross Profit / Revenues * 100 31.07% 29.70% 33.37% 35.61%
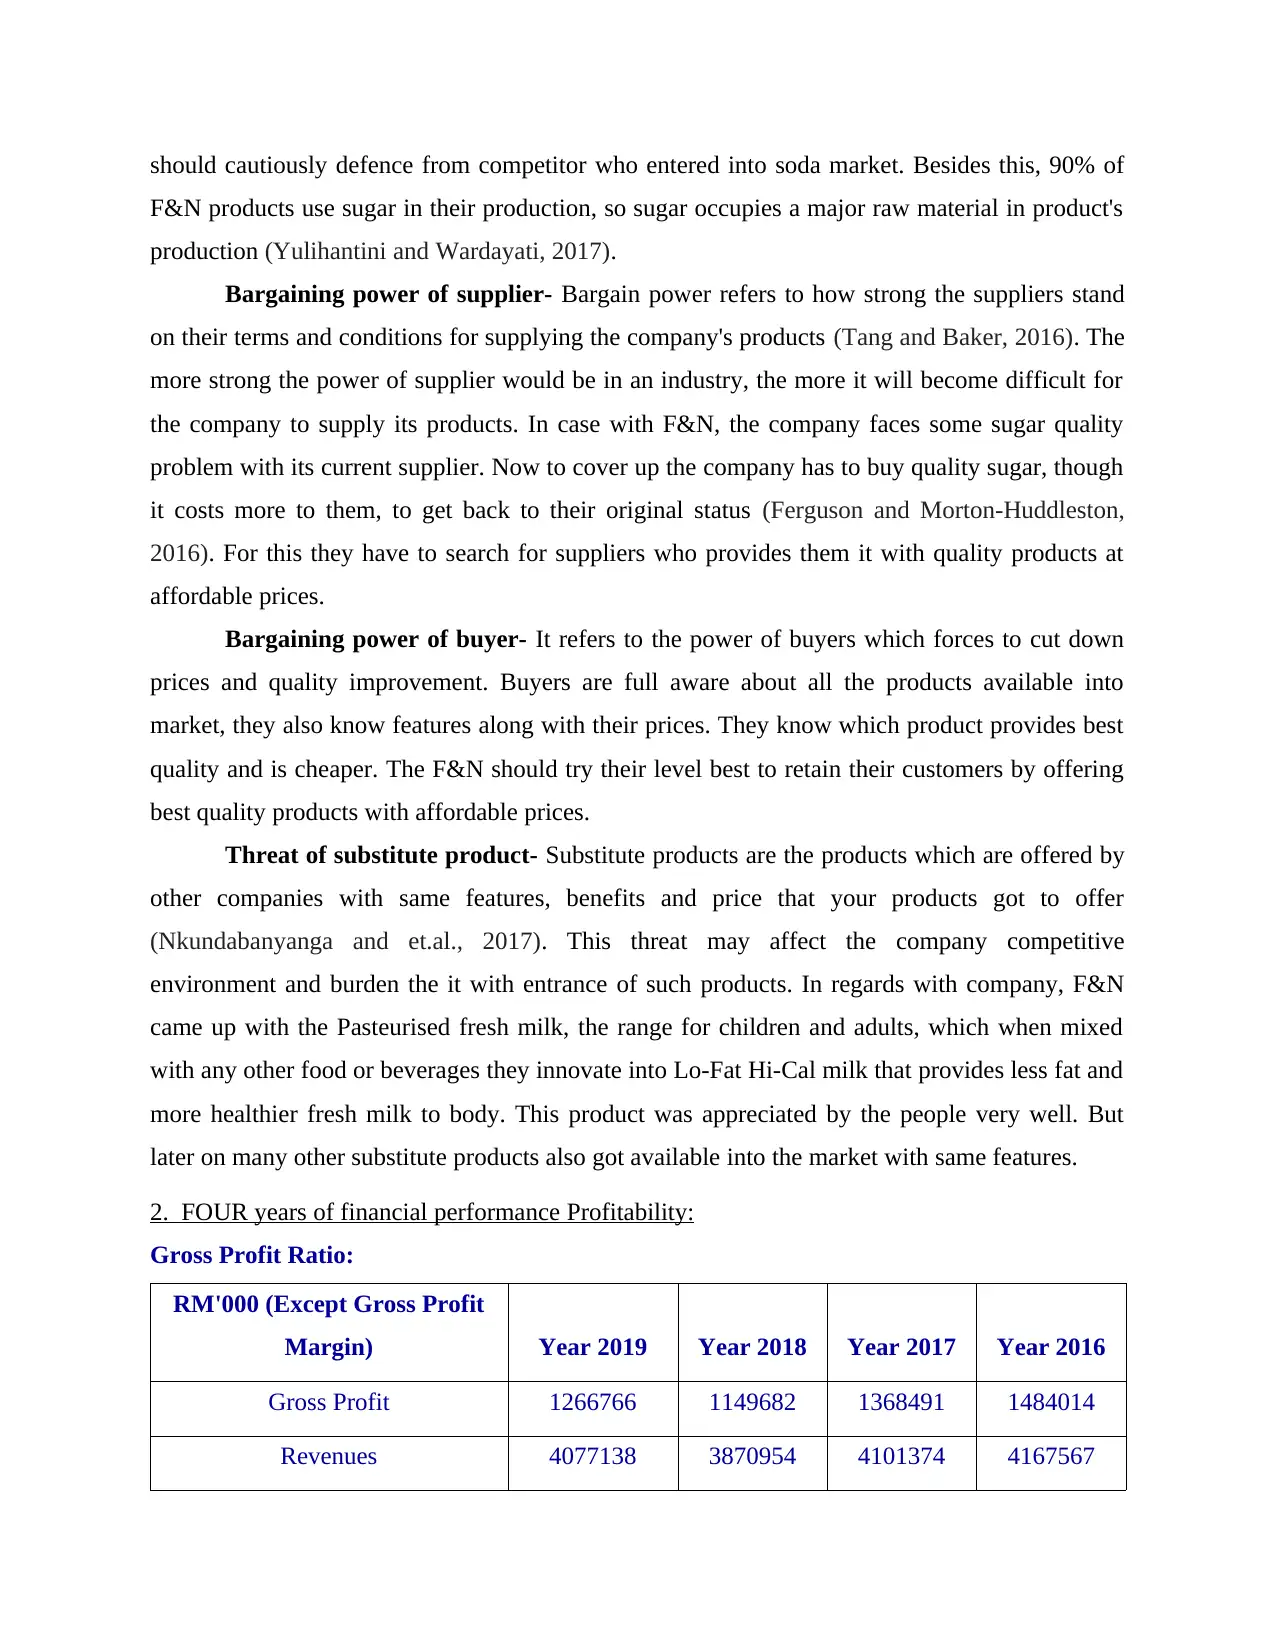
Above displayed table contains gross profit ratios of Fraser and Neave Ltd(F&N) which
shows corporation's gross profitability generating efficiency form its core trade/business
functions. In 2016, F&N has reported GP ratio of 35.61% in year 2016 which has been reached
to 33.37%, 29.70% and 31.07% in year 2017, 2018 and 2019 respectively. There is declining
trend in gross profit margin from 2016 to year 2018 indicates that F&N plc's GP generation
capabilities have been dropped. Further notable thing here is that corporation's gross profit
margin is increased in 2019 slightly which is an indication that corporation has improved their
GP generation efficiency (Munge, Kimani and Ngugi, 2016).
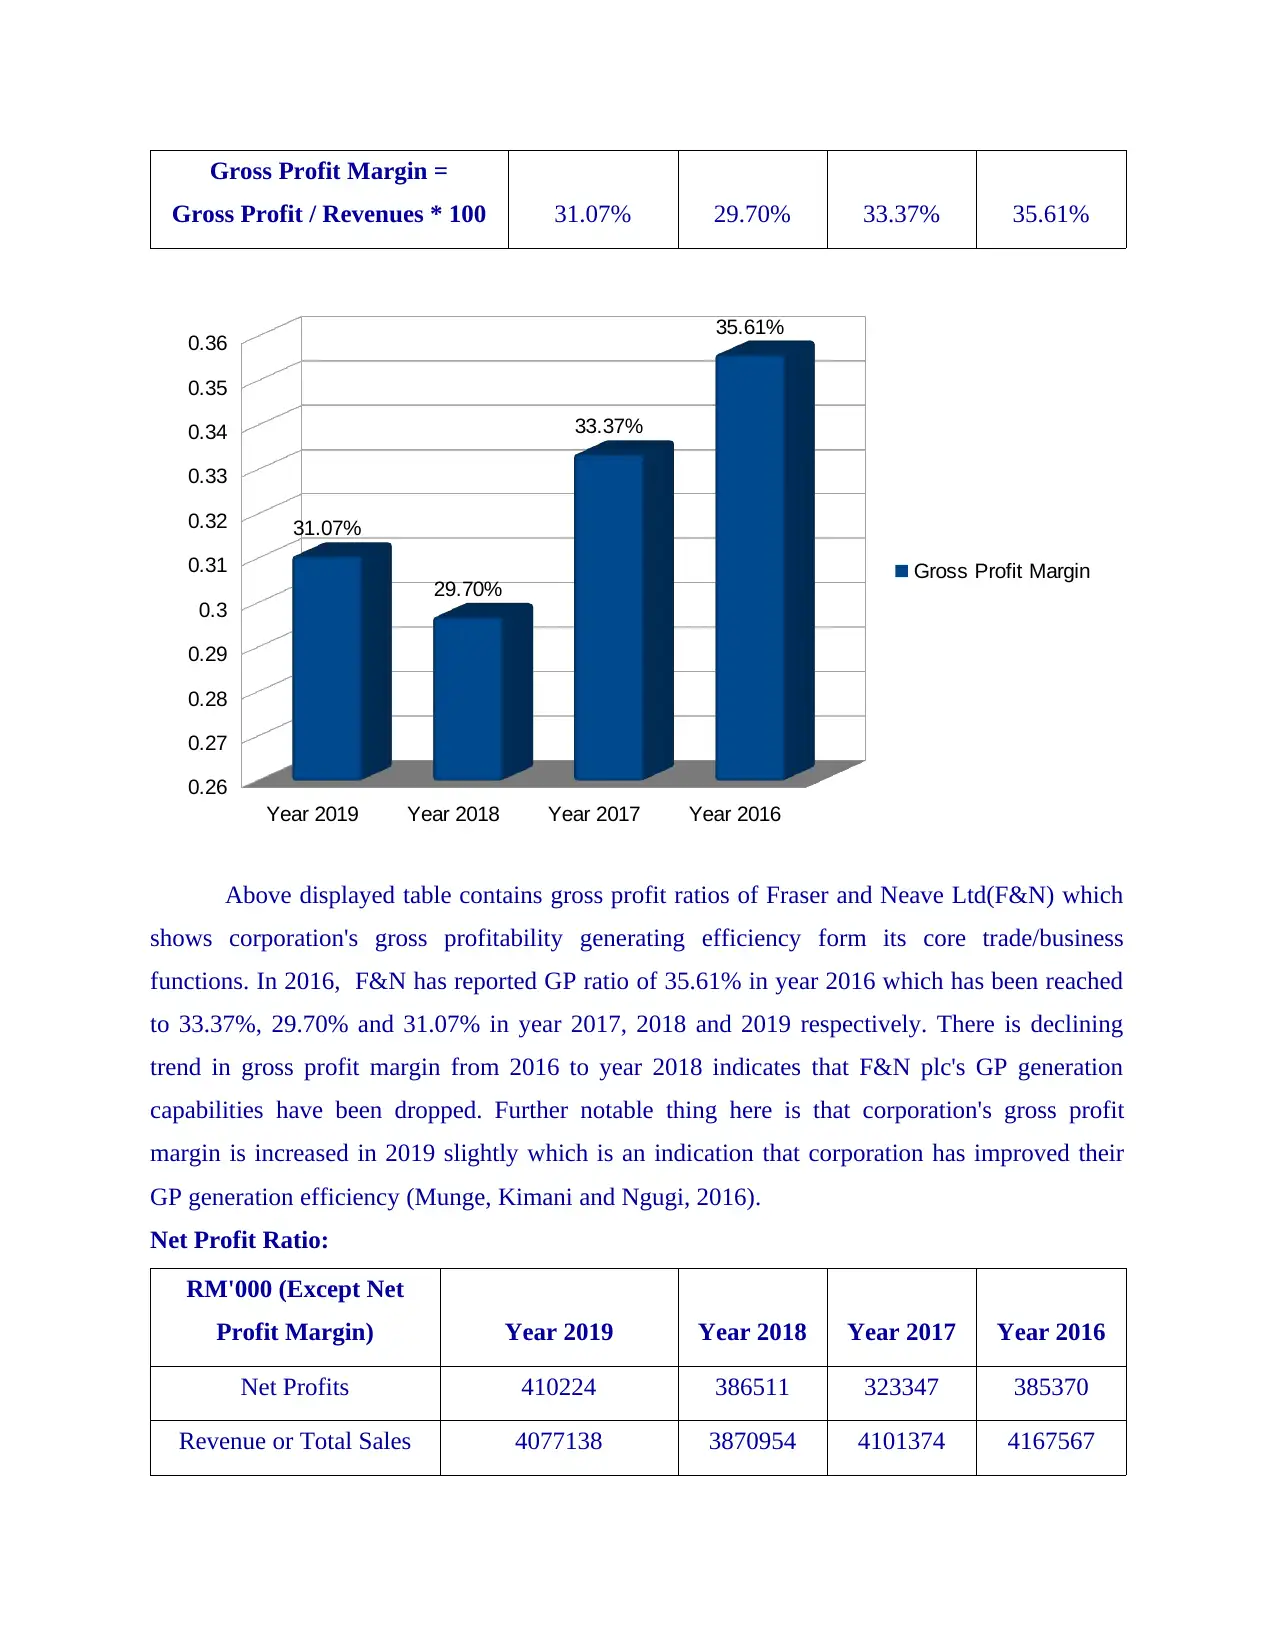
Net Profit Ratio:
RM'000 (Except Net
Profit Margin) Year 2019 Year 2018 Year 2017 Year 2016
Net Profits 410224 386511 323347 385370
Revenue or Total Sales 4077138 3870954 4101374 4167567
Year 2019 Year 2018 Year 2017 Year 2016
0.26
0.27
0.28
0.29
0.3
0.31
0.32
0.33
0.34
0.35
0.36
31.07%
29.70%
33.37%
35.61%
Gross Profit Margin
Gross Profit / Revenues * 100 31.07% 29.70% 33.37% 35.61%
Above displayed table contains gross profit ratios of Fraser and Neave Ltd(F&N) which
shows corporation's gross profitability generating efficiency form its core trade/business
functions. In 2016, F&N has reported GP ratio of 35.61% in year 2016 which has been reached
to 33.37%, 29.70% and 31.07% in year 2017, 2018 and 2019 respectively. There is declining
trend in gross profit margin from 2016 to year 2018 indicates that F&N plc's GP generation
capabilities have been dropped. Further notable thing here is that corporation's gross profit
margin is increased in 2019 slightly which is an indication that corporation has improved their
GP generation efficiency (Munge, Kimani and Ngugi, 2016).
Net Profit Ratio:
RM'000 (Except Net
Profit Margin) Year 2019 Year 2018 Year 2017 Year 2016
Net Profits 410224 386511 323347 385370
Revenue or Total Sales 4077138 3870954 4101374 4167567
Year 2019 Year 2018 Year 2017 Year 2016
0.26
0.27
0.28
0.29
0.3
0.31
0.32
0.33
0.34
0.35
0.36
31.07%
29.70%
33.37%
35.61%
Gross Profit Margin
⊘ This is a preview!⊘
Do you want full access?
Subscribe today to unlock all pages.
Trusted by 1+ million students worldwide
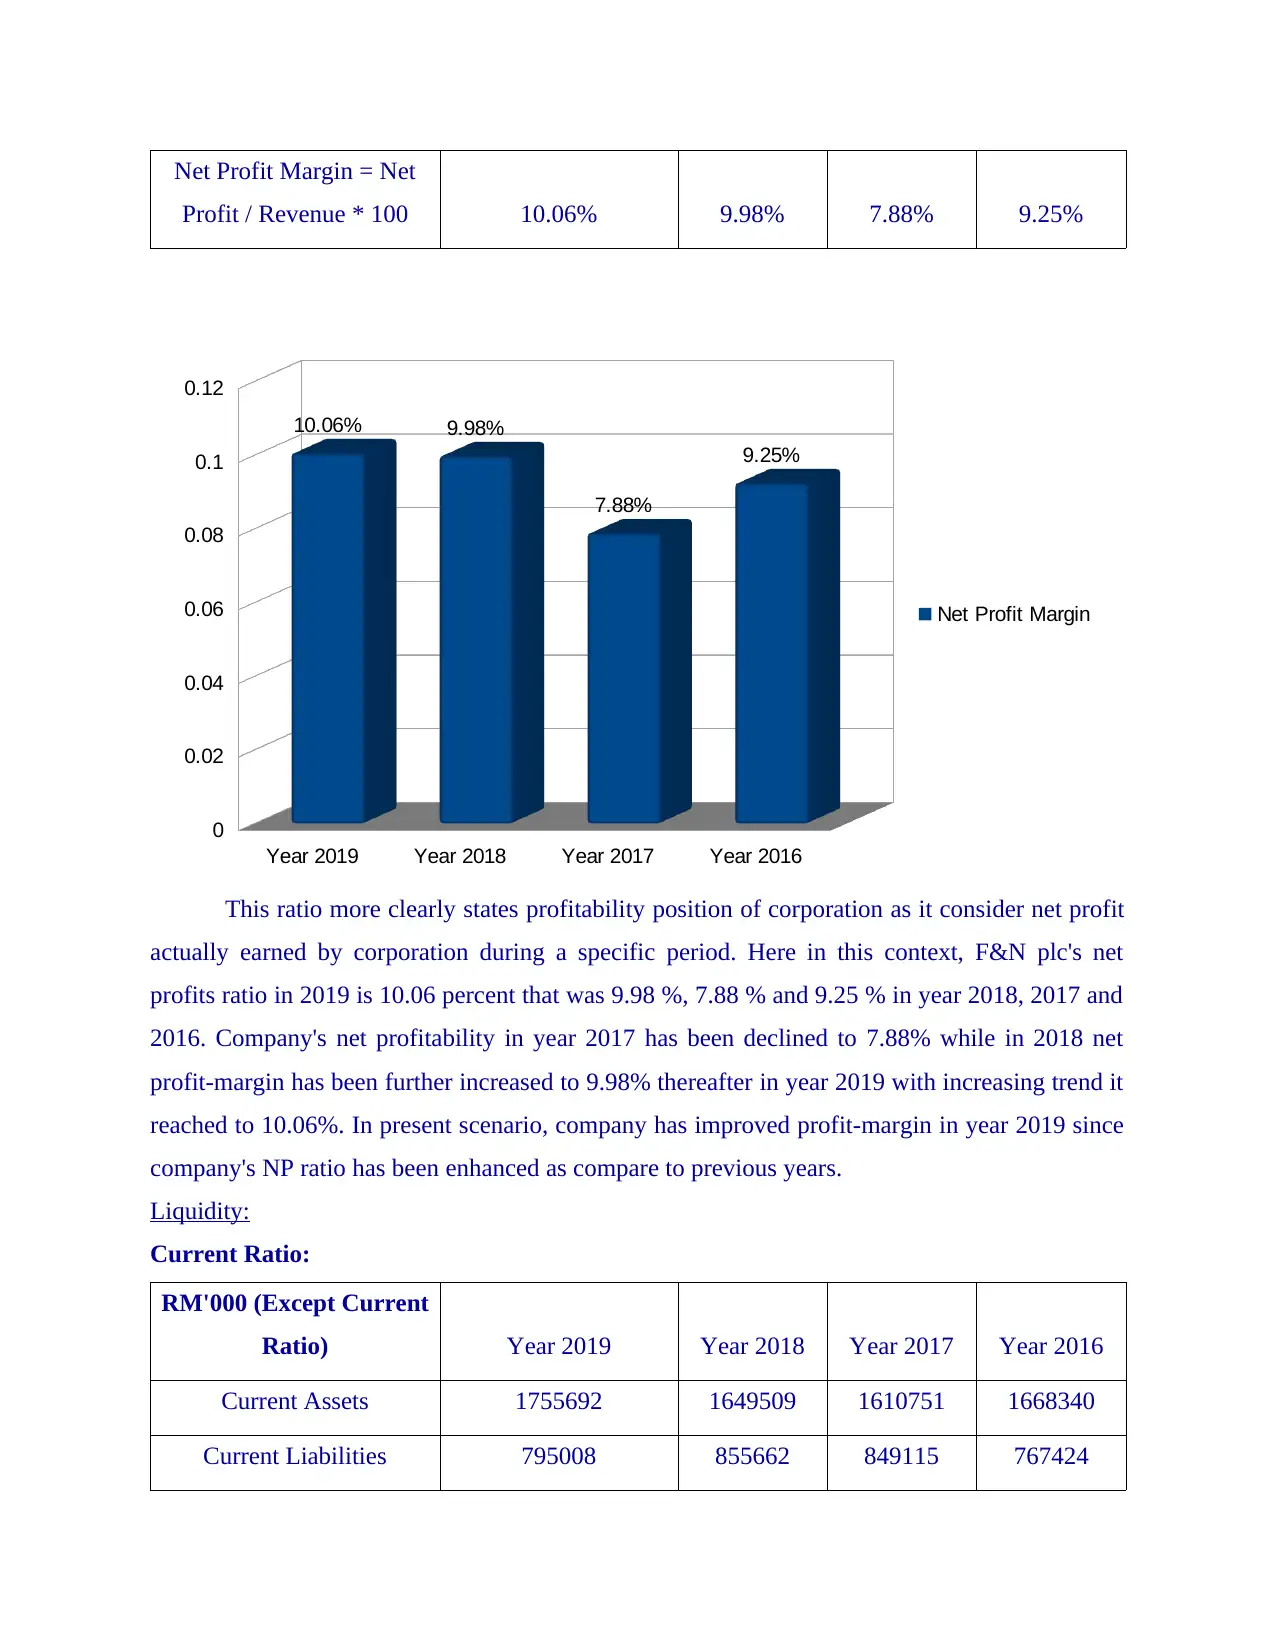
Net Profit Margin = Net
Profit / Revenue * 100 10.06% 9.98% 7.88% 9.25%
This ratio more clearly states profitability position of corporation as it consider net profit
actually earned by corporation during a specific period. Here in this context, F&N plc's net
profits ratio in 2019 is 10.06 percent that was 9.98 %, 7.88 % and 9.25 % in year 2018, 2017 and
2016. Company's net profitability in year 2017 has been declined to 7.88% while in 2018 net
profit-margin has been further increased to 9.98% thereafter in year 2019 with increasing trend it
reached to 10.06%. In present scenario, company has improved profit-margin in year 2019 since
company's NP ratio has been enhanced as compare to previous years.
Liquidity:
Current Ratio:
RM'000 (Except Current
Ratio) Year 2019 Year 2018 Year 2017 Year 2016
Current Assets 1755692 1649509 1610751 1668340
Current Liabilities 795008 855662 849115 767424
Year 2019 Year 2018 Year 2017 Year 2016
0
0.02
0.04
0.06
0.08
0.1
0.12
10.06% 9.98%
7.88%
9.25%
Net Profit Margin
Paraphrase This Document
Need a fresh take? Get an instant paraphrase of this document with our AI Paraphraser
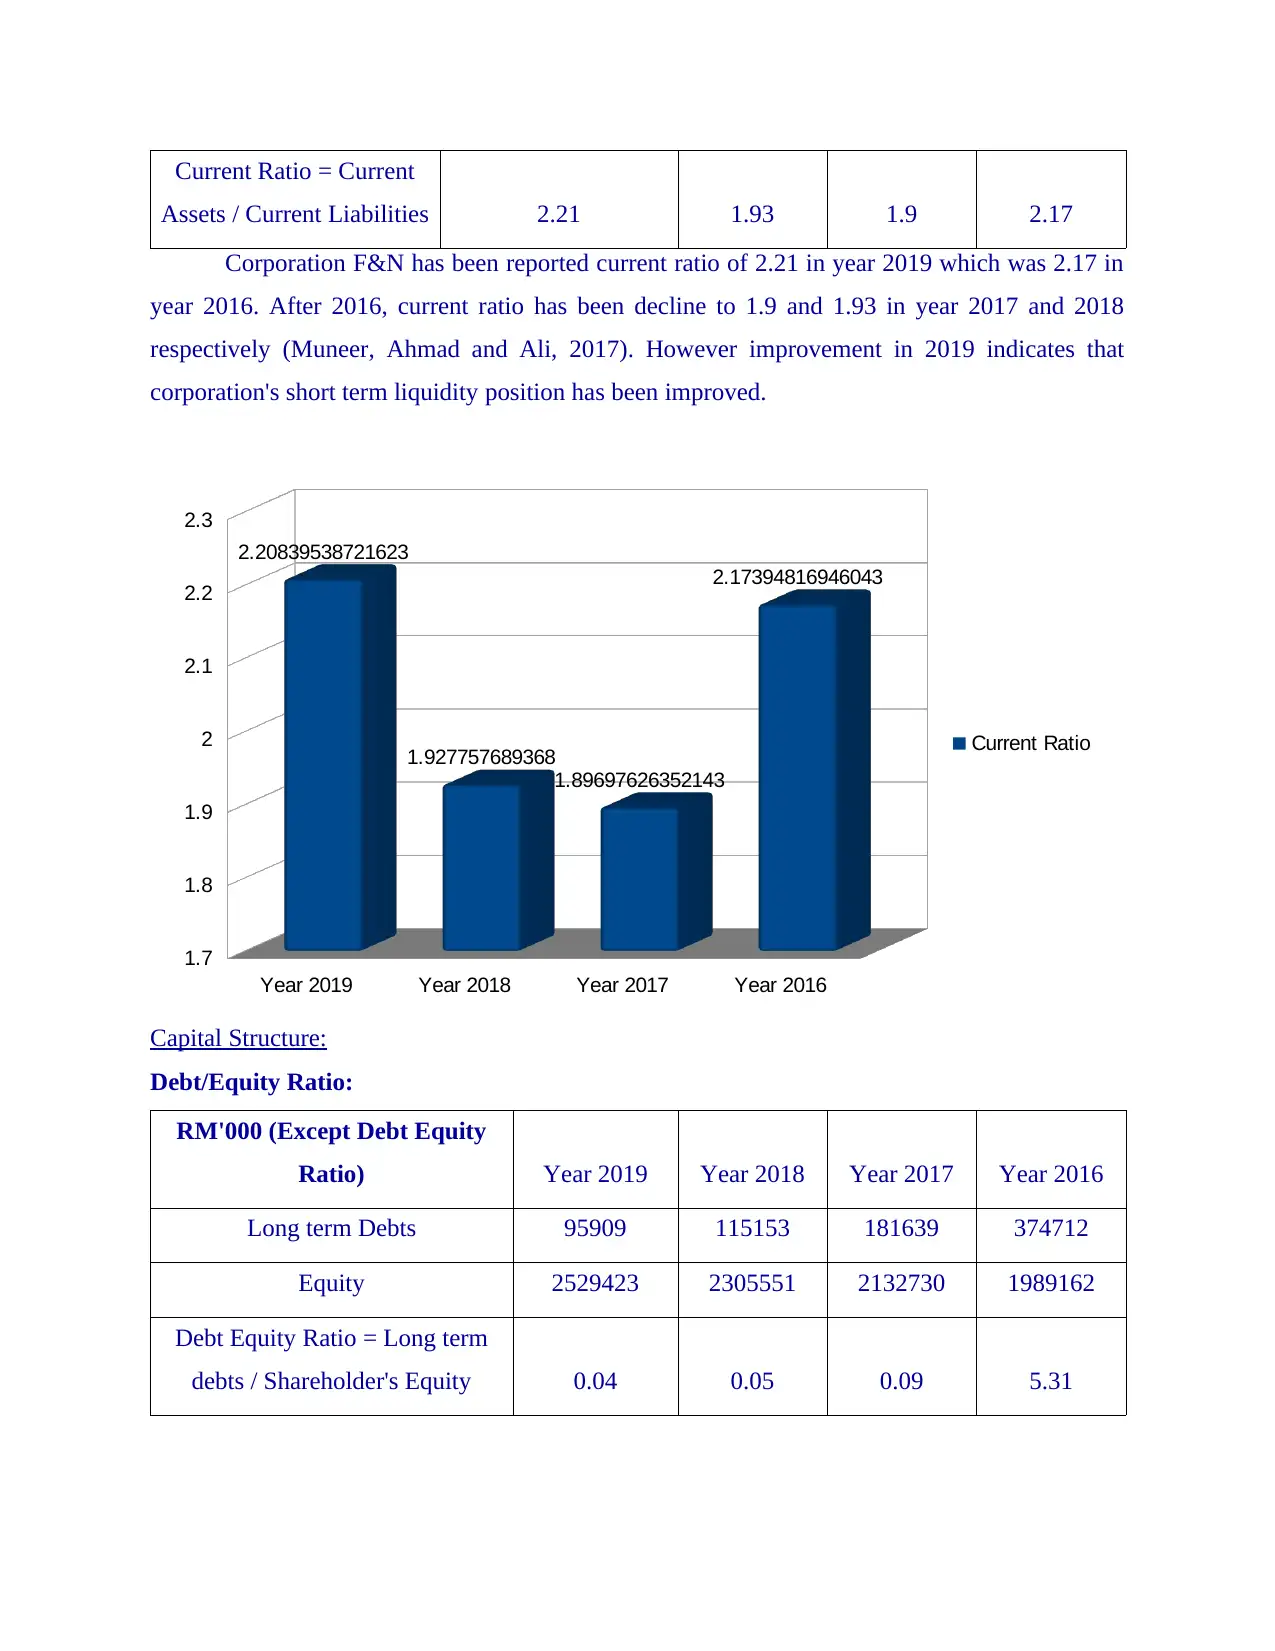
Current Ratio = Current
Assets / Current Liabilities 2.21 1.93 1.9 2.17
Corporation F&N has been reported current ratio of 2.21 in year 2019 which was 2.17 in
year 2016. After 2016, current ratio has been decline to 1.9 and 1.93 in year 2017 and 2018
respectively (Muneer, Ahmad and Ali, 2017). However improvement in 2019 indicates that
corporation's short term liquidity position has been improved.
Capital Structure:
Debt/Equity Ratio:
RM'000 (Except Debt Equity
Ratio) Year 2019 Year 2018 Year 2017 Year 2016
Long term Debts 95909 115153 181639 374712
Equity 2529423 2305551 2132730 1989162
Debt Equity Ratio = Long term
debts / Shareholder's Equity 0.04 0.05 0.09 5.31
Year 2019 Year 2018 Year 2017 Year 2016
1.7
1.8
1.9
2
2.1
2.2
2.3
2.20839538721623
1.927757689368
1.89697626352143
2.17394816946043
Current Ratio
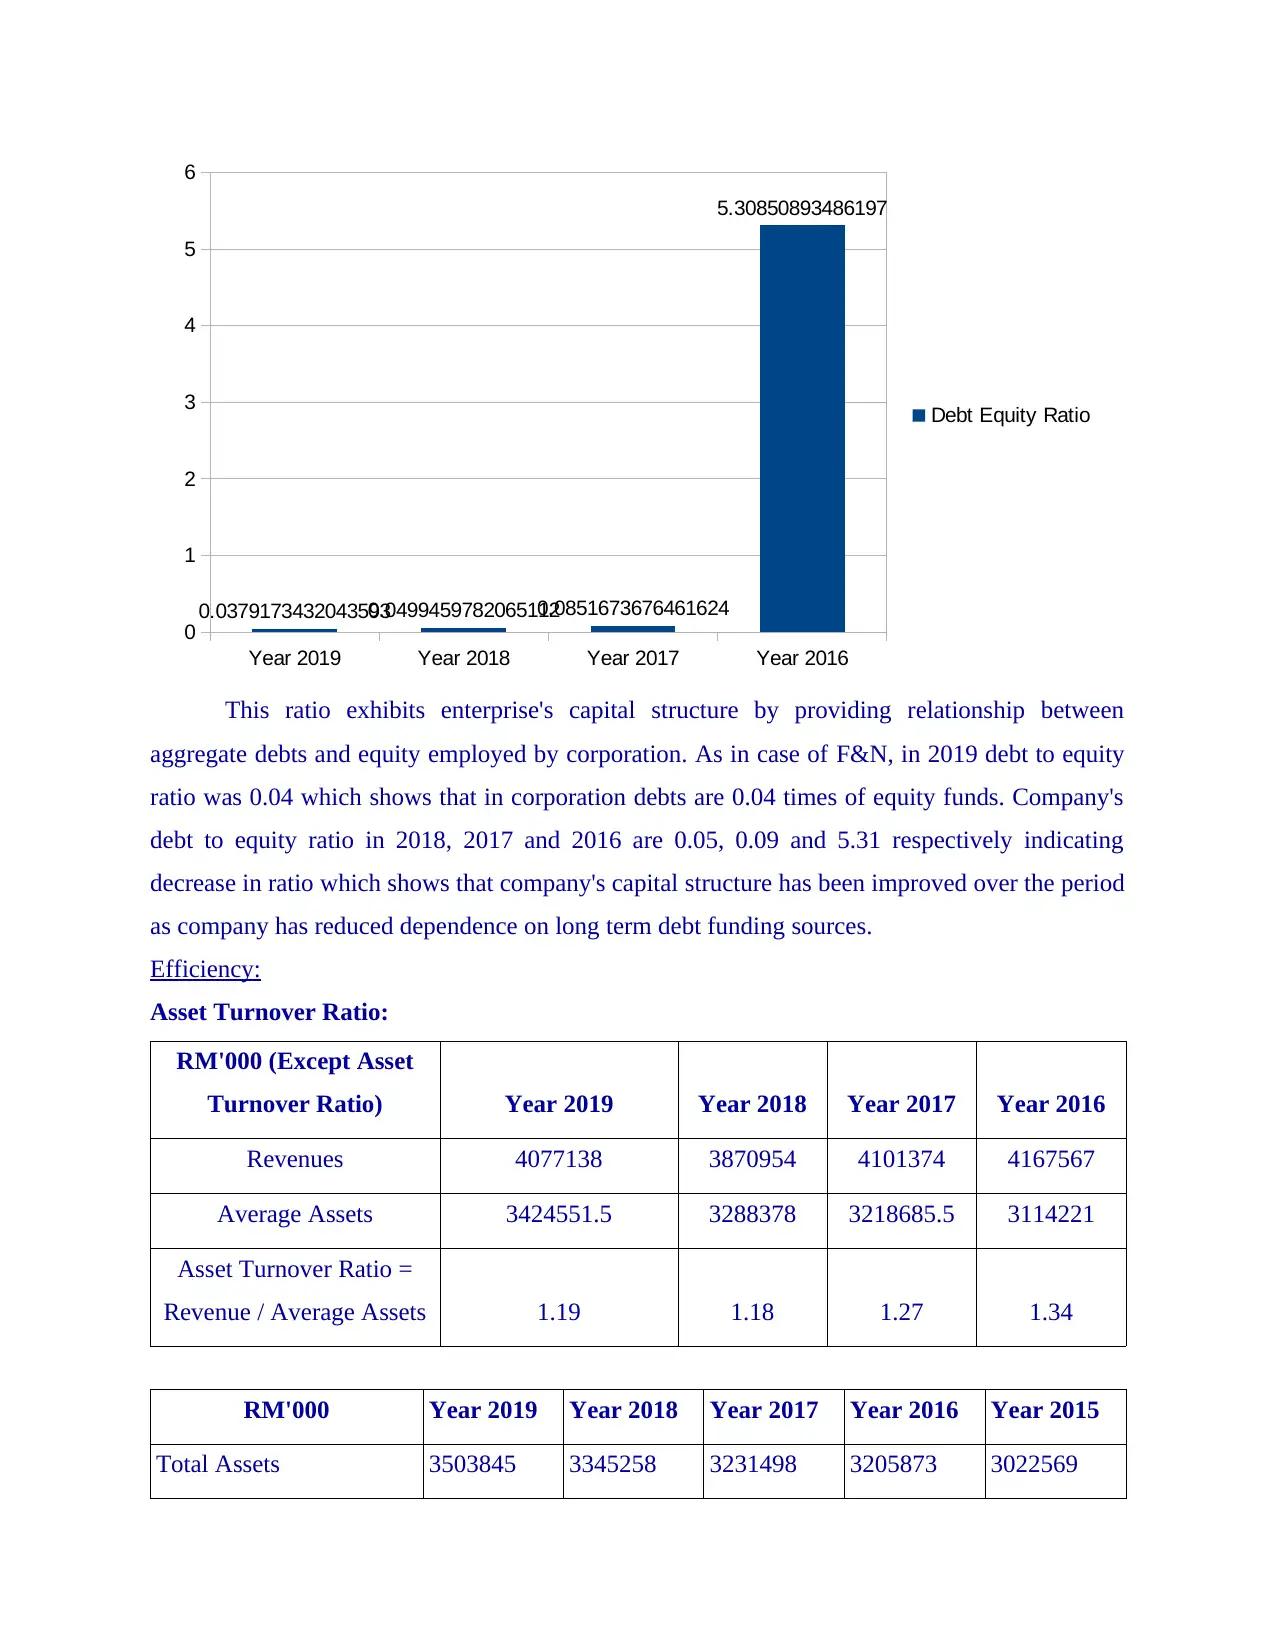
This ratio exhibits enterprise's capital structure by providing relationship between
aggregate debts and equity employed by corporation. As in case of F&N, in 2019 debt to equity
ratio was 0.04 which shows that in corporation debts are 0.04 times of equity funds. Company's
debt to equity ratio in 2018, 2017 and 2016 are 0.05, 0.09 and 5.31 respectively indicating
decrease in ratio which shows that company's capital structure has been improved over the period
as company has reduced dependence on long term debt funding sources.
Efficiency:
Asset Turnover Ratio:
RM'000 (Except Asset
Turnover Ratio) Year 2019 Year 2018 Year 2017 Year 2016
Revenues 4077138 3870954 4101374 4167567
Average Assets 3424551.5 3288378 3218685.5 3114221
Asset Turnover Ratio =
Revenue / Average Assets 1.19 1.18 1.27 1.34
RM'000 Year 2019 Year 2018 Year 2017 Year 2016 Year 2015
Total Assets 3503845 3345258 3231498 3205873 3022569
Year 2019 Year 2018 Year 2017 Year 2016
0
1
2
3
4
5
6
0.03791734320435930.04994597820651120.0851673676461624
5.30850893486197
Debt Equity Ratio
⊘ This is a preview!⊘
Do you want full access?
Subscribe today to unlock all pages.
Trusted by 1+ million students worldwide
1 out of 22
Related Documents


Your All-in-One AI-Powered Toolkit for Academic Success.
+13062052269
info@desklib.com
Available 24*7 on WhatsApp / Email
![[object Object]](/_next/static/media/star-bottom.7253800d.svg)
Unlock your academic potential
Copyright © 2020–2026 A2Z Services. All Rights Reserved. Developed and managed by ZUCOL.