Marketing Research Report: Fonterra Product Preferences and Strategies

Verified

Added on  2023/06/03

|47
|5030
|435
Report
AI Summary
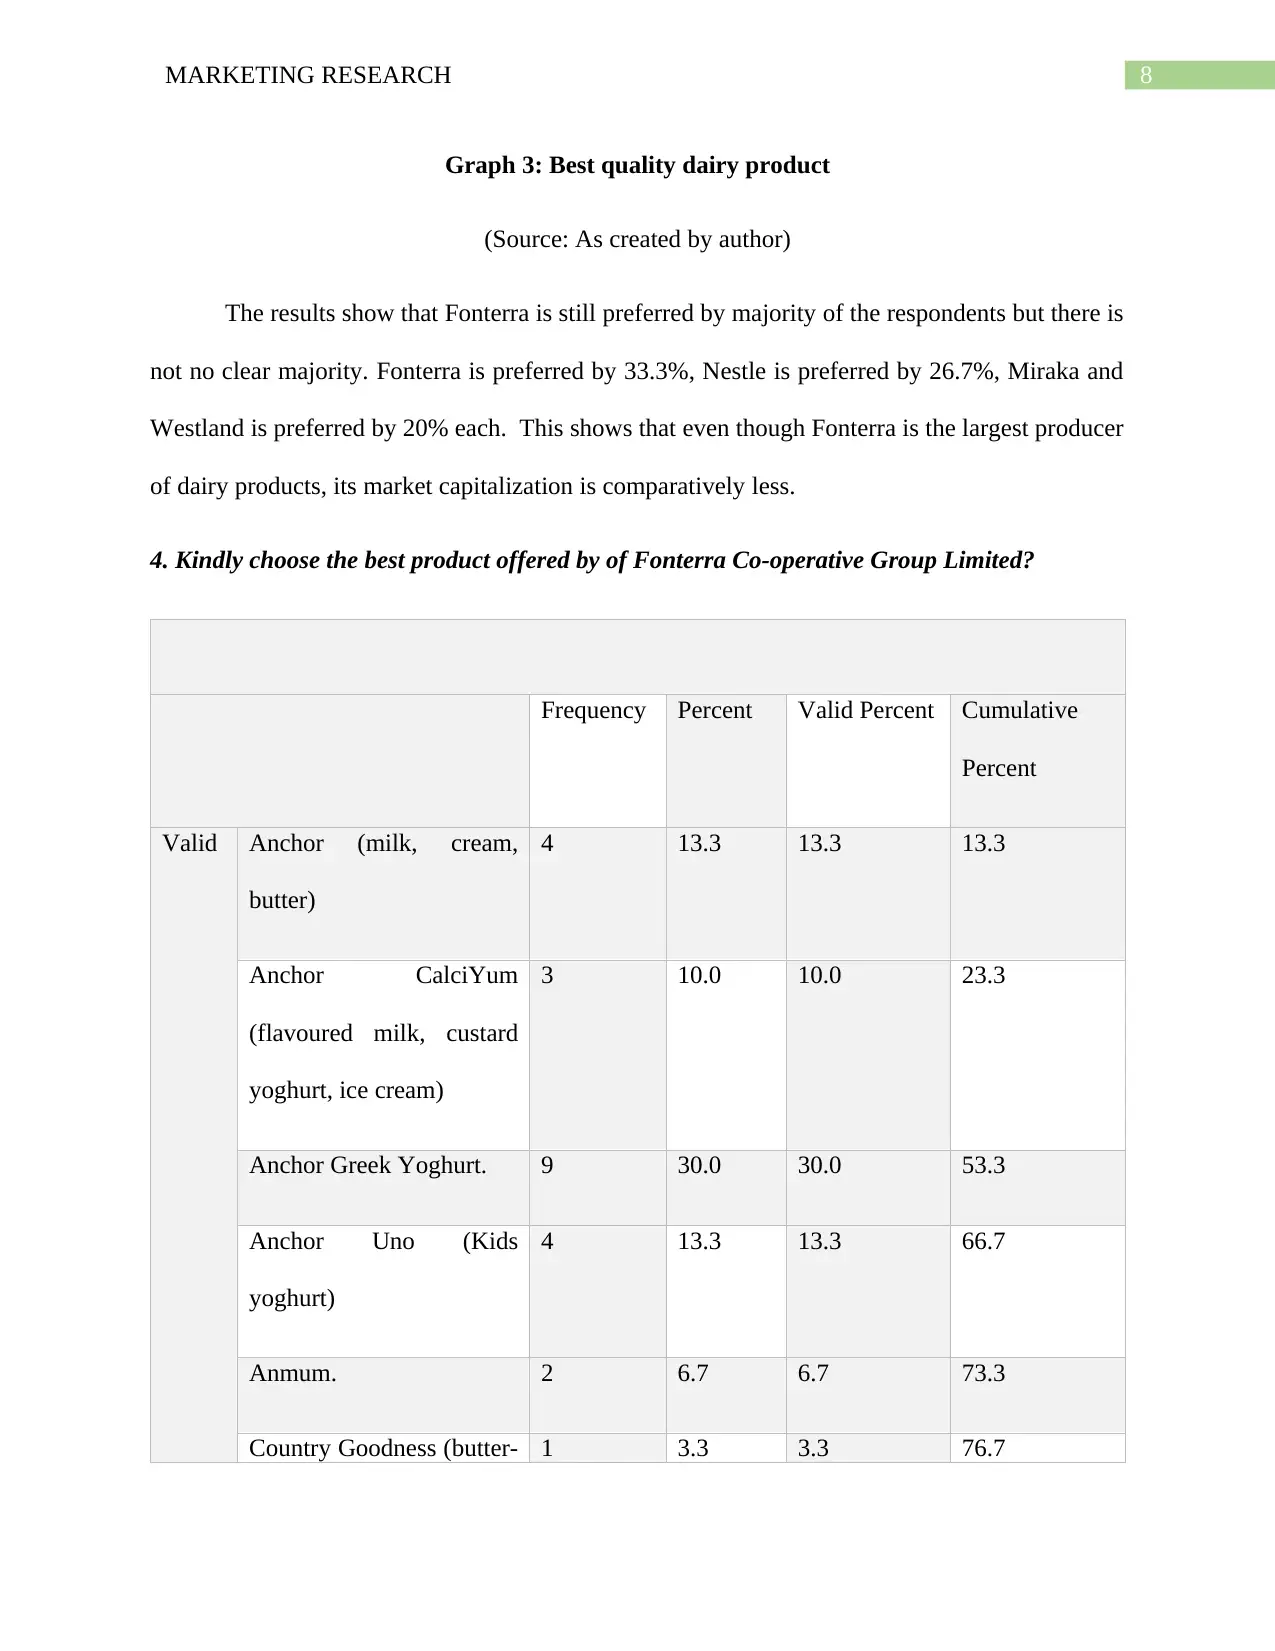
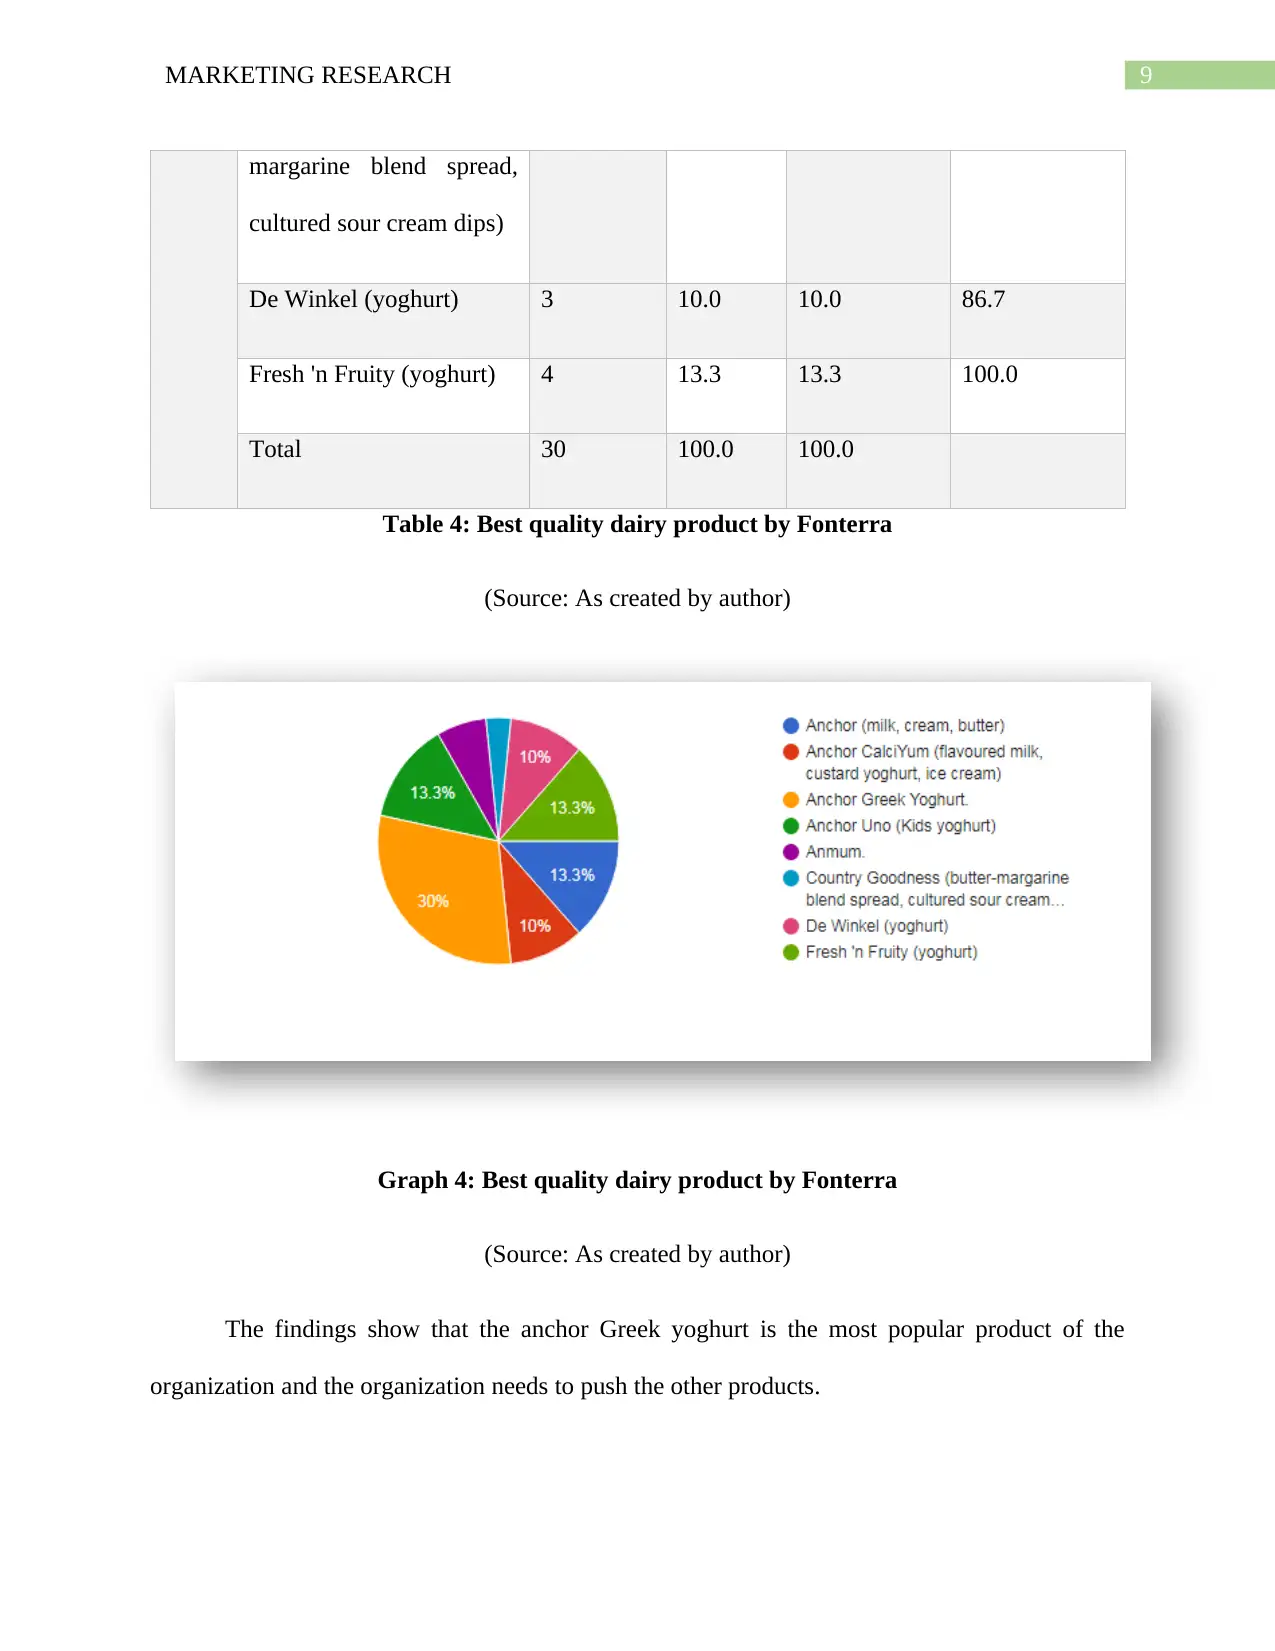
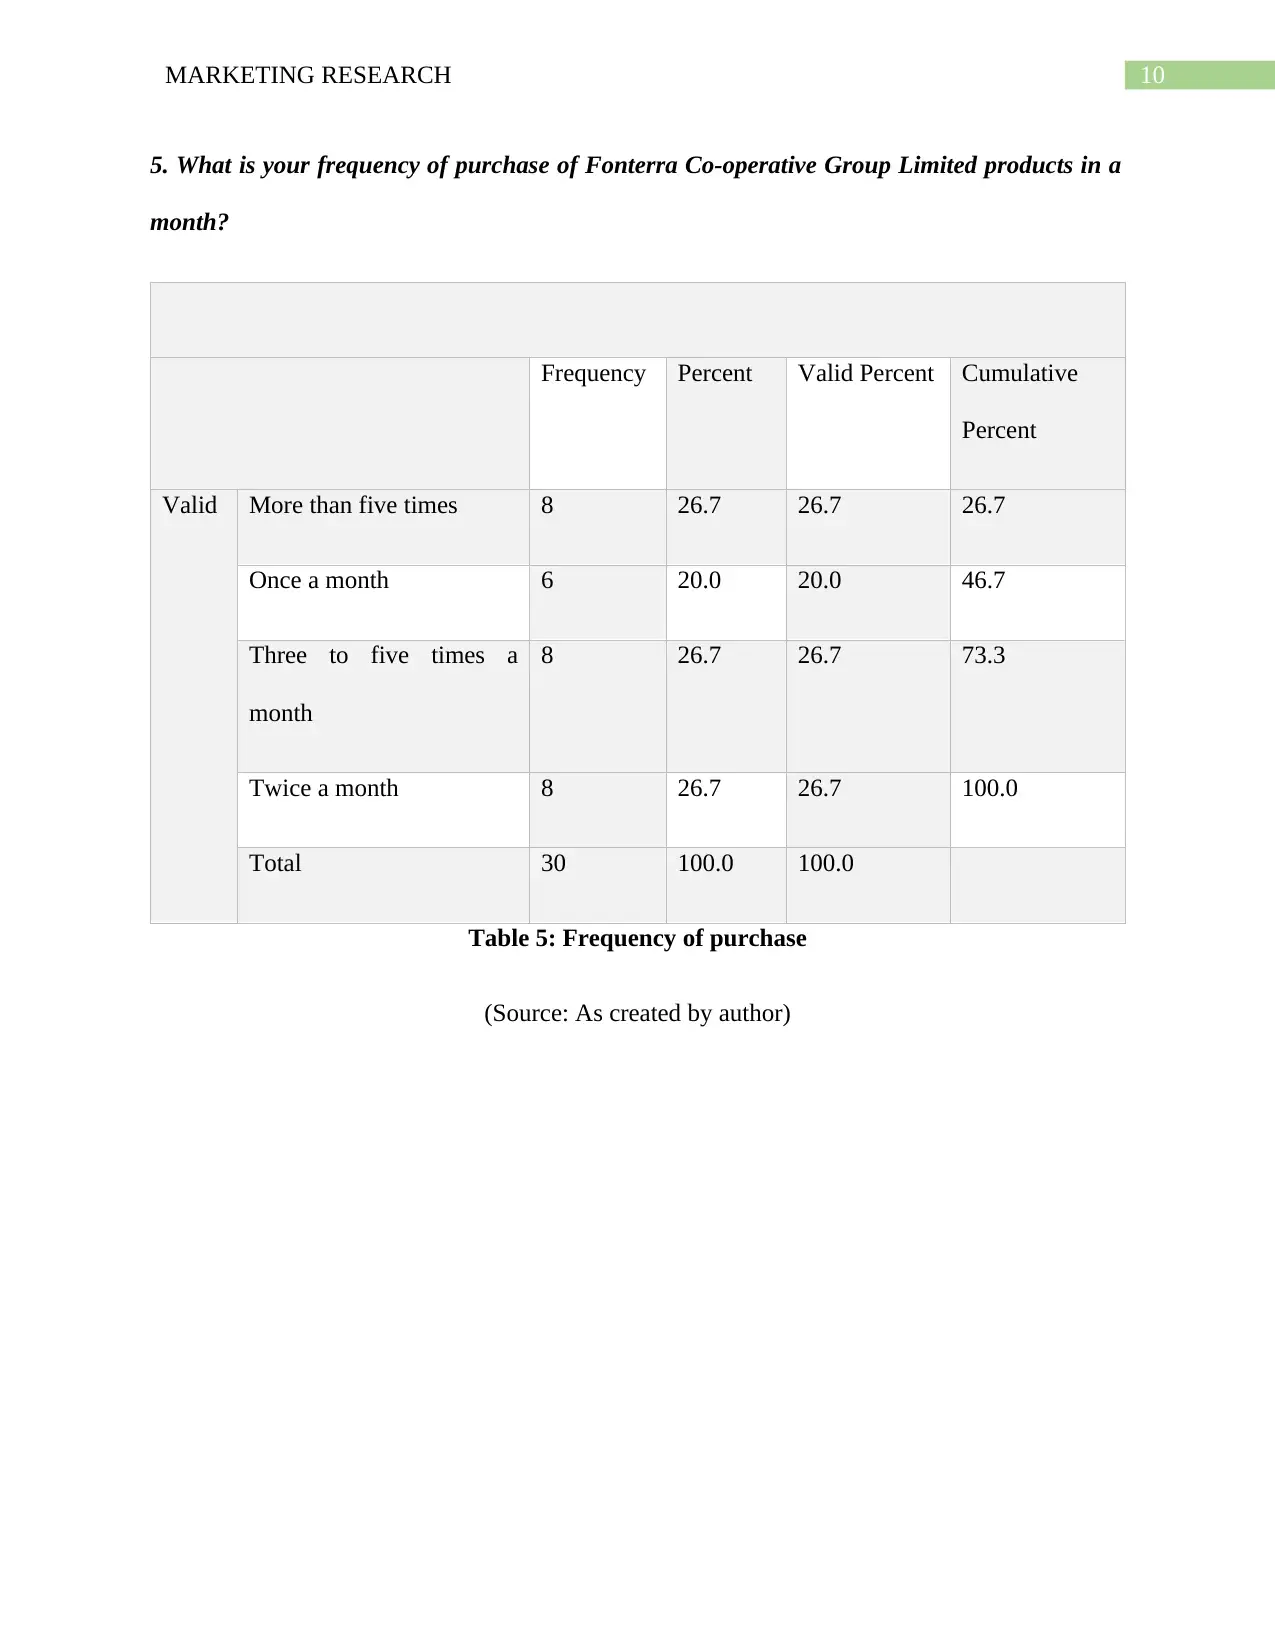
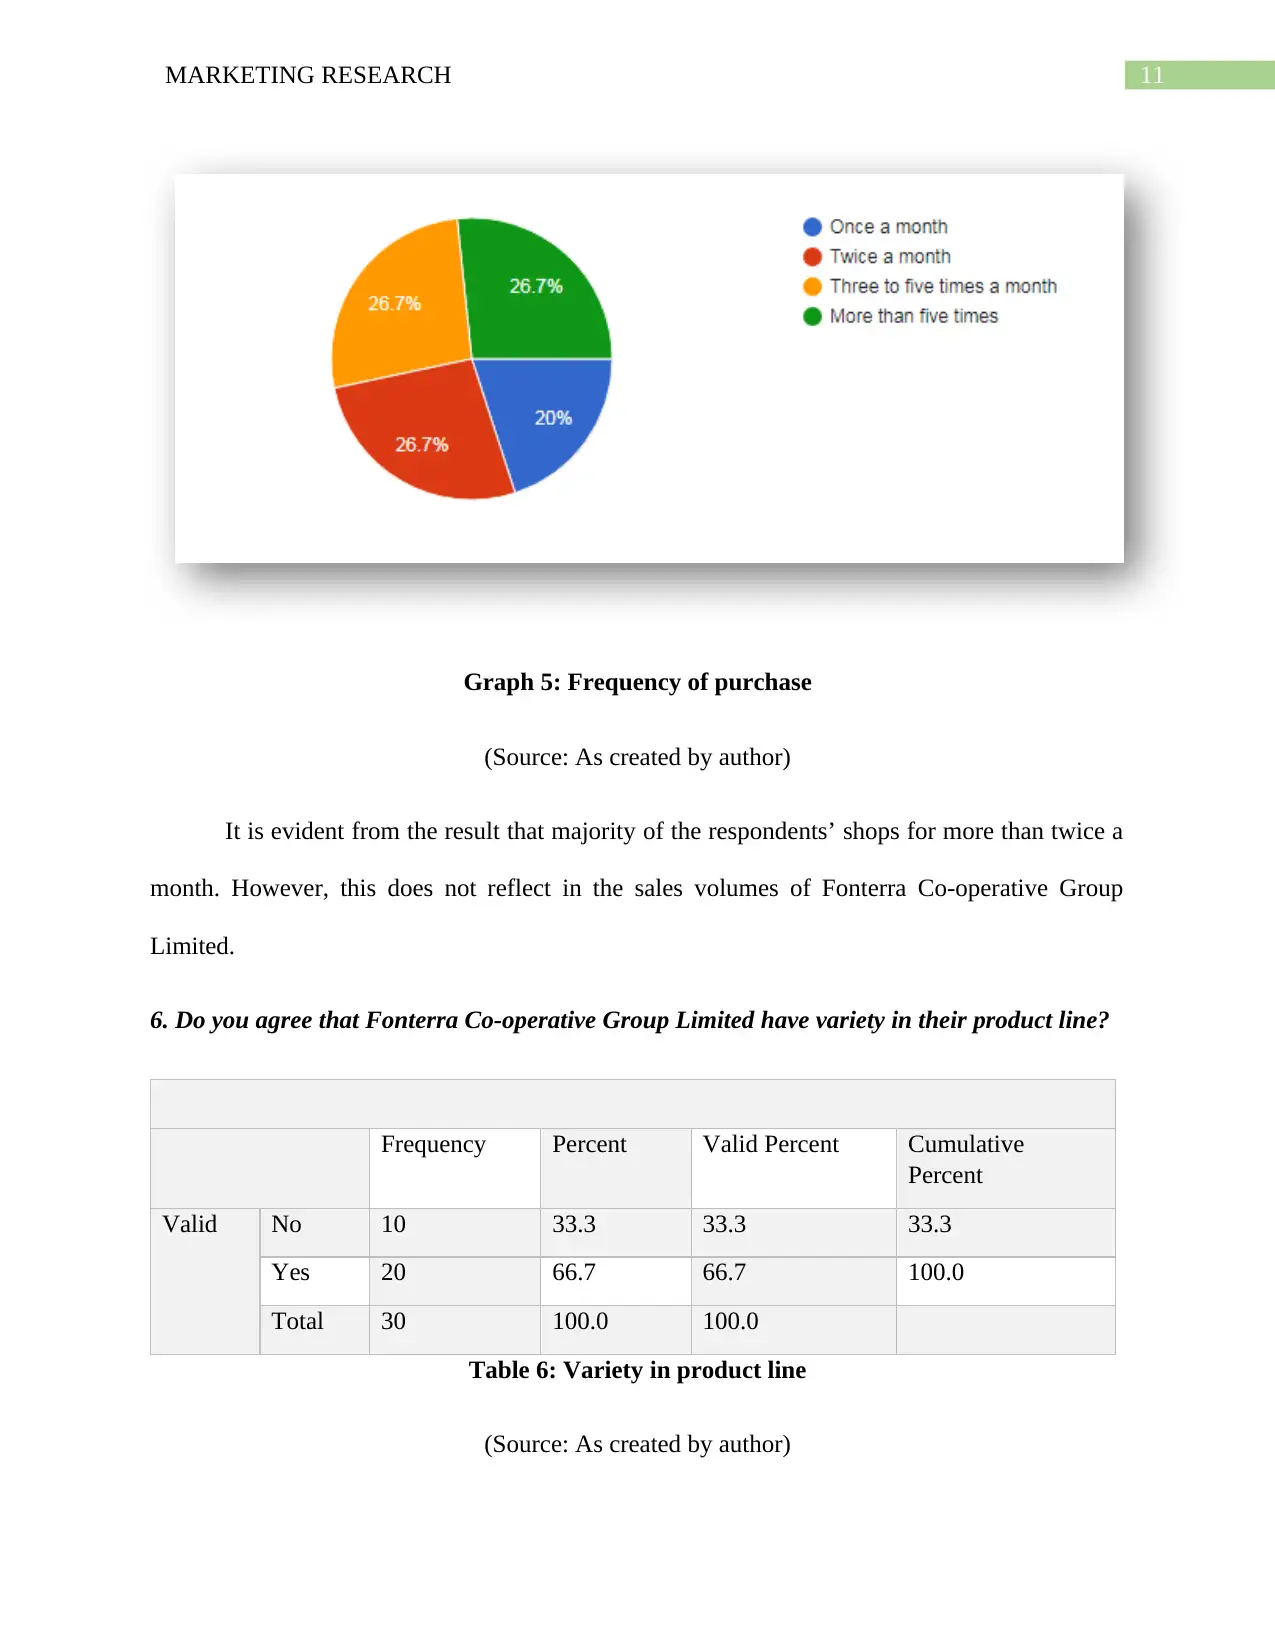
This marketing research report investigates consumer perceptions of Fonterra Co-operative Group Limited, the largest dairy product company in New Zealand, despite experiencing challenges in profit margin and growth rate. The study, based on a survey of 30 consumers, employed a single research design with primary data collected through online surveys using Google Forms, and analyzed using SPSS. The research identifies the most and least popular Fonterra products, revealing that Greek Yoghurt is the most popular, while Country Goodness and Anmum are least popular. Statistical analyses, including frequencies, chi-square tests, descriptive statistics, and cross-tabulations, were conducted to develop relevant findings. The report also indicates that consumers with higher disposable incomes are more frequent purchasers. Based on these findings, the report recommends product line adjustments and price changes to better cater to diverse consumer segments and improve Fonterra's marketing strategies.
Document Page
Running head: MARKETING RESEARCH
Marketing Research
Name of the student
Name of the university
Author note
tabler-icon-diamond-filled.svg

Paraphrase This Document

Need a fresh take? Get an instant paraphrase of this document with our AI Paraphraser
Document Page
1MARKETING RESEARCH
Executive Summary
This report had conducted the market research on the company, Fonterra Co-operative Group
Limited. The market survey consisted of 30 respondents that were consumers and the findings
have shown the most popular products and the least popular products. The report has conducted
different statistical analysis using statistical tool named SPSS where frequencies have been
identified, chi square has been calculated, descriptive statistics , central tendency and cross
tabulation also been conducted to develop relevant findings. It has been recommended that
organization should make changes to their product line to develop a product line that is
accessible to all types of consumers having different disposable income. The outcome of the
study shows that Greek Yoghurt is the most popular product of Fonterra Co-operative Group
Limited, and Country Goodness (butter-margarine blend spread, cultured sour cream dips) and
Anmum are least popular products. The findings of the study also shows that consumers with
higher disposable income are more frequent purchasers. Therefore, it has been recommended that
Fonterra should reduce the prices of the products offered and change the least popular product in
the product line.
Document Page
2MARKETING RESEARCH
Table of Contents
Introduction......................................................................................................................................3
Research methodology.....................................................................................................................3
Findings and analysis.......................................................................................................................4
Frequencies and Charts................................................................................................................4
Cross Tabulation........................................................................................................................13
Central tendency........................................................................................................................27
Chi Square test...........................................................................................................................31
Discussion......................................................................................................................................37
Recommendation...........................................................................................................................39
Conclusion.....................................................................................................................................39
References and Bibliography.........................................................................................................41
Appendix........................................................................................................................................42
Document Page
3MARKETING RESEARCH
Introduction
This report has conducted a marketing survey on the company named Fonterra Co-
operative Group Limited which is the largest dairy product company in New Zealand. Even
though, company had increased their level of production in the past decade but it has not
increased their profit margin significantly and they have not been able to increase their growth
rate (Louisson, 2018). The report is the continuation of the previous report which has aimed to
identify the perception of the consumers towards the organizational products and develop
strategies to improve the payout of Fonterra Co-operative Group Limited. The report has
followed the methods mentioned in the proposal to develop relevant findings.
Research methodology
As stated in the previous section research methodology is mostly kept the same but the
instead of using the mixed method analysis, the study has only used a single research design. The
market survey only comprised of primary data collection as using mixed method would have
significantly increased the overall time span and cost of the research. While conducting the
survey, it has been seen that primary data is sufficient to provide valuable information regarding
the product line of Fonterra and consumer opinion regarding the products.
The study has conducted online surveys by using google forms so that chances of getting
missing values can be avoided. The study has conducted practical research so that the result
generated can be used to provide suitable recommendations that can be used by the managers of
Fonterra to improve their marketing strategies.
The study has used simple random sampling to collect data randomly from population in
New Zealand. The sample size in the study is 30 for ease of calculation and reducing the overall
tabler-icon-diamond-filled.svg

Paraphrase This Document

Need a fresh take? Get an instant paraphrase of this document with our AI Paraphraser
Document Page
4MARKETING RESEARCH
cost of the research. Moreover, the study did not use regression analysis for inferential statistics
and cross tabulation, descriptive statistics, chi square and frequency tables has been used for
developing relevant conclusions.
Findings and analysis
Frequencies and Charts
1. What is your gender?
Frequency Percent Valid Percent Cumulative
Percent
Valid Female 14 46.7 46.7 46.7
Male 16 53.3 53.3 100.0
Total 30 100.0 100.0
Table 1: Gender
(Source: As created by author)
Document Page
5MARKETING RESEARCH
Graph 1: Gender
(Source: As created by author)
The survey shows that 53.3% of the respondents are male and remaining respondents are
female.
2. How much do you spend on products of Fonterra Co-operative Group Limited in a month?
Frequency Percent Valid Percent Cumulative
Percent
Valid $100- $200 9 30.0 30.0 30.0
$200 and above 6 20.0 20.0 50.0
$50-100 7 23.3 23.3 73.3
Less than $50 8 26.7 26.7 100.0
Document Page
6MARKETING RESEARCH
Total 30 100.0 100.0
Table 2: Expenditure
(Source: As created by author)
Graph 2: Expenditure
(Source: As created by author)
The results show that 30% of the respondents have an expenditure of between $100-200,
26% of the respondents have an expenditure of less than $50, 23.3% of the respondents have an
expenditure of $50-100 and 20% of the respondents have expenditure of more than $200.
tabler-icon-diamond-filled.svg

Paraphrase This Document

Need a fresh take? Get an instant paraphrase of this document with our AI Paraphraser
Document Page
7MARKETING RESEARCH
3. Which is the best quality dairy product in the market?
Frequency Percent Valid Percent Cumulative
Percent
Valid Fonterra Co-operative
Group Limited
10 33.3 33.3 33.3
Miraka 6 20.0 20.0 53.3
Nestle 8 26.7 26.7 80.0
Westland 6 20.0 20.0 100.0
Total 30 100.0 100.0
Table 3: Best quality dairy product
(Source: As created by author)
Document Page
8MARKETING RESEARCH
Graph 3: Best quality dairy product
(Source: As created by author)
The results show that Fonterra is still preferred by majority of the respondents but there is
not no clear majority. Fonterra is preferred by 33.3%, Nestle is preferred by 26.7%, Miraka and
Westland is preferred by 20% each. This shows that even though Fonterra is the largest producer
of dairy products, its market capitalization is comparatively less.
4. Kindly choose the best product offered by of Fonterra Co-operative Group Limited?
Frequency Percent Valid Percent Cumulative
Percent
Valid Anchor (milk, cream,
butter)
4 13.3 13.3 13.3
Anchor CalciYum
(flavoured milk, custard
yoghurt, ice cream)
3 10.0 10.0 23.3
Anchor Greek Yoghurt. 9 30.0 30.0 53.3
Anchor Uno (Kids
yoghurt)
4 13.3 13.3 66.7
Anmum. 2 6.7 6.7 73.3
Country Goodness (butter- 1 3.3 3.3 76.7
Document Page
9MARKETING RESEARCH
margarine blend spread,
cultured sour cream dips)
De Winkel (yoghurt) 3 10.0 10.0 86.7
Fresh 'n Fruity (yoghurt) 4 13.3 13.3 100.0
Total 30 100.0 100.0
Table 4: Best quality dairy product by Fonterra
(Source: As created by author)
Graph 4: Best quality dairy product by Fonterra
(Source: As created by author)
The findings show that the anchor Greek yoghurt is the most popular product of the
organization and the organization needs to push the other products.
tabler-icon-diamond-filled.svg

Paraphrase This Document

Need a fresh take? Get an instant paraphrase of this document with our AI Paraphraser
Document Page
10MARKETING RESEARCH
5. What is your frequency of purchase of Fonterra Co-operative Group Limited products in a
month?
Frequency Percent Valid Percent Cumulative
Percent
Valid More than five times 8 26.7 26.7 26.7
Once a month 6 20.0 20.0 46.7
Three to five times a
month
8 26.7 26.7 73.3
Twice a month 8 26.7 26.7 100.0
Total 30 100.0 100.0
Table 5: Frequency of purchase
(Source: As created by author)
Document Page
11MARKETING RESEARCH
Graph 5: Frequency of purchase
(Source: As created by author)
It is evident from the result that majority of the respondents’ shops for more than twice a
month. However, this does not reflect in the sales volumes of Fonterra Co-operative Group
Limited.
6. Do you agree that Fonterra Co-operative Group Limited have variety in their product line?
Frequency Percent Valid Percent Cumulative
Percent
Valid No 10 33.3 33.3 33.3
Yes 20 66.7 66.7 100.0
Total 30 100.0 100.0
Table 6: Variety in product line
(Source: As created by author)
chevron_up_icon
1 out of 47
circle_padding
hide_on_mobile
zoom_out_icon
[object Object]