Development of a Food Consumption Visualization Application

Verified

Added on  2022/10/12

|16
|2131
|52
Project
AI Summary
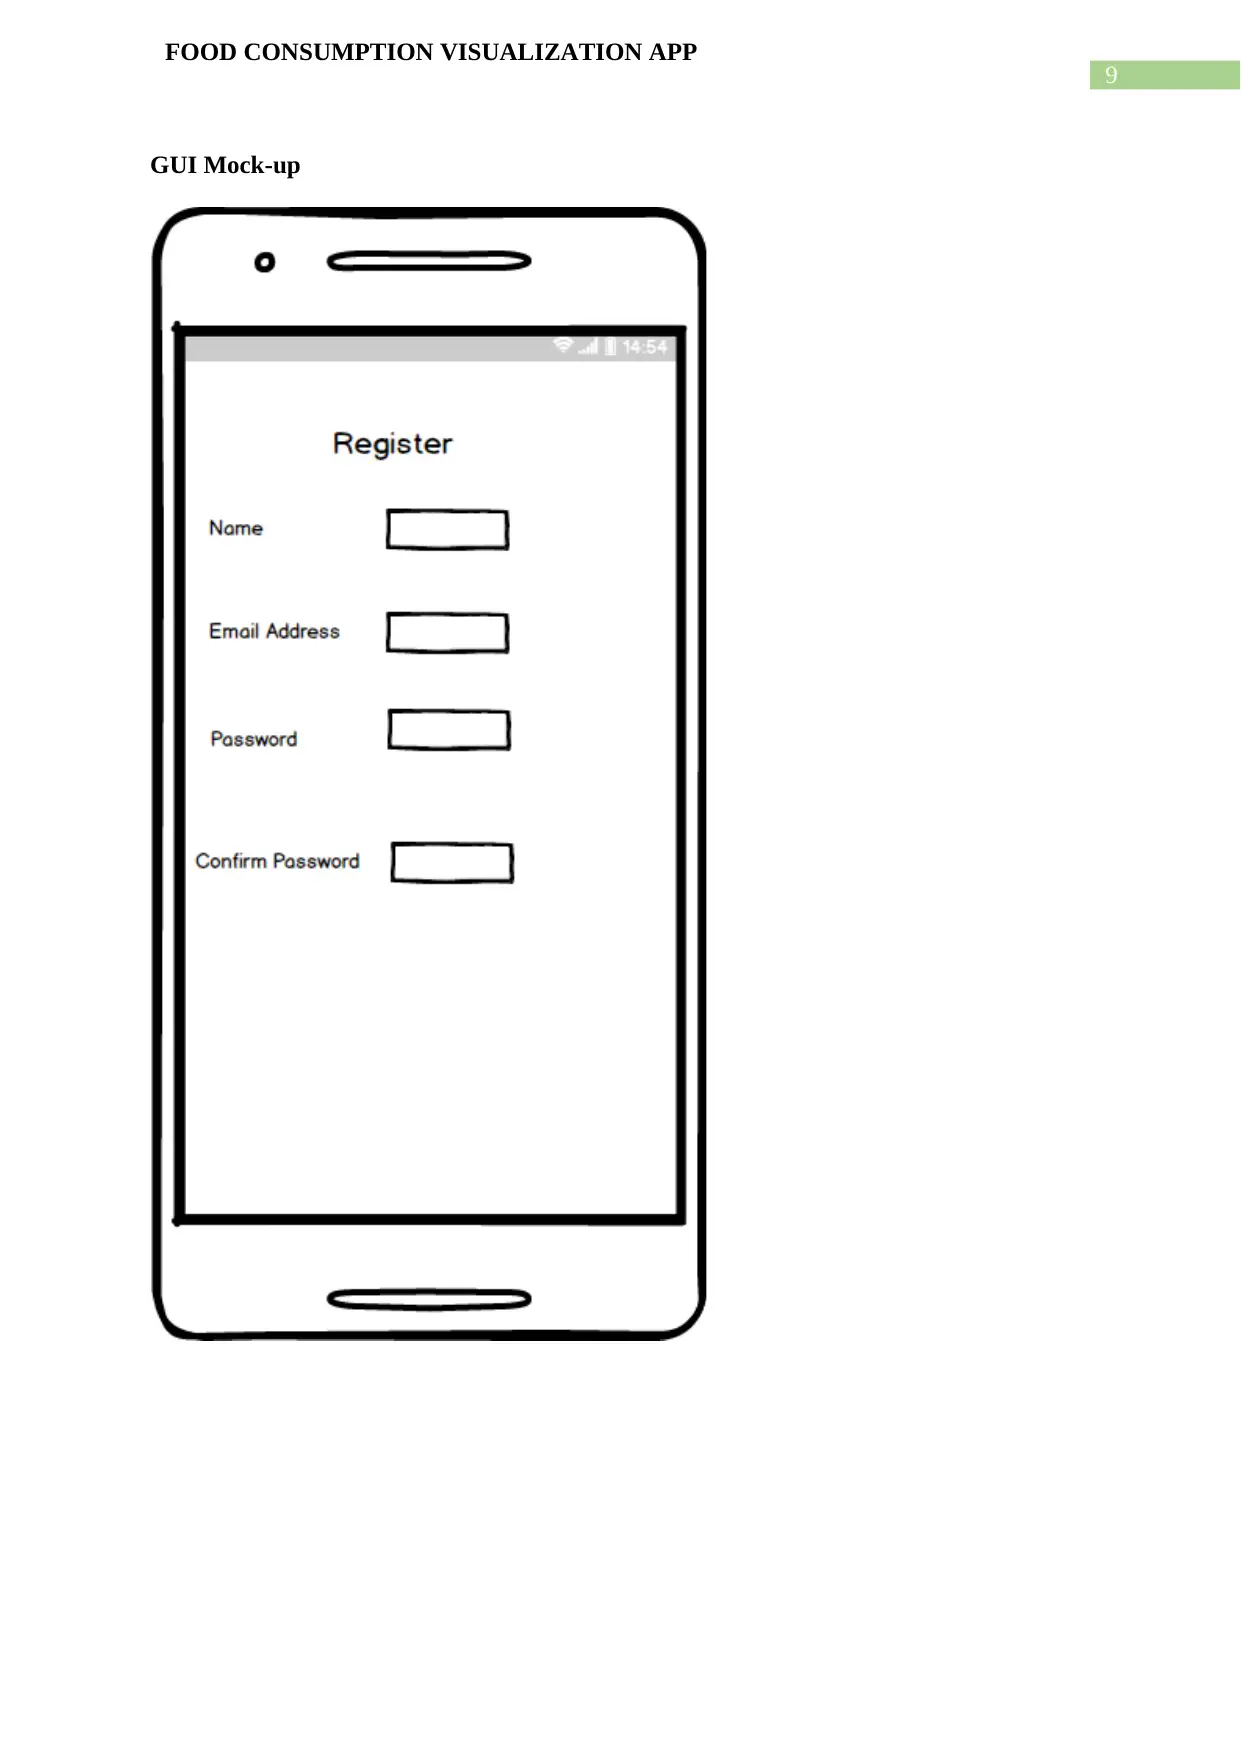
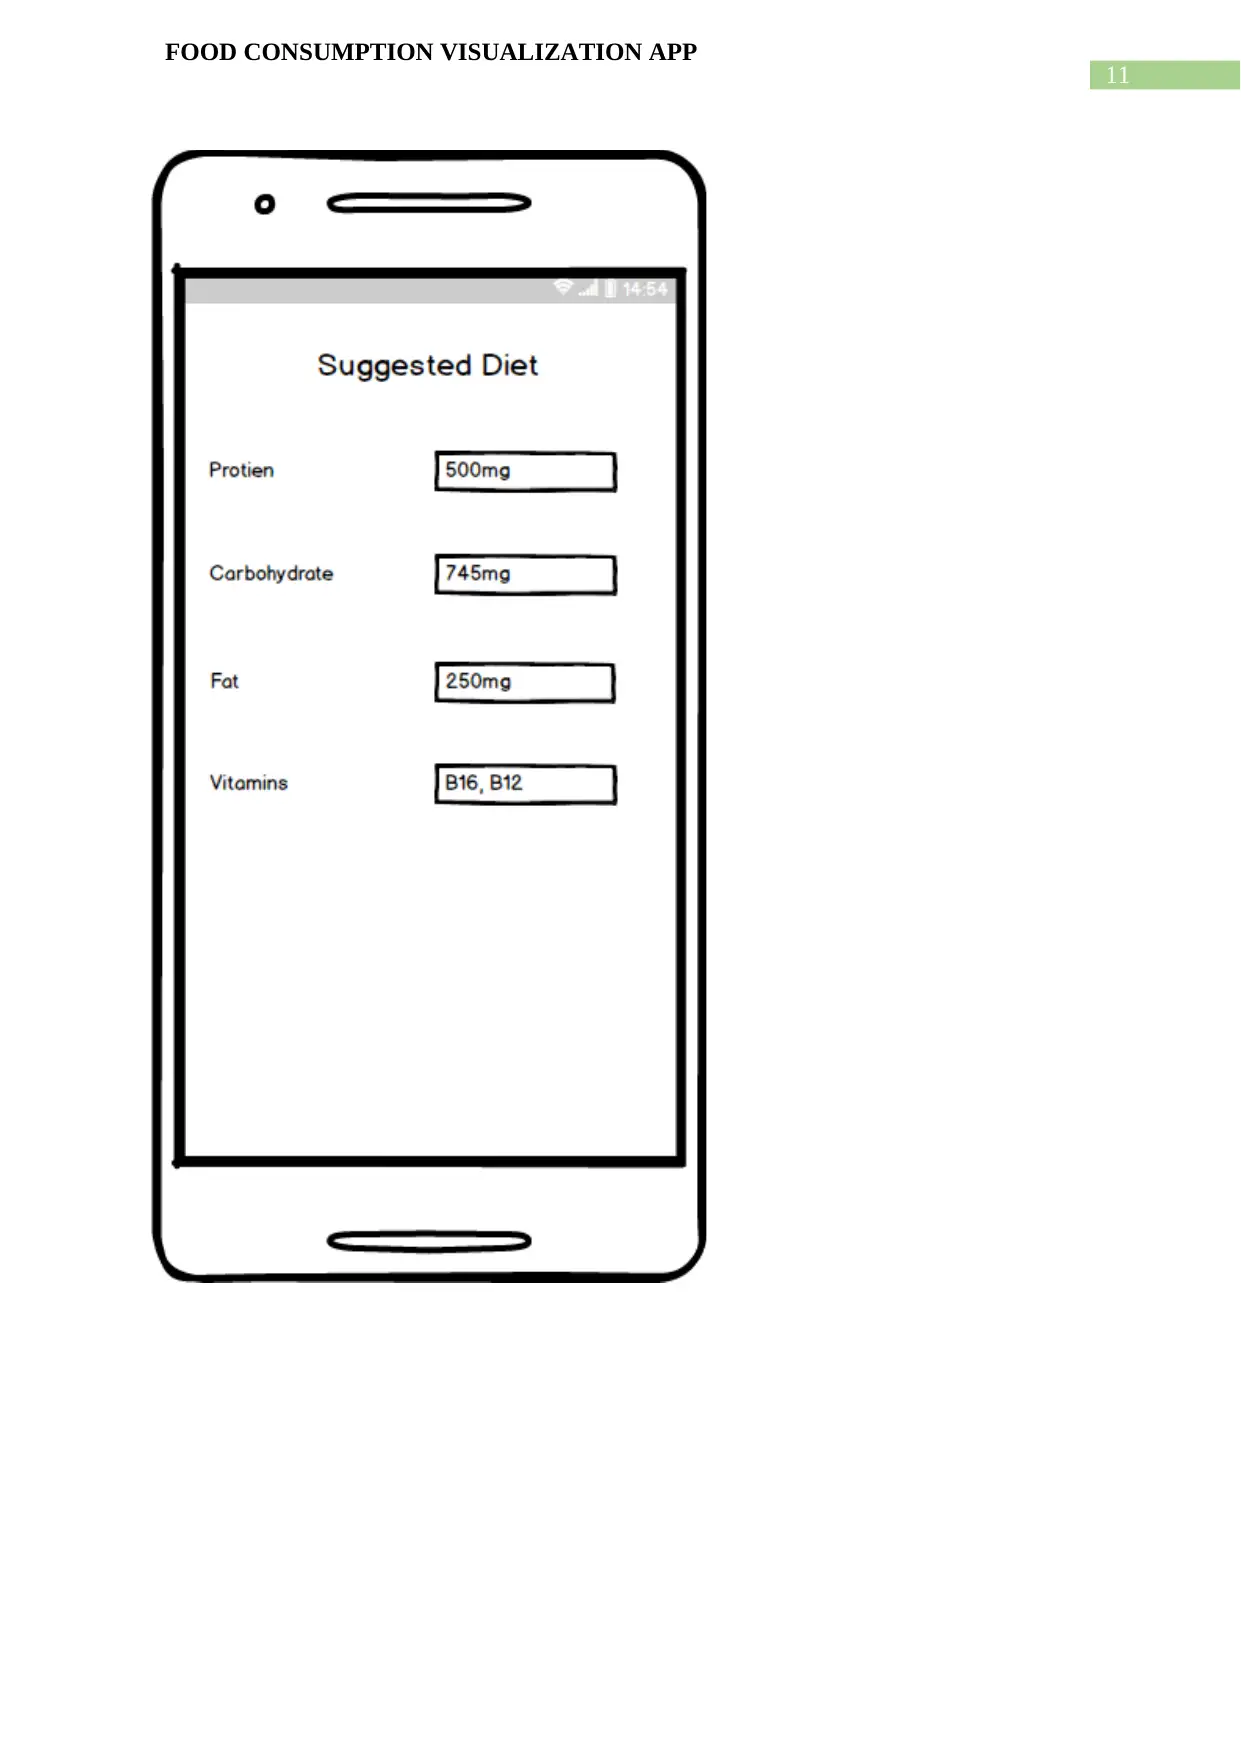
This project centers on the development of a food consumption visualization application designed to assist users in monitoring and improving their dietary habits. The application, built for mobile platforms, allows users to input personal details such as age, weight, and goals, and then provides a personalized diet chart. It tracks daily food consumption, offering guidance on food choices and quantities. The application incorporates features like a use case diagram, class diagram, architecture diagram, and GUI mock-ups to illustrate its design and functionality. It also integrates with a MySQL database and API for data storage and retrieval. The project includes an analysis of similar apps, highlighting its novelty and key features. The application's design emphasizes user-friendliness, with charts and graphs to visualize progress. The project outlines the program requirements, including device capabilities, and concludes with a discussion on the benefits of mobile health applications.
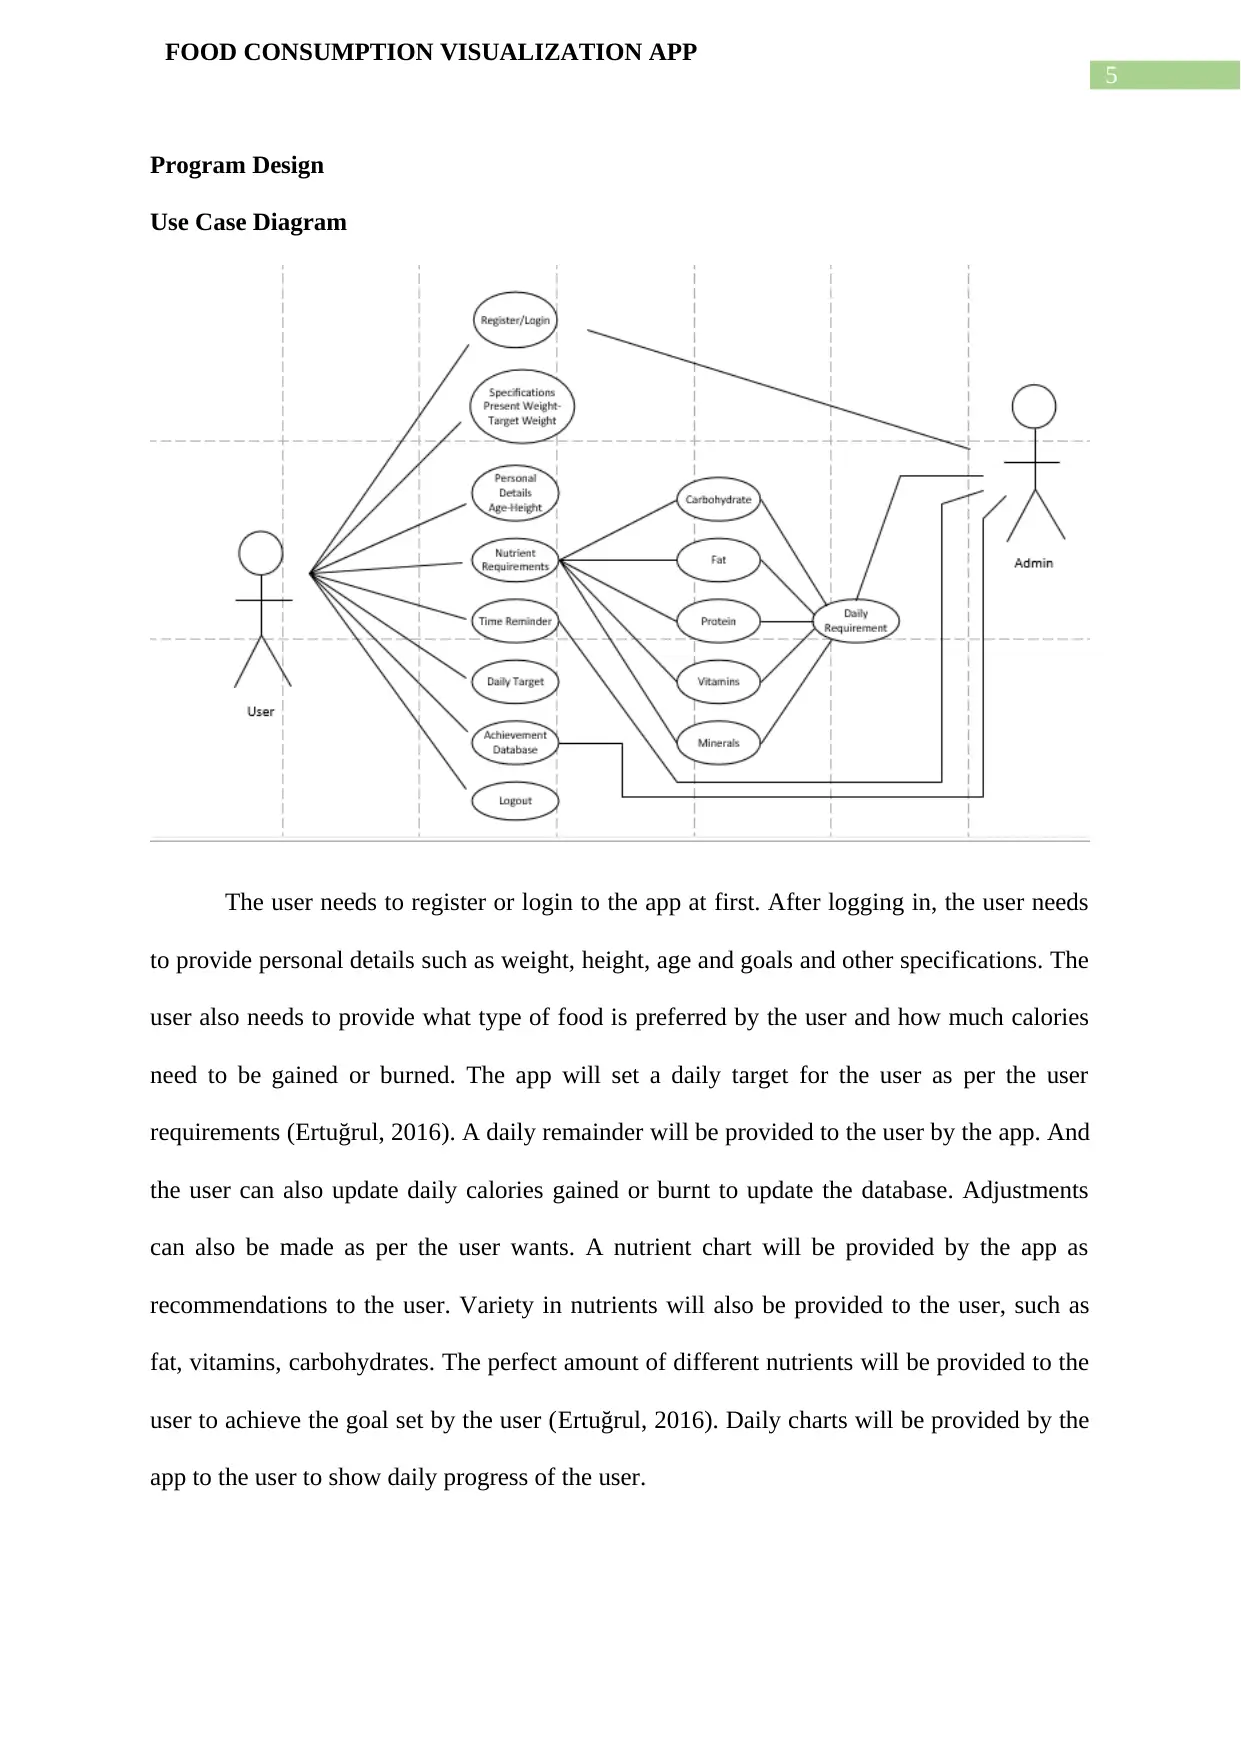
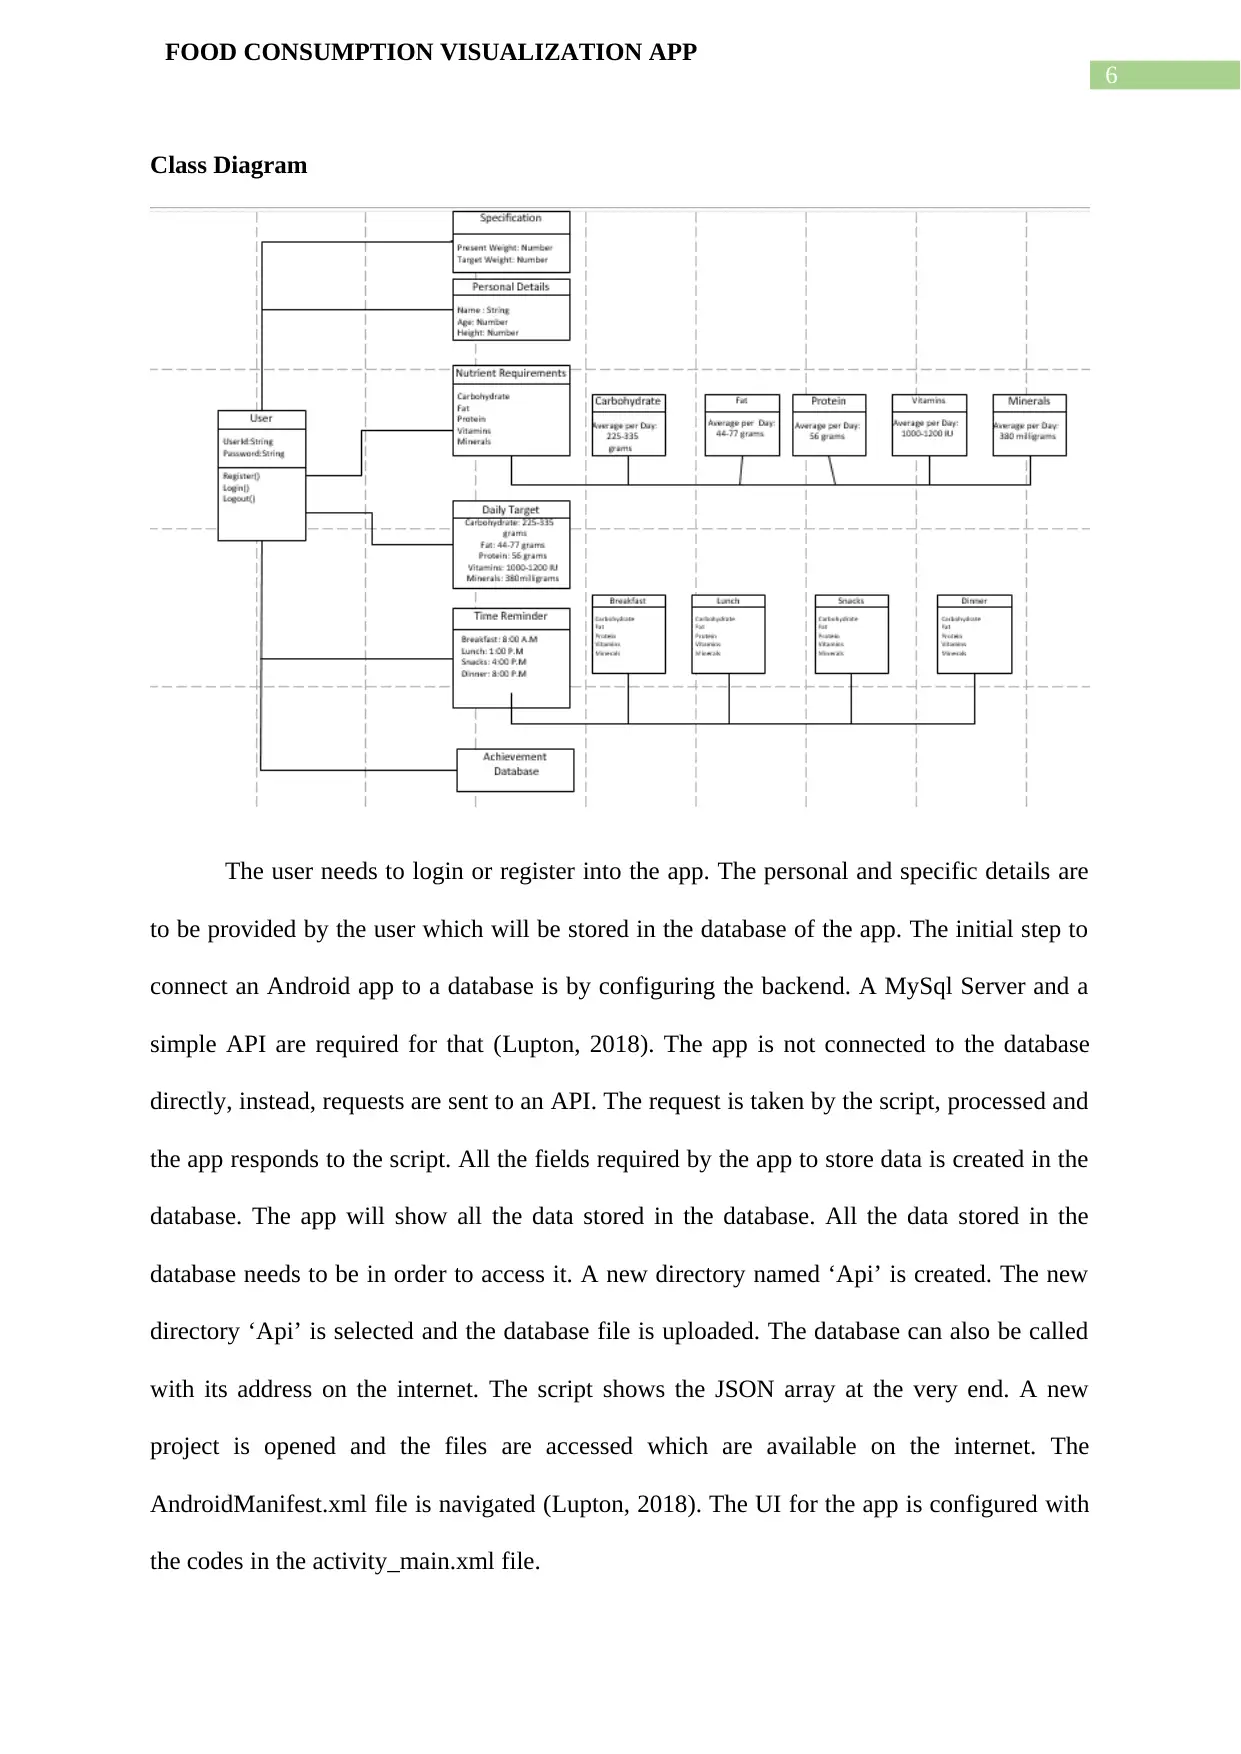
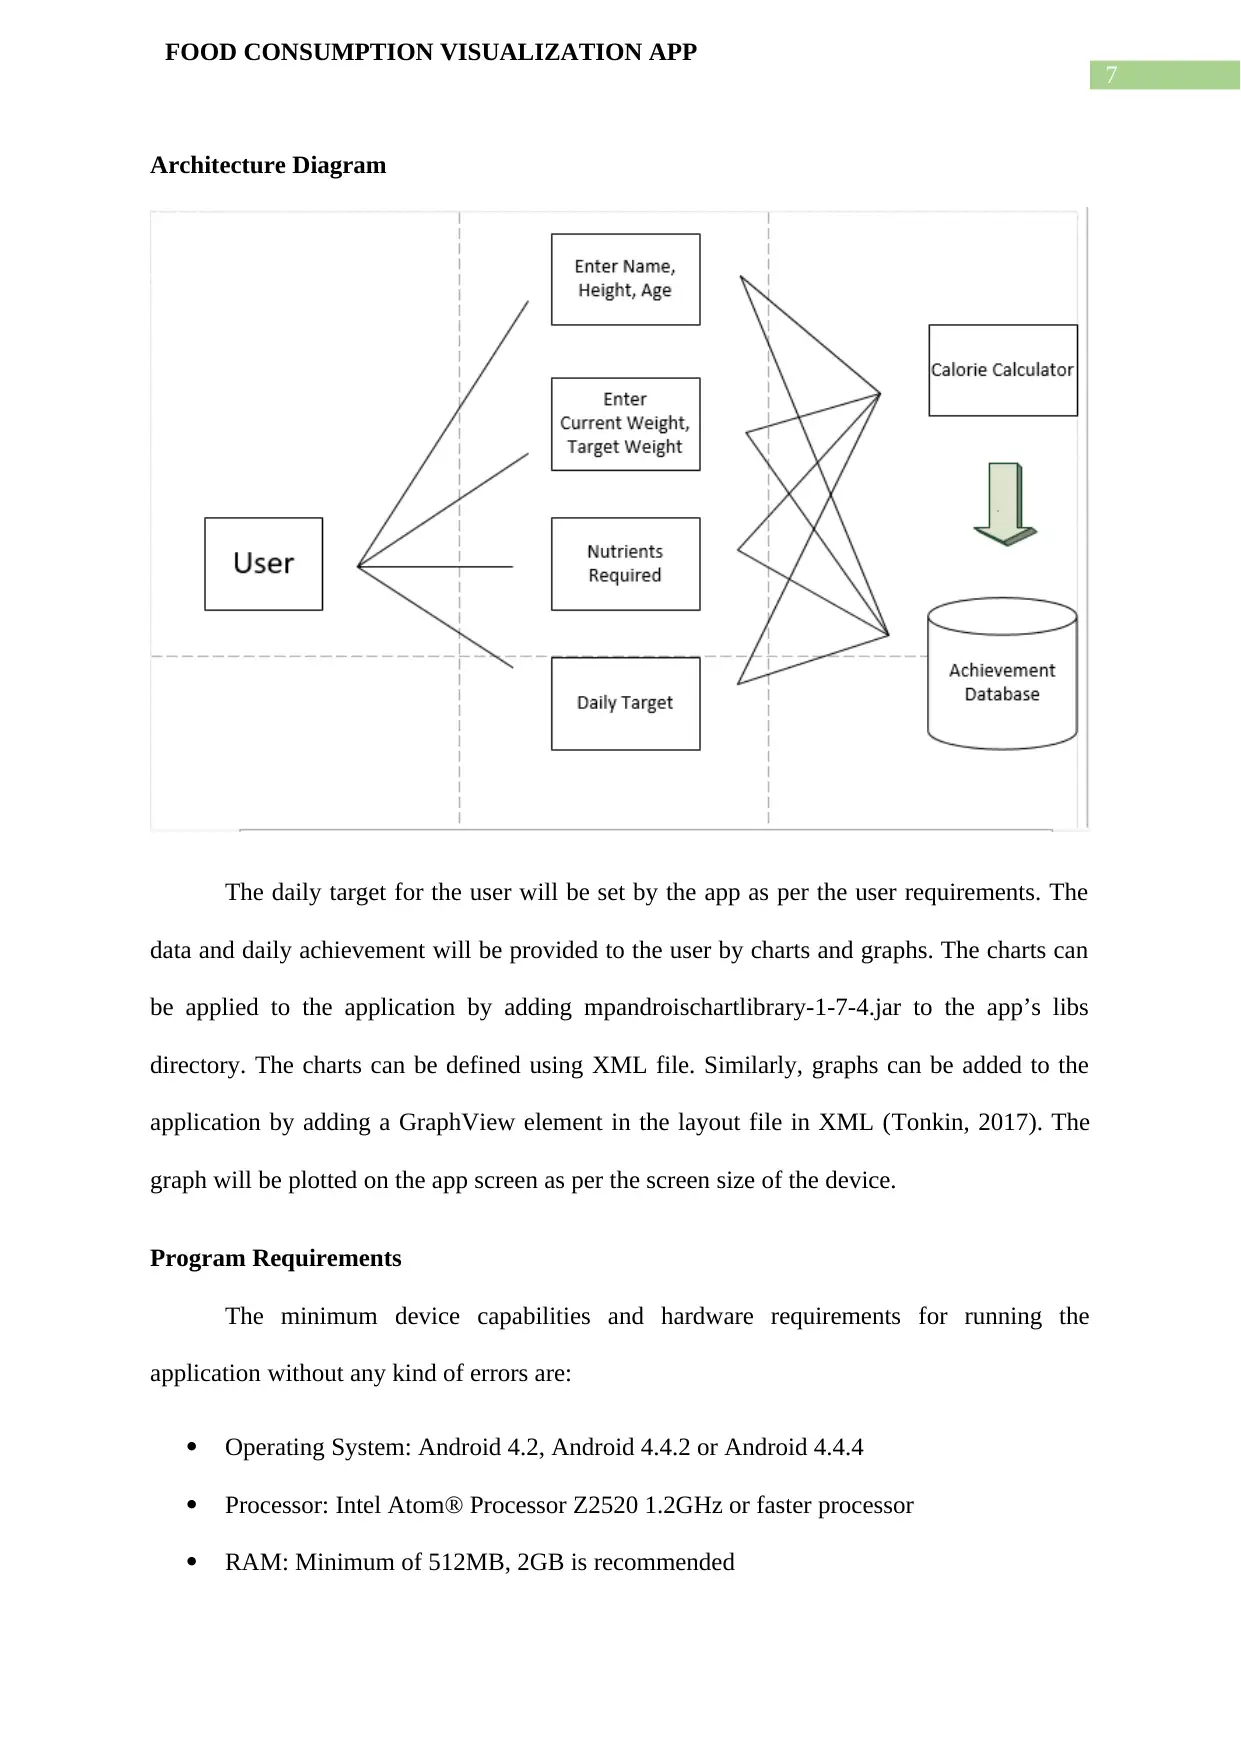
Document Page
Running Head: FOOD CONSUMPTION VISUALIZATION APP
FOOD CONSUMPTION VISUALIZATION APP
Name of the Student:
Name of the University:
Author Note:
tabler-icon-diamond-filled.svg

Paraphrase This Document

Need a fresh take? Get an instant paraphrase of this document with our AI Paraphraser
Document Page
1
FOOD CONSUMPTION VISUALIZATION APP
Executive Summary
Software related to mobile has been in business for more than a decade and the app store was
even popularized, distribution of software and mobile content was registered with the help of
portals that network operators controlled. Selling contents related to mobiles was quite
successful by operator portals. Smartphone applications are very useful tools for promotion
of public health, however unidimensional involvement have been ineffective in assisting
behavioural change. Several logical issues come up in successful development of apps for
health involvement programs. This application development helps to characterize the
technical, ethical, scientific and legal features of the data to identify the challenges and
opportunities related to the data for research in nutrition.
Document Page
2
FOOD CONSUMPTION VISUALIZATION APP
Table of Contents
Executive Summary...................................................................................................................1
Introduction................................................................................................................................2
Discussion..................................................................................................................................3
Similar Apps Analysis and Novelty.......................................................................................3
Program Design......................................................................................................................4
Use Case Diagram..............................................................................................................4
Class Diagram....................................................................................................................5
Architecture Diagram.........................................................................................................6
Program Requirements...........................................................................................................6
GUI Mock-up.........................................................................................................................7
Conclusion..................................................................................................................................7
References..................................................................................................................................8
Document Page
3
FOOD CONSUMPTION VISUALIZATION APP
Introduction
Nutrition apps represent a large area of mobile health, offering the chances of
delivering a weight management and healthy eating in a cost efficient process. Basic
knowledge about java programming, MySql is required to design the application. Knowledge
of Android Studio and XML language is also necessary. The requirement for a better
knowledge of food consumption has given the interest of nutrition researcher food
consumption data using these nutrition apps. The app that being created with prepare diet
charts and addresses the health inequalities that have centred the change in structure to the
food system. The app will help to keep track on daily food consumption. The app guides the
user to what kind of food can be consumed and in what quantity. The app also monitors the
progress made by the user. The user needs to provide some details regarding his age, weight
and can set the target goal within the app to achieve it. The user can login with the app
anytime to get a diet for his better health. All the information provided by the user is stored in
the database of the app. Visualization is also available in the app for making understand the
user about the diet chart and the progress being made by the user.
Discussion
Similar Apps Analysis and Novelty
Keeping track of food consumption and calorie intake is really important. In recent
days, counting calories is quite easy. There are several useful apps and websites which help
in logging the meals and keeps track of the intakes. All the apps and websites can be accessed
online and signing to the apps or websites takes no more than a minute. These apps are
available for android, iPad and iPhone as well. The apps available are free of cost, mostly for
android apps. MyFitnessPal is one of the most useful calorie counters (Blackburne,
Rodriguez& Johnstone, 2016). It takes the weight of the user and calculates a daily calorie
tabler-icon-diamond-filled.svg

Paraphrase This Document

Need a fresh take? Get an instant paraphrase of this document with our AI Paraphraser
Document Page
4
FOOD CONSUMPTION VISUALIZATION APP
intake. It also have a well-designed exercise log and a food diary. It also shows the remaining
intake recommended and the calories burnt by exercising. The database for MyFitnessPal’s
nutrition is quite extensive (Blackburne, Rodriguez& Johnstone, 2016). Each day is
represented through a pie chart, displaying the breakdown of protein, fat and carbohydrates.
Lose It! Is another useful health tracker which includes an easy-to-use exercise log
and food dairy. Based on height, age, weight and goals, the app provides a recommendation
of calorie intake. It then keeps track of the calories on the homepage. It has a feature of a
comprehensive database and an icon for each food entry (Blackburne, Rodriguez&
Johnstone, 2016). The weight change is provided on a graph, keeping a chat community and
keeps a weekly total.
The app being designed will also have the same features. The app will take the
weight, height, age and goals from the use and provide an appropriate diet chart for calorie
intake. The daily progress and calorie intake or burnt will be represented in a chart. The app
will have an extensive database, containing a variety of foods (Blackburne, Rodriguez&
Johnstone, 2016). The food diary of the app will be quite simple and user-friendly.
Document Page
5
FOOD CONSUMPTION VISUALIZATION APP
Program Design
Use Case Diagram
The user needs to register or login to the app at first. After logging in, the user needs
to provide personal details such as weight, height, age and goals and other specifications. The
user also needs to provide what type of food is preferred by the user and how much calories
need to be gained or burned. The app will set a daily target for the user as per the user
requirements (Ertuğrul, 2016). A daily remainder will be provided to the user by the app. And
the user can also update daily calories gained or burnt to update the database. Adjustments
can also be made as per the user wants. A nutrient chart will be provided by the app as
recommendations to the user. Variety in nutrients will also be provided to the user, such as
fat, vitamins, carbohydrates. The perfect amount of different nutrients will be provided to the
user to achieve the goal set by the user (Ertuğrul, 2016). Daily charts will be provided by the
app to the user to show daily progress of the user.
Document Page
6
FOOD CONSUMPTION VISUALIZATION APP
Class Diagram
The user needs to login or register into the app. The personal and specific details are
to be provided by the user which will be stored in the database of the app. The initial step to
connect an Android app to a database is by configuring the backend. A MySql Server and a
simple API are required for that (Lupton, 2018). The app is not connected to the database
directly, instead, requests are sent to an API. The request is taken by the script, processed and
the app responds to the script. All the fields required by the app to store data is created in the
database. The app will show all the data stored in the database. All the data stored in the
database needs to be in order to access it. A new directory named ‘Api’ is created. The new
directory ‘Api’ is selected and the database file is uploaded. The database can also be called
with its address on the internet. The script shows the JSON array at the very end. A new
project is opened and the files are accessed which are available on the internet. The
AndroidManifest.xml file is navigated (Lupton, 2018). The UI for the app is configured with
the codes in the activity_main.xml file.
tabler-icon-diamond-filled.svg

Paraphrase This Document

Need a fresh take? Get an instant paraphrase of this document with our AI Paraphraser
Document Page
7
FOOD CONSUMPTION VISUALIZATION APP
Architecture Diagram
The daily target for the user will be set by the app as per the user requirements. The
data and daily achievement will be provided to the user by charts and graphs. The charts can
be applied to the application by adding mpandroischartlibrary-1-7-4.jar to the app’s libs
directory. The charts can be defined using XML file. Similarly, graphs can be added to the
application by adding a GraphView element in the layout file in XML (Tonkin, 2017). The
graph will be plotted on the app screen as per the screen size of the device.
Program Requirements
The minimum device capabilities and hardware requirements for running the
application without any kind of errors are:
Operating System: Android 4.2, Android 4.4.2 or Android 4.4.4
Processor: Intel Atom® Processor Z2520 1.2GHz or faster processor
RAM: Minimum of 512MB, 2GB is recommended
Document Page
8
FOOD CONSUMPTION VISUALIZATION APP
Storage: Between 850MB and 1GB
API Level: Android support v4
Device Capabilities: App manifest ( uses-feature )
Screen Size: Must be at least 2.5 inches in diagonal size. Density must be at least 100
dpi. The aspect ratio must be 1.333 (4:3) and 1.779 (16:9)
Input Capabilities: Touch screen feature will be available for the app.
The app will require internet connection to operate.
Document Page
9
FOOD CONSUMPTION VISUALIZATION APP
GUI Mock-up
tabler-icon-diamond-filled.svg

Paraphrase This Document

Need a fresh take? Get an instant paraphrase of this document with our AI Paraphraser
Document Page
10
FOOD CONSUMPTION VISUALIZATION APP
Document Page
11
FOOD CONSUMPTION VISUALIZATION APP
chevron_up_icon
1 out of 16
circle_padding
hide_on_mobile
zoom_out_icon
[object Object]