Business Decision Making Report: Strategies for Food for Friend
VerifiedAdded on 2020/06/06
|19
|4726
|224
Report
AI Summary
This report provides a comprehensive analysis of business decision-making strategies for the Food for Friend restaurant. It begins with an introduction to the importance of decision-making in business, followed by an overview of data collection methods, including primary and secondary sources. The report details the procedures used to gather information, such as interviews, surveys, and questionnaires. The analysis section summarizes the findings from a questionnaire administered to customers, providing insights into their preferences and satisfaction levels. The report then presents financial data, including sales and profit figures, and analyzes them using statistical tools such as mean, median, mode, and standard deviation. The findings are used to derive strategic recommendations for improving the restaurant's performance and enhancing customer satisfaction, including suggestions for menu diversification and service improvements. The report concludes with a discussion of the key findings and their implications for the restaurant's future.

BUSINESS DECISION
MAKING
MAKING
Paraphrase This Document
Need a fresh take? Get an instant paraphrase of this document with our AI Paraphraser
Table of Contents
INTRODUCTION...........................................................................................................................1
TASK 1............................................................................................................................................1
1.1 ..........................................................................................................................................1
1.2 ..........................................................................................................................................2
1.3 ..........................................................................................................................................2
2.1 ..........................................................................................................................................4
2.2 ..........................................................................................................................................6
2.3...........................................................................................................................................7
2.4 ..........................................................................................................................................8
TASK 2............................................................................................................................................9
3.1 ..........................................................................................................................................9
3.2 ........................................................................................................................................11
3.3 Covered in PPT...............................................................................................................12
3.4 ........................................................................................................................................12
TASK3...........................................................................................................................................13
4.1 ........................................................................................................................................13
4.2.........................................................................................................................................14
4.2 ........................................................................................................................................15
CONCLUSION..............................................................................................................................15
REFERENCES..............................................................................................................................16
INTRODUCTION
In every business, decision making is one of the most important aspects that should be
taken into considerations in order to make business successful. Decision making help to create a
complete pictures of a company (Ariely and Berns, 2010). Different methods of data collection is
required to make appropriate decision regarding establishment of company in long run. It help to
take various decision about Food for Friend restaurant in order to achieve the target set by
company. The report consist of various sources of data collection and appropriate methods that
are used in restaurant. On that basis different decision have made in order to provide valuable
information about the strategies and decision making techniques that they should adopt by Food
for friend restaurant. It also includes a well planned report that contains findings from research
work. In last a network digram is presented on the basis of assumption and financial tools that
are helpful in decision making for restaurant.
TASK 1
1.1
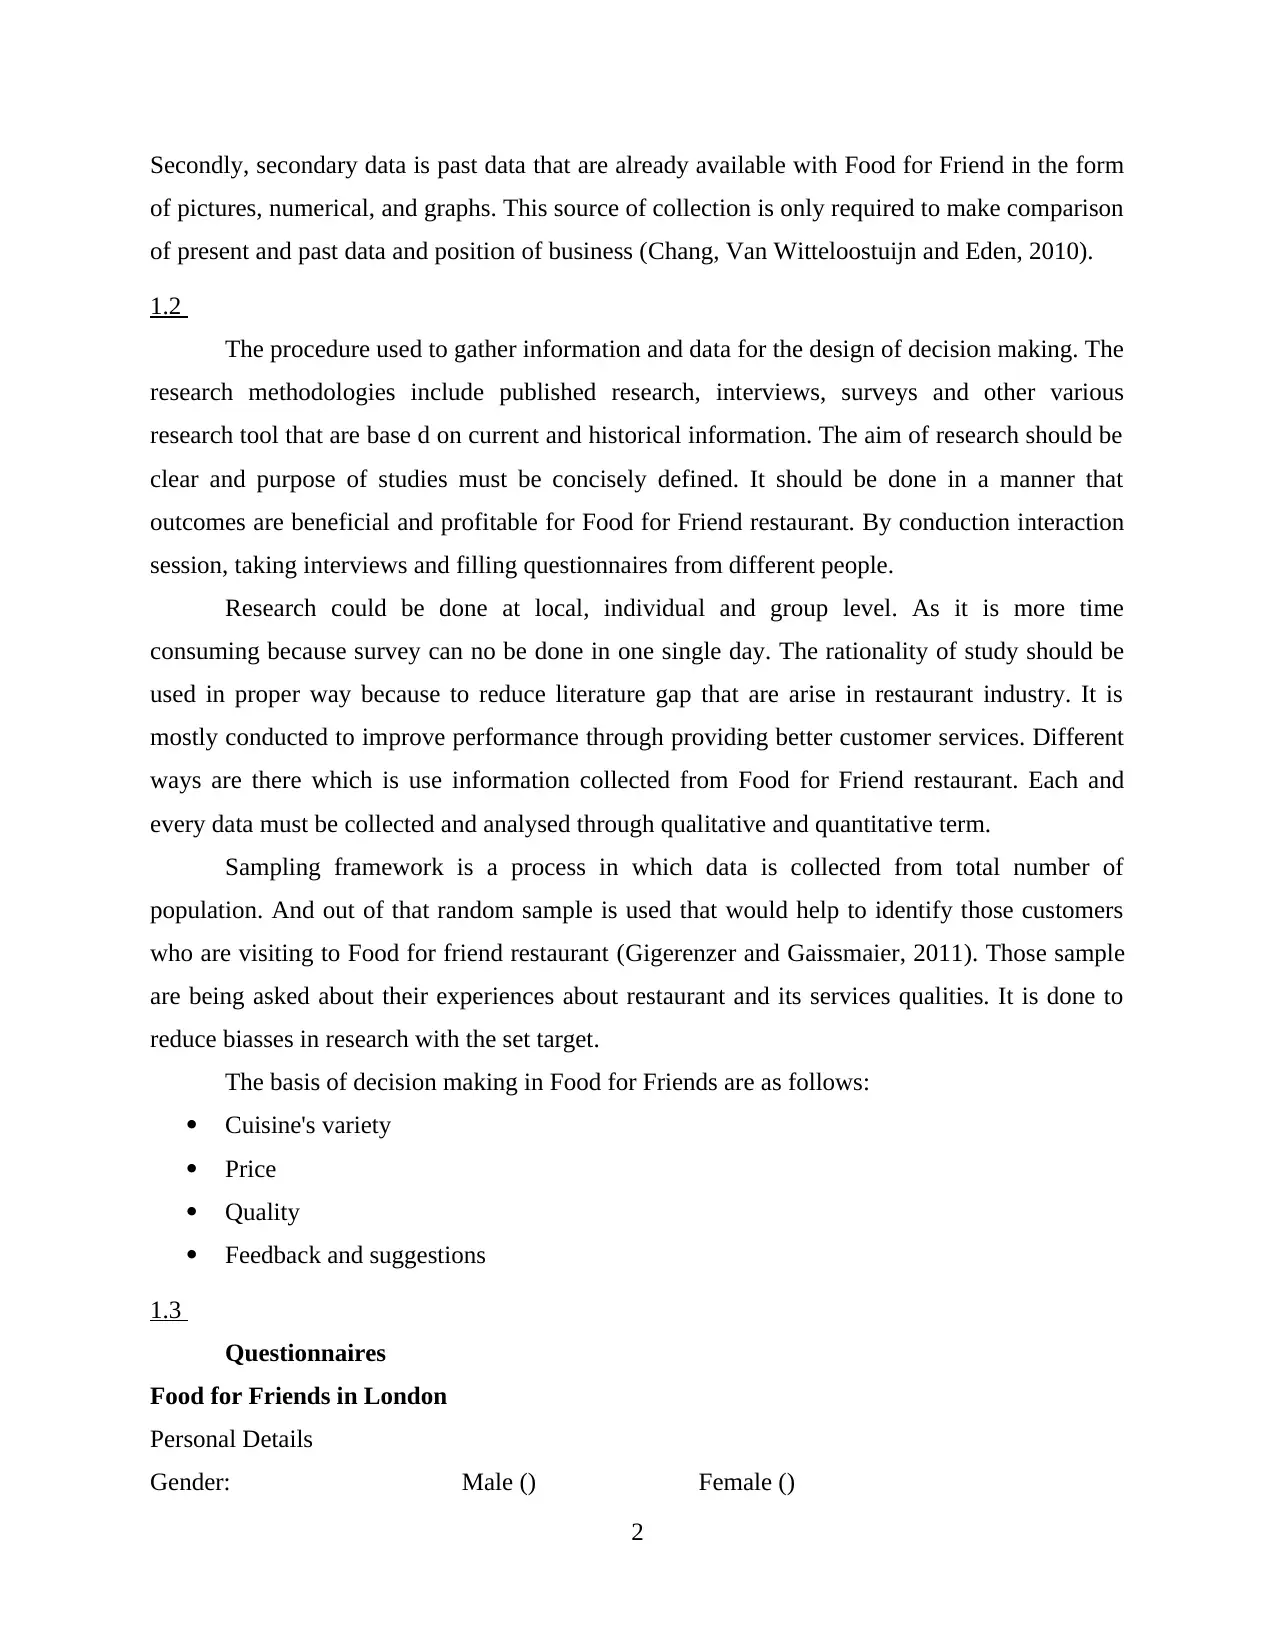
A Plan is a kind of detailed proposal for performing a task or activity and decision about
what person is going to do. So there are various sources that are available to Food for Friend
restaurant which can be used in their daily course of business. For the collection of data mainly
there are two sources primary and secondary which is based on various aspects of market
situation and customer demand. The data collection is a huge task for researcher because
responded are not truly confident in providing information in appropriate way.
Data collection plan:
It is techniques that can be used in searching or analysing information of different
variables that create interest in formulating people thinking ability. A research have many option
that will be use like asking questions, testing hypotheses and review the final results out of
survey process (Casadesus-Masanell and Ricart, 2011). Mode of collection can be interviews,
phone calls, direct observations and others. For this primary and secondary source are used.
Firstly primary data is much more helpful because it is collected for first time from respondents
and it provide chance to correct the mistakes and quickly resolved by using proper methods and
tool. It includes questionnaire, interviews and personal observation.
1
In every business, decision making is one of the most important aspects that should be
taken into considerations in order to make business successful. Decision making help to create a
complete pictures of a company (Ariely and Berns, 2010). Different methods of data collection is
required to make appropriate decision regarding establishment of company in long run. It help to
take various decision about Food for Friend restaurant in order to achieve the target set by
company. The report consist of various sources of data collection and appropriate methods that
are used in restaurant. On that basis different decision have made in order to provide valuable
information about the strategies and decision making techniques that they should adopt by Food
for friend restaurant. It also includes a well planned report that contains findings from research
work. In last a network digram is presented on the basis of assumption and financial tools that
are helpful in decision making for restaurant.
TASK 1
1.1
A Plan is a kind of detailed proposal for performing a task or activity and decision about
what person is going to do. So there are various sources that are available to Food for Friend
restaurant which can be used in their daily course of business. For the collection of data mainly
there are two sources primary and secondary which is based on various aspects of market
situation and customer demand. The data collection is a huge task for researcher because
responded are not truly confident in providing information in appropriate way.
Data collection plan:
It is techniques that can be used in searching or analysing information of different
variables that create interest in formulating people thinking ability. A research have many option
that will be use like asking questions, testing hypotheses and review the final results out of
survey process (Casadesus-Masanell and Ricart, 2011). Mode of collection can be interviews,
phone calls, direct observations and others. For this primary and secondary source are used.
Firstly primary data is much more helpful because it is collected for first time from respondents
and it provide chance to correct the mistakes and quickly resolved by using proper methods and
tool. It includes questionnaire, interviews and personal observation.
1
⊘ This is a preview!⊘
Do you want full access?
Subscribe today to unlock all pages.
Trusted by 1+ million students worldwide
Secondly, secondary data is past data that are already available with Food for Friend in the form
of pictures, numerical, and graphs. This source of collection is only required to make comparison
of present and past data and position of business (Chang, Van Witteloostuijn and Eden, 2010).
1.2
The procedure used to gather information and data for the design of decision making. The
research methodologies include published research, interviews, surveys and other various
research tool that are base d on current and historical information. The aim of research should be
clear and purpose of studies must be concisely defined. It should be done in a manner that
outcomes are beneficial and profitable for Food for Friend restaurant. By conduction interaction
session, taking interviews and filling questionnaires from different people.
Research could be done at local, individual and group level. As it is more time
consuming because survey can no be done in one single day. The rationality of study should be
used in proper way because to reduce literature gap that are arise in restaurant industry. It is
mostly conducted to improve performance through providing better customer services. Different
ways are there which is use information collected from Food for Friend restaurant. Each and
every data must be collected and analysed through qualitative and quantitative term.
Sampling framework is a process in which data is collected from total number of
population. And out of that random sample is used that would help to identify those customers
who are visiting to Food for friend restaurant (Gigerenzer and Gaissmaier, 2011). Those sample
are being asked about their experiences about restaurant and its services qualities. It is done to
reduce biasses in research with the set target.
The basis of decision making in Food for Friends are as follows:
Cuisine's variety
Price
Quality
Feedback and suggestions
1.3
Questionnaires
Food for Friends in London
Personal Details
Gender: Male () Female ()
2
Paraphrase This Document
Need a fresh take? Get an instant paraphrase of this document with our AI Paraphraser
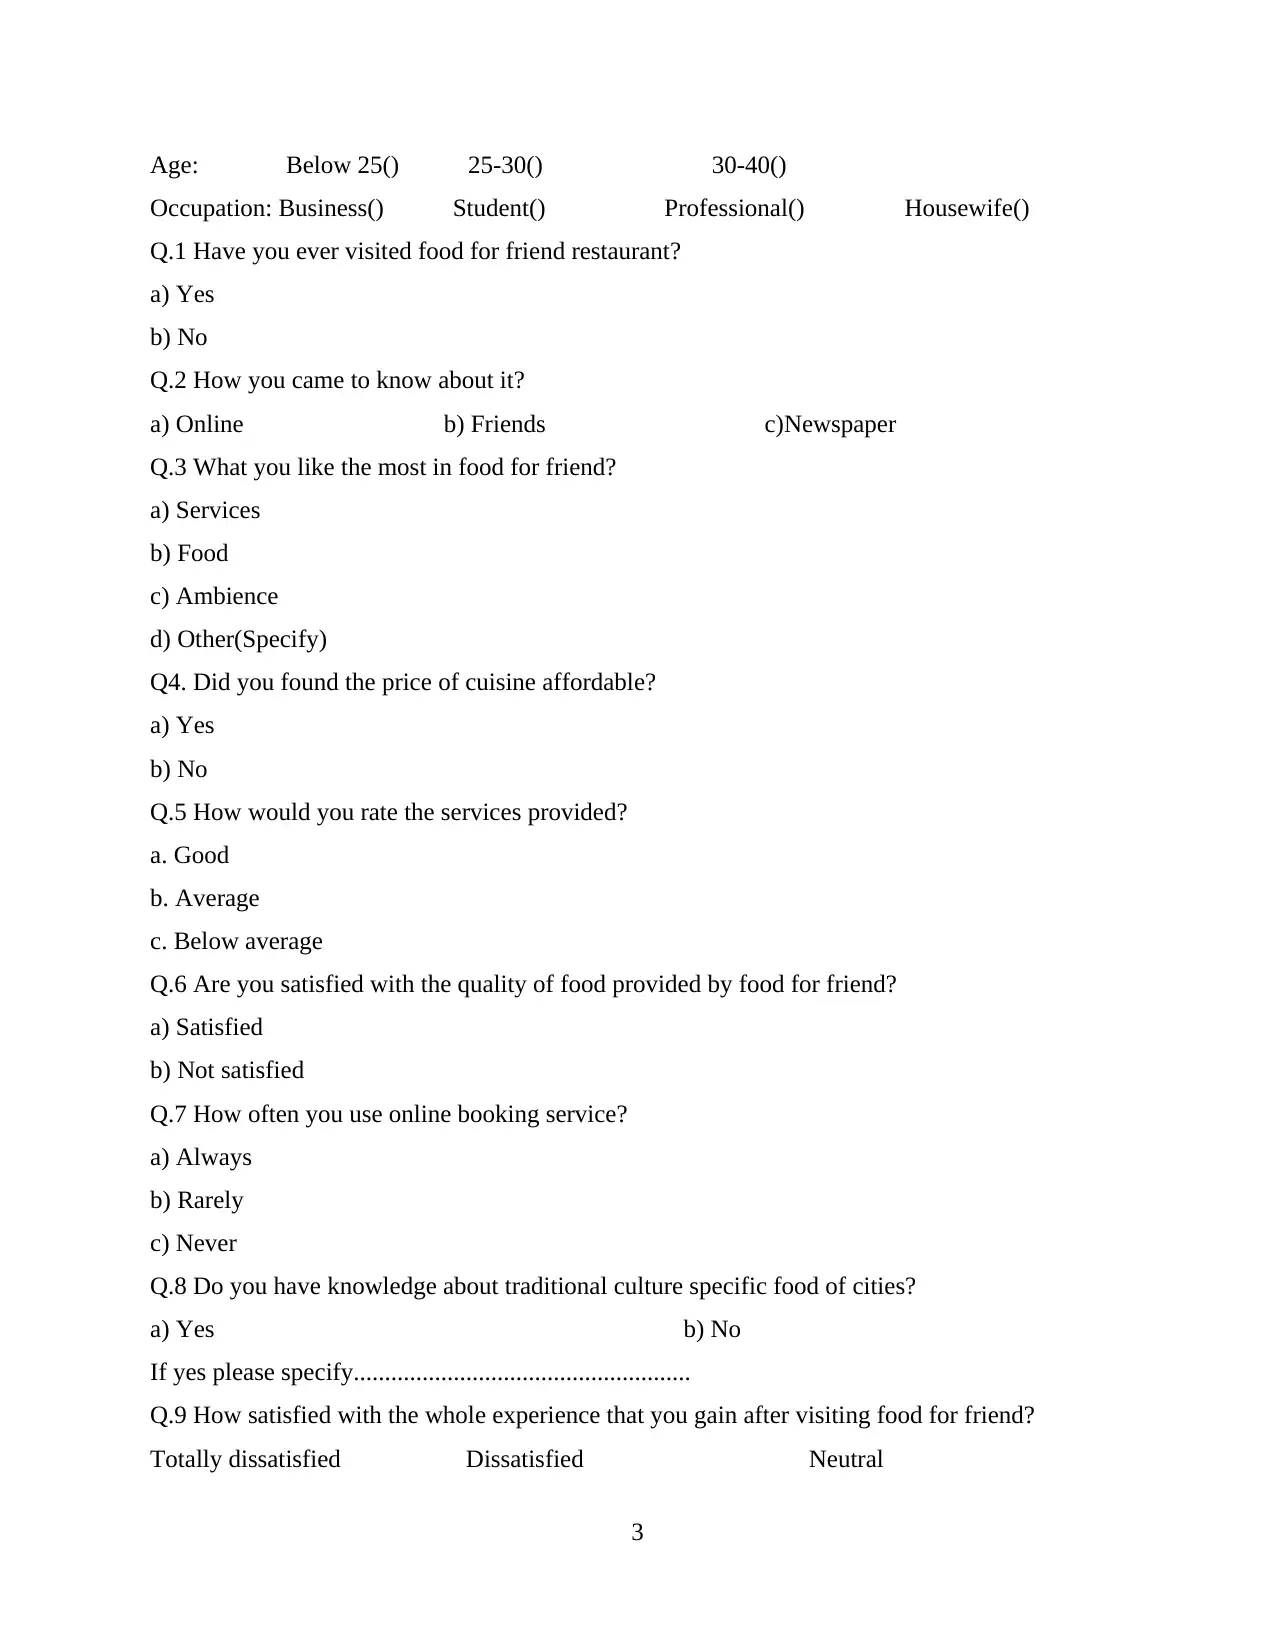
Age: Below 25() 25-30() 30-40()
Occupation: Business() Student() Professional() Housewife()
Q.1 Have you ever visited food for friend restaurant?
a) Yes
b) No
Q.2 How you came to know about it?
a) Online b) Friends c)Newspaper
Q.3 What you like the most in food for friend?
a) Services
b) Food
c) Ambience
d) Other(Specify)
Q4. Did you found the price of cuisine affordable?
a) Yes
b) No
Q.5 How would you rate the services provided?
a. Good
b. Average
c. Below average
Q.6 Are you satisfied with the quality of food provided by food for friend?
a) Satisfied
b) Not satisfied
Q.7 How often you use online booking service?
a) Always
b) Rarely
c) Never
Q.8 Do you have knowledge about traditional culture specific food of cities?
a) Yes b) No
If yes please specify......................................................
Q.9 How satisfied with the whole experience that you gain after visiting food for friend?
Totally dissatisfied Dissatisfied Neutral
3
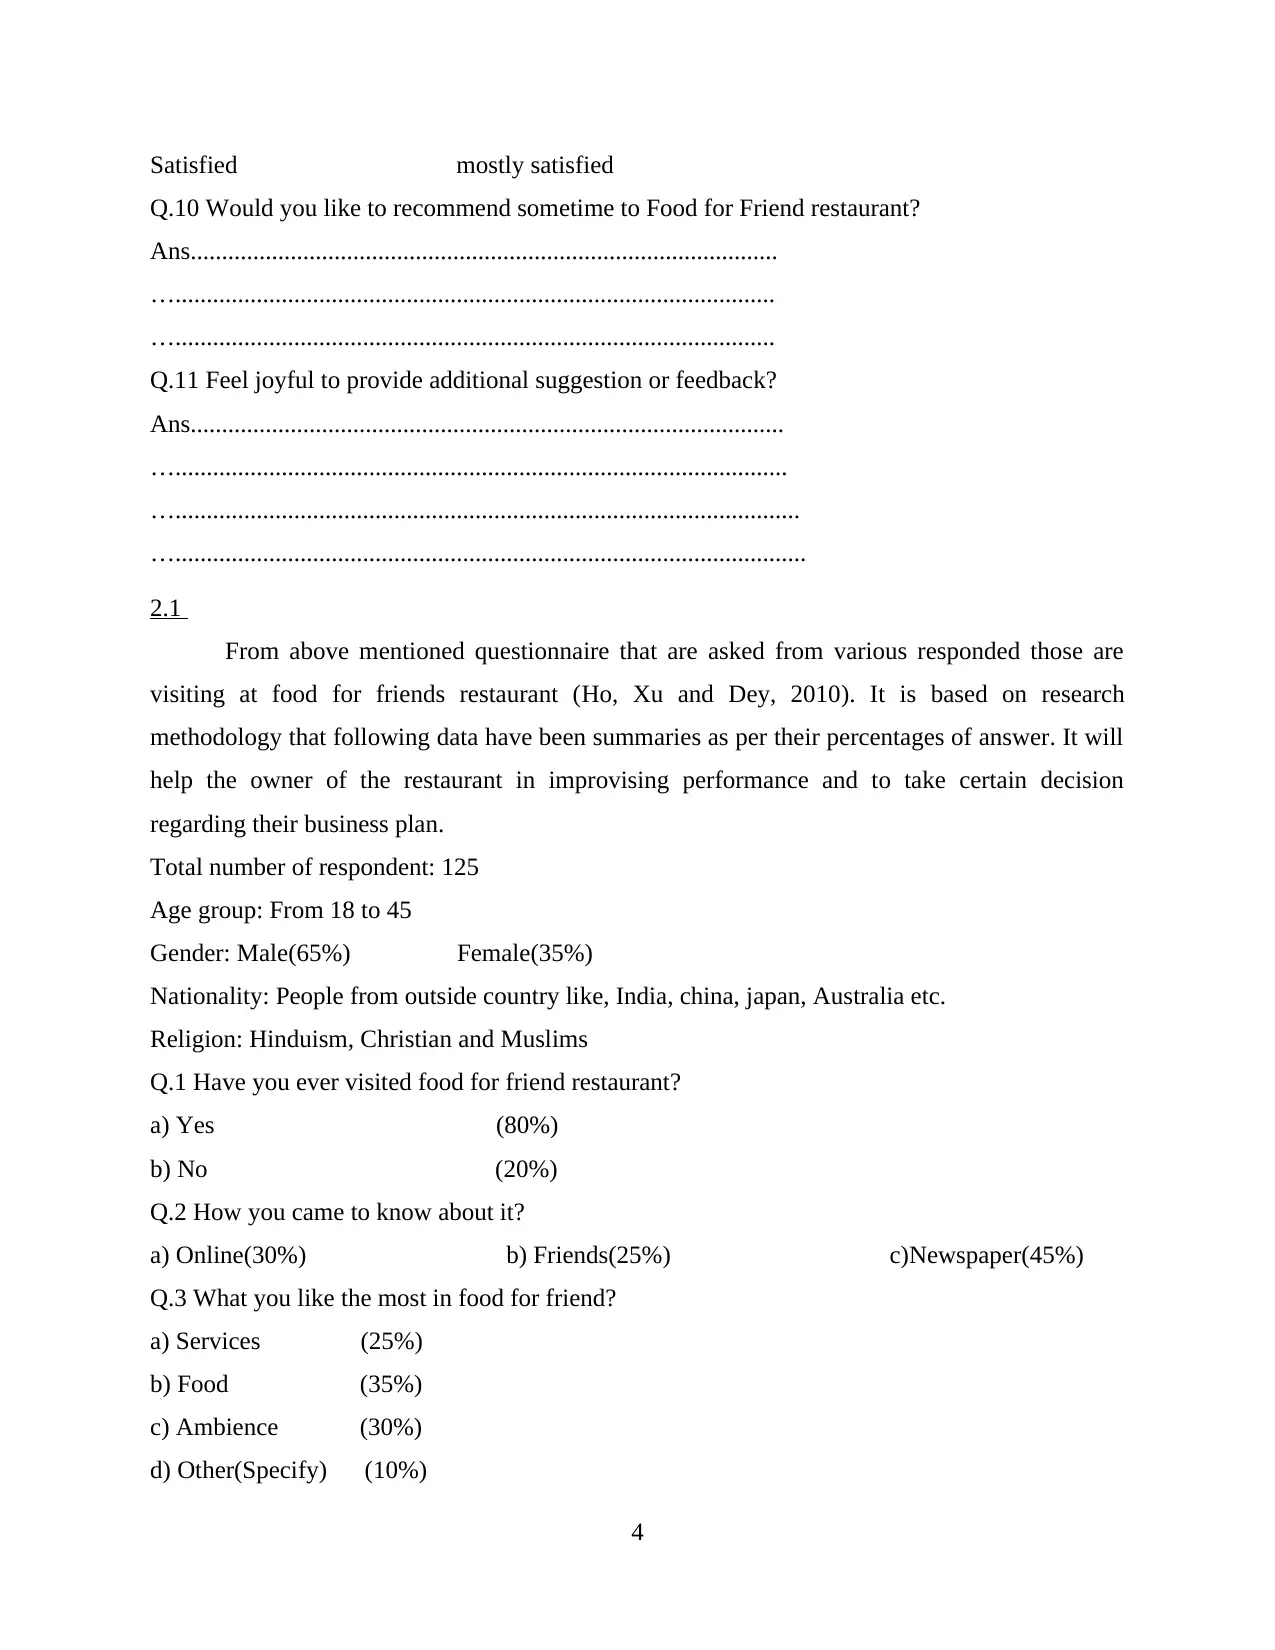
Satisfied mostly satisfied
Q.10 Would you like to recommend sometime to Food for Friend restaurant?
Ans..............................................................................................
…................................................................................................
…................................................................................................
Q.11 Feel joyful to provide additional suggestion or feedback?
Ans...............................................................................................
…..................................................................................................
…....................................................................................................
….....................................................................................................
2.1
From above mentioned questionnaire that are asked from various responded those are
visiting at food for friends restaurant (Ho, Xu and Dey, 2010). It is based on research
methodology that following data have been summaries as per their percentages of answer. It will
help the owner of the restaurant in improvising performance and to take certain decision
regarding their business plan.
Total number of respondent: 125
Age group: From 18 to 45
Gender: Male(65%) Female(35%)
Nationality: People from outside country like, India, china, japan, Australia etc.
Religion: Hinduism, Christian and Muslims
Q.1 Have you ever visited food for friend restaurant?
a) Yes (80%)
b) No (20%)
Q.2 How you came to know about it?
a) Online(30%) b) Friends(25%) c)Newspaper(45%)
Q.3 What you like the most in food for friend?
a) Services (25%)
b) Food (35%)
c) Ambience (30%)
d) Other(Specify) (10%)
4
⊘ This is a preview!⊘
Do you want full access?
Subscribe today to unlock all pages.
Trusted by 1+ million students worldwide
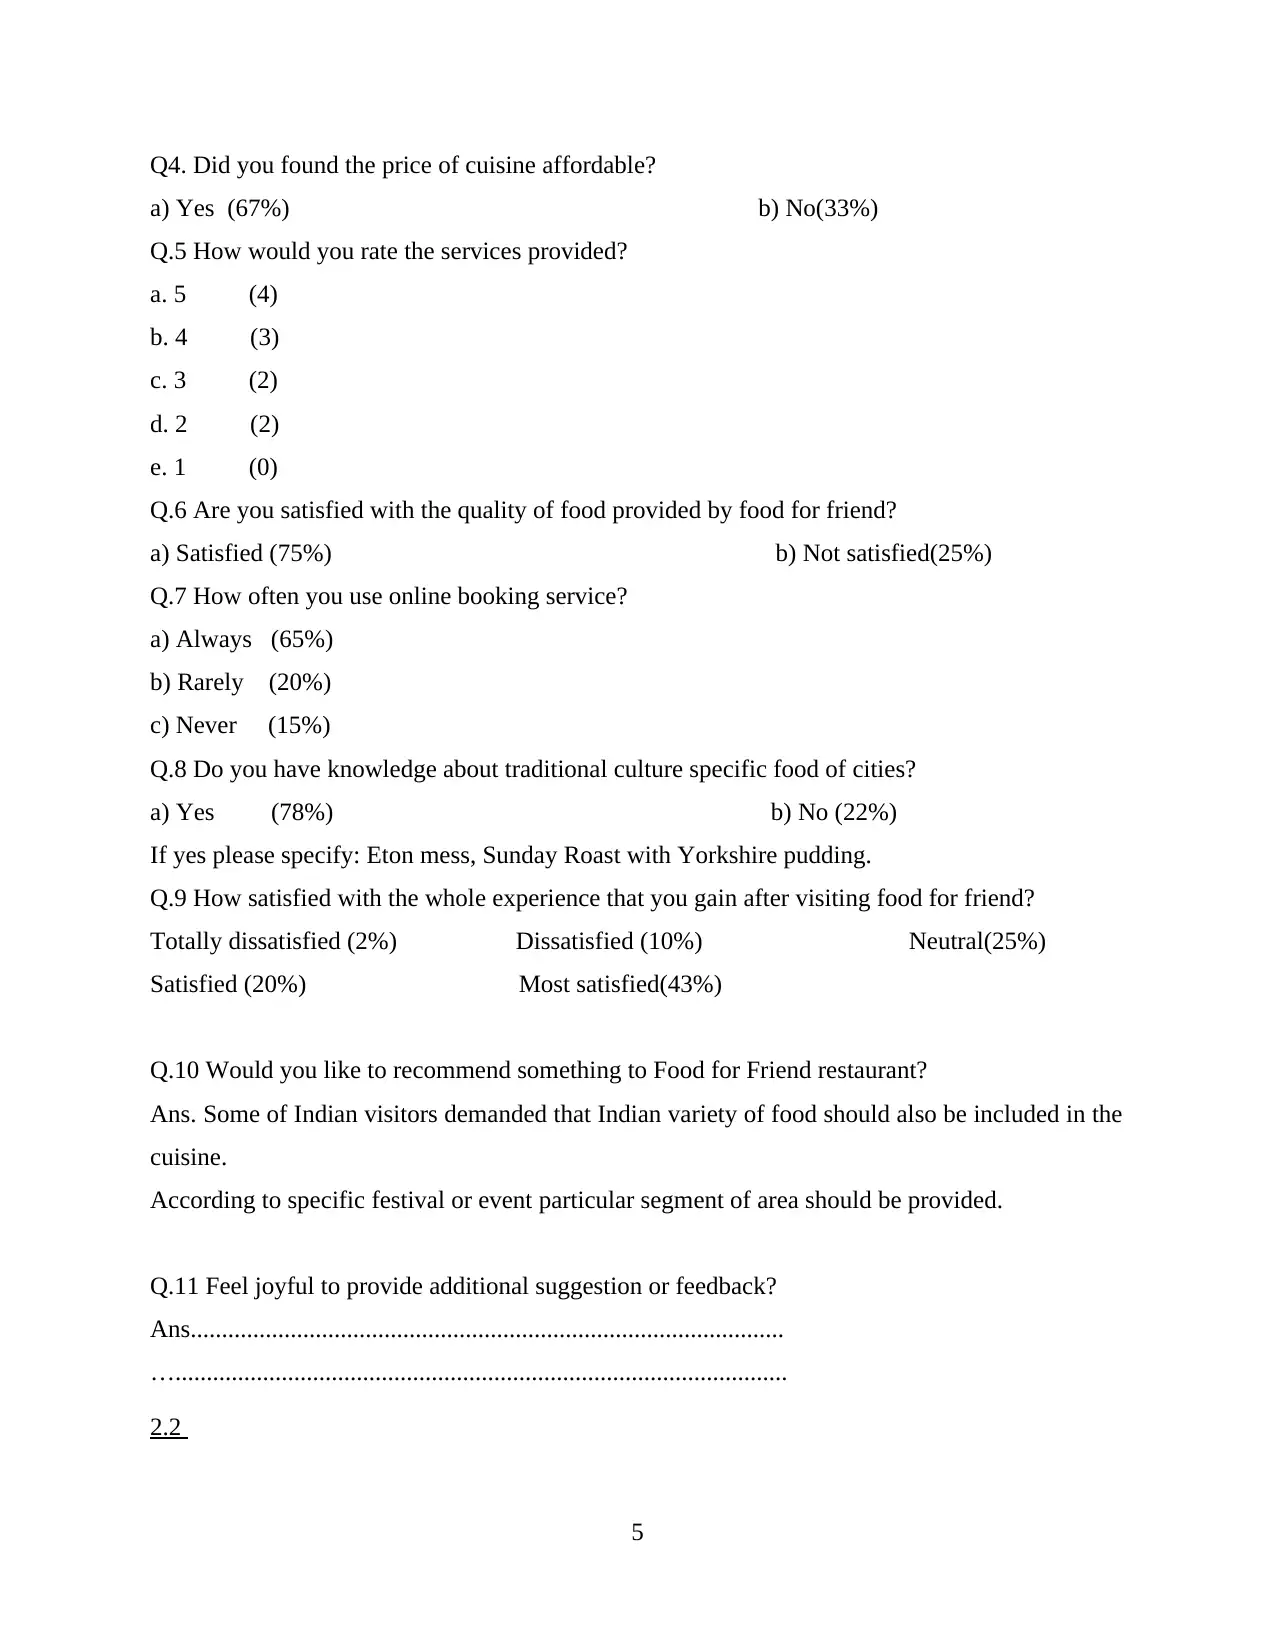
Q4. Did you found the price of cuisine affordable?
a) Yes (67%) b) No(33%)
Q.5 How would you rate the services provided?
a. 5 (4)
b. 4 (3)
c. 3 (2)
d. 2 (2)
e. 1 (0)
Q.6 Are you satisfied with the quality of food provided by food for friend?
a) Satisfied (75%) b) Not satisfied(25%)
Q.7 How often you use online booking service?
a) Always (65%)
b) Rarely (20%)
c) Never (15%)
Q.8 Do you have knowledge about traditional culture specific food of cities?
a) Yes (78%) b) No (22%)
If yes please specify: Eton mess, Sunday Roast with Yorkshire pudding.
Q.9 How satisfied with the whole experience that you gain after visiting food for friend?
Totally dissatisfied (2%) Dissatisfied (10%) Neutral(25%)
Satisfied (20%) Most satisfied(43%)
Q.10 Would you like to recommend something to Food for Friend restaurant?
Ans. Some of Indian visitors demanded that Indian variety of food should also be included in the
cuisine.
According to specific festival or event particular segment of area should be provided.
Q.11 Feel joyful to provide additional suggestion or feedback?
Ans...............................................................................................
…..................................................................................................
2.2
5
Paraphrase This Document
Need a fresh take? Get an instant paraphrase of this document with our AI Paraphraser
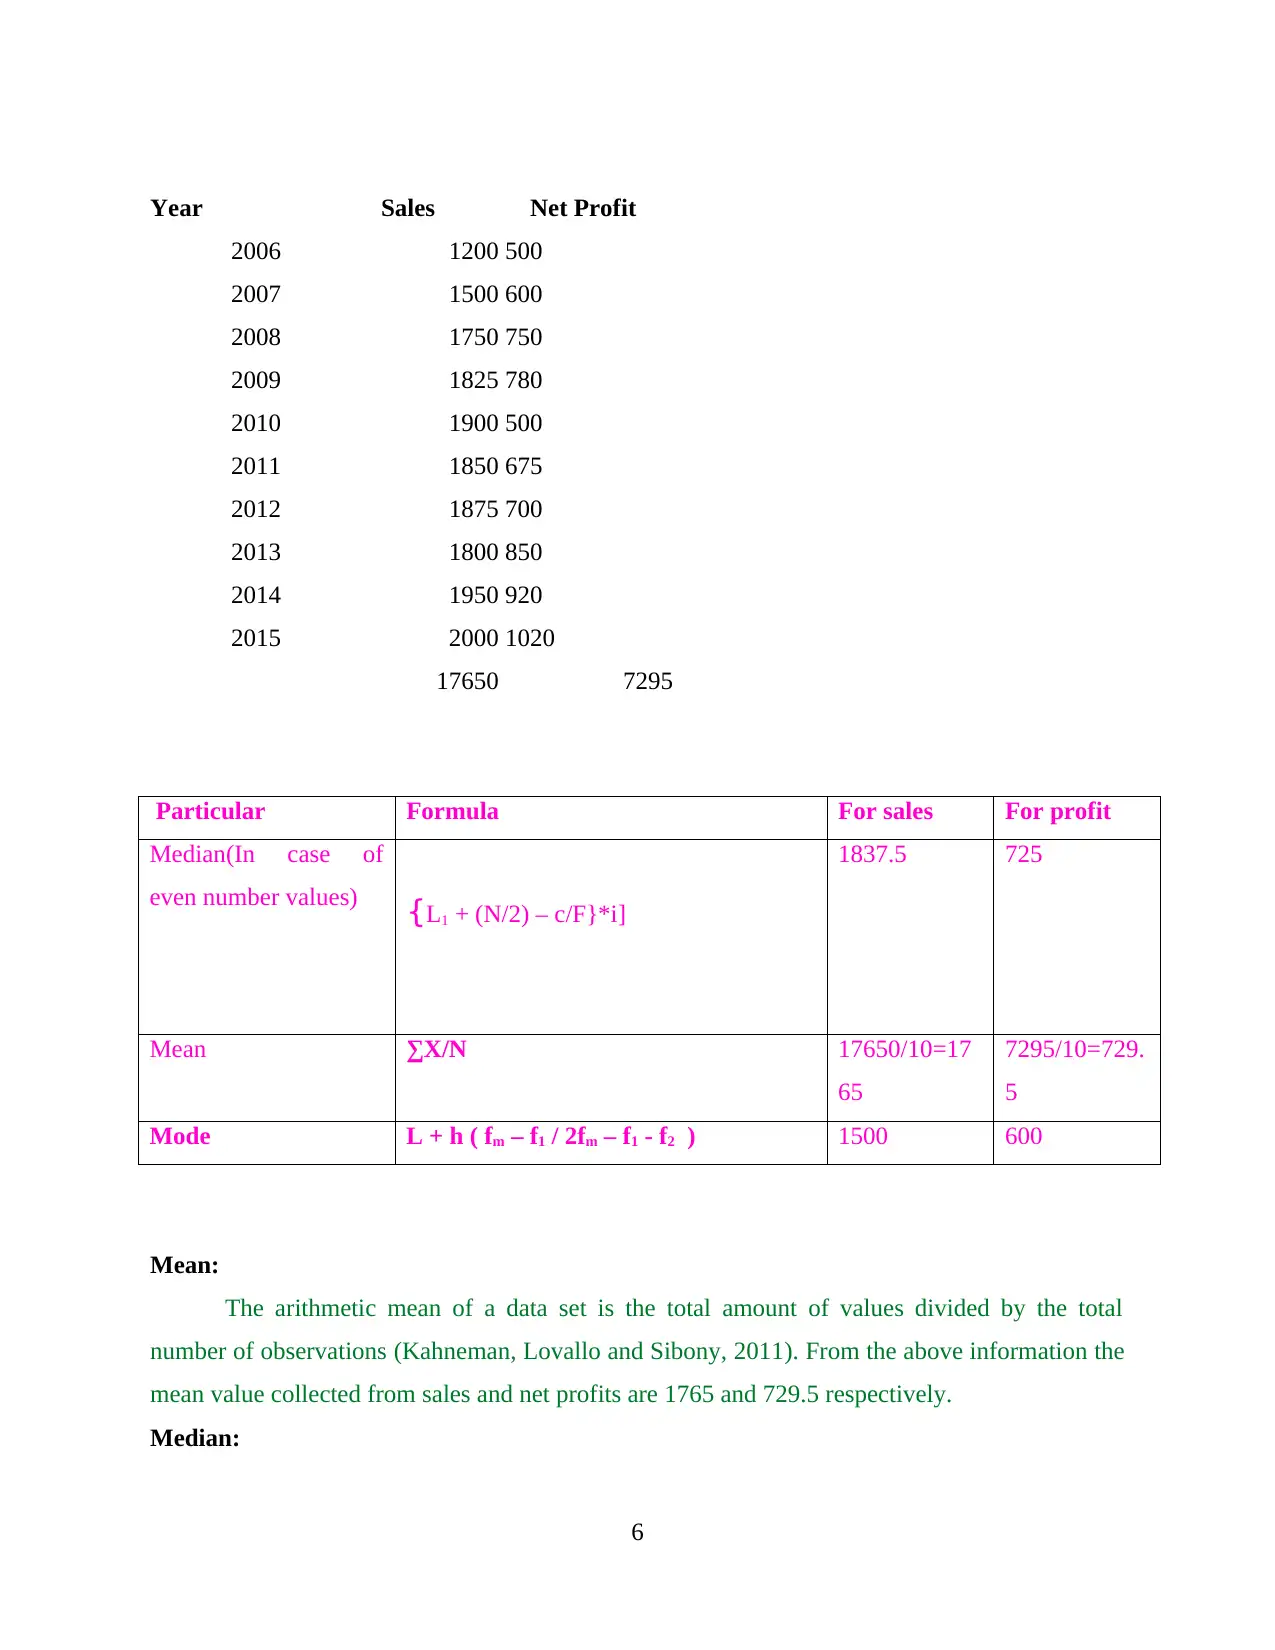
Year Sales Net Profit
2006 1200 500
2007 1500 600
2008 1750 750
2009 1825 780
2010 1900 500
2011 1850 675
2012 1875 700
2013 1800 850
2014 1950 920
2015 2000 1020
17650 7295
Particular Formula For sales For profit
Median(In case of
even number values) {L1 + (N/2) – c/F}*i]
1837.5 725
Mean ∑X/N 17650/10=17
65
7295/10=729.
5
Mode L + h ( fm – f1 / 2fm – f1 - f2 ) 1500 600
Mean:
The arithmetic mean of a data set is the total amount of values divided by the total
number of observations (Kahneman, Lovallo and Sibony, 2011). From the above information the
mean value collected from sales and net profits are 1765 and 729.5 respectively.
Median:
6
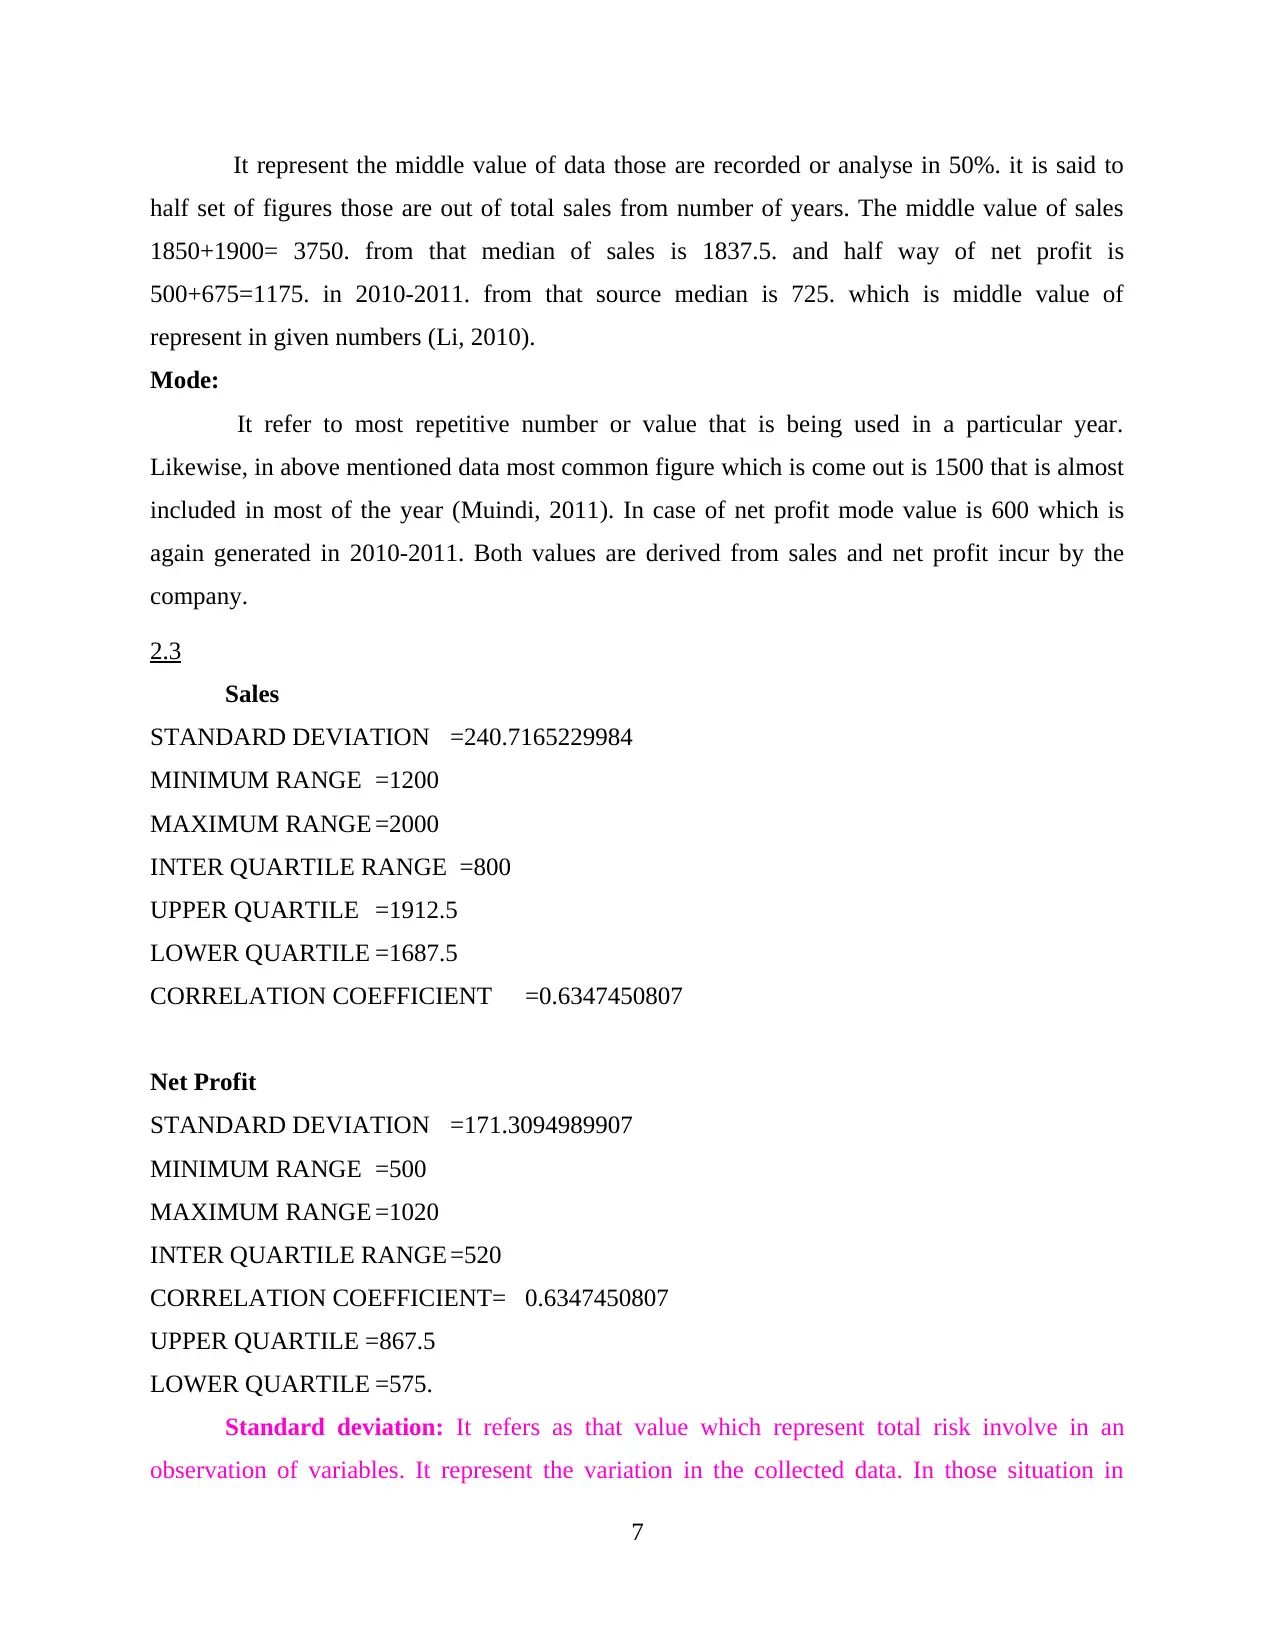
It represent the middle value of data those are recorded or analyse in 50%. it is said to
half set of figures those are out of total sales from number of years. The middle value of sales
1850+1900= 3750. from that median of sales is 1837.5. and half way of net profit is
500+675=1175. in 2010-2011. from that source median is 725. which is middle value of
represent in given numbers (Li, 2010).
Mode:
It refer to most repetitive number or value that is being used in a particular year.
Likewise, in above mentioned data most common figure which is come out is 1500 that is almost
included in most of the year (Muindi, 2011). In case of net profit mode value is 600 which is
again generated in 2010-2011. Both values are derived from sales and net profit incur by the
company.
2.3
Sales
STANDARD DEVIATION =240.7165229984
MINIMUM RANGE =1200
MAXIMUM RANGE =2000
INTER QUARTILE RANGE =800
UPPER QUARTILE =1912.5
LOWER QUARTILE =1687.5
CORRELATION COEFFICIENT =0.6347450807
Net Profit
STANDARD DEVIATION =171.3094989907
MINIMUM RANGE =500
MAXIMUM RANGE =1020
INTER QUARTILE RANGE =520
CORRELATION COEFFICIENT= 0.6347450807
UPPER QUARTILE =867.5
LOWER QUARTILE =575.
Standard deviation: It refers as that value which represent total risk involve in an
observation of variables. It represent the variation in the collected data. In those situation in
7
⊘ This is a preview!⊘
Do you want full access?
Subscribe today to unlock all pages.
Trusted by 1+ million students worldwide
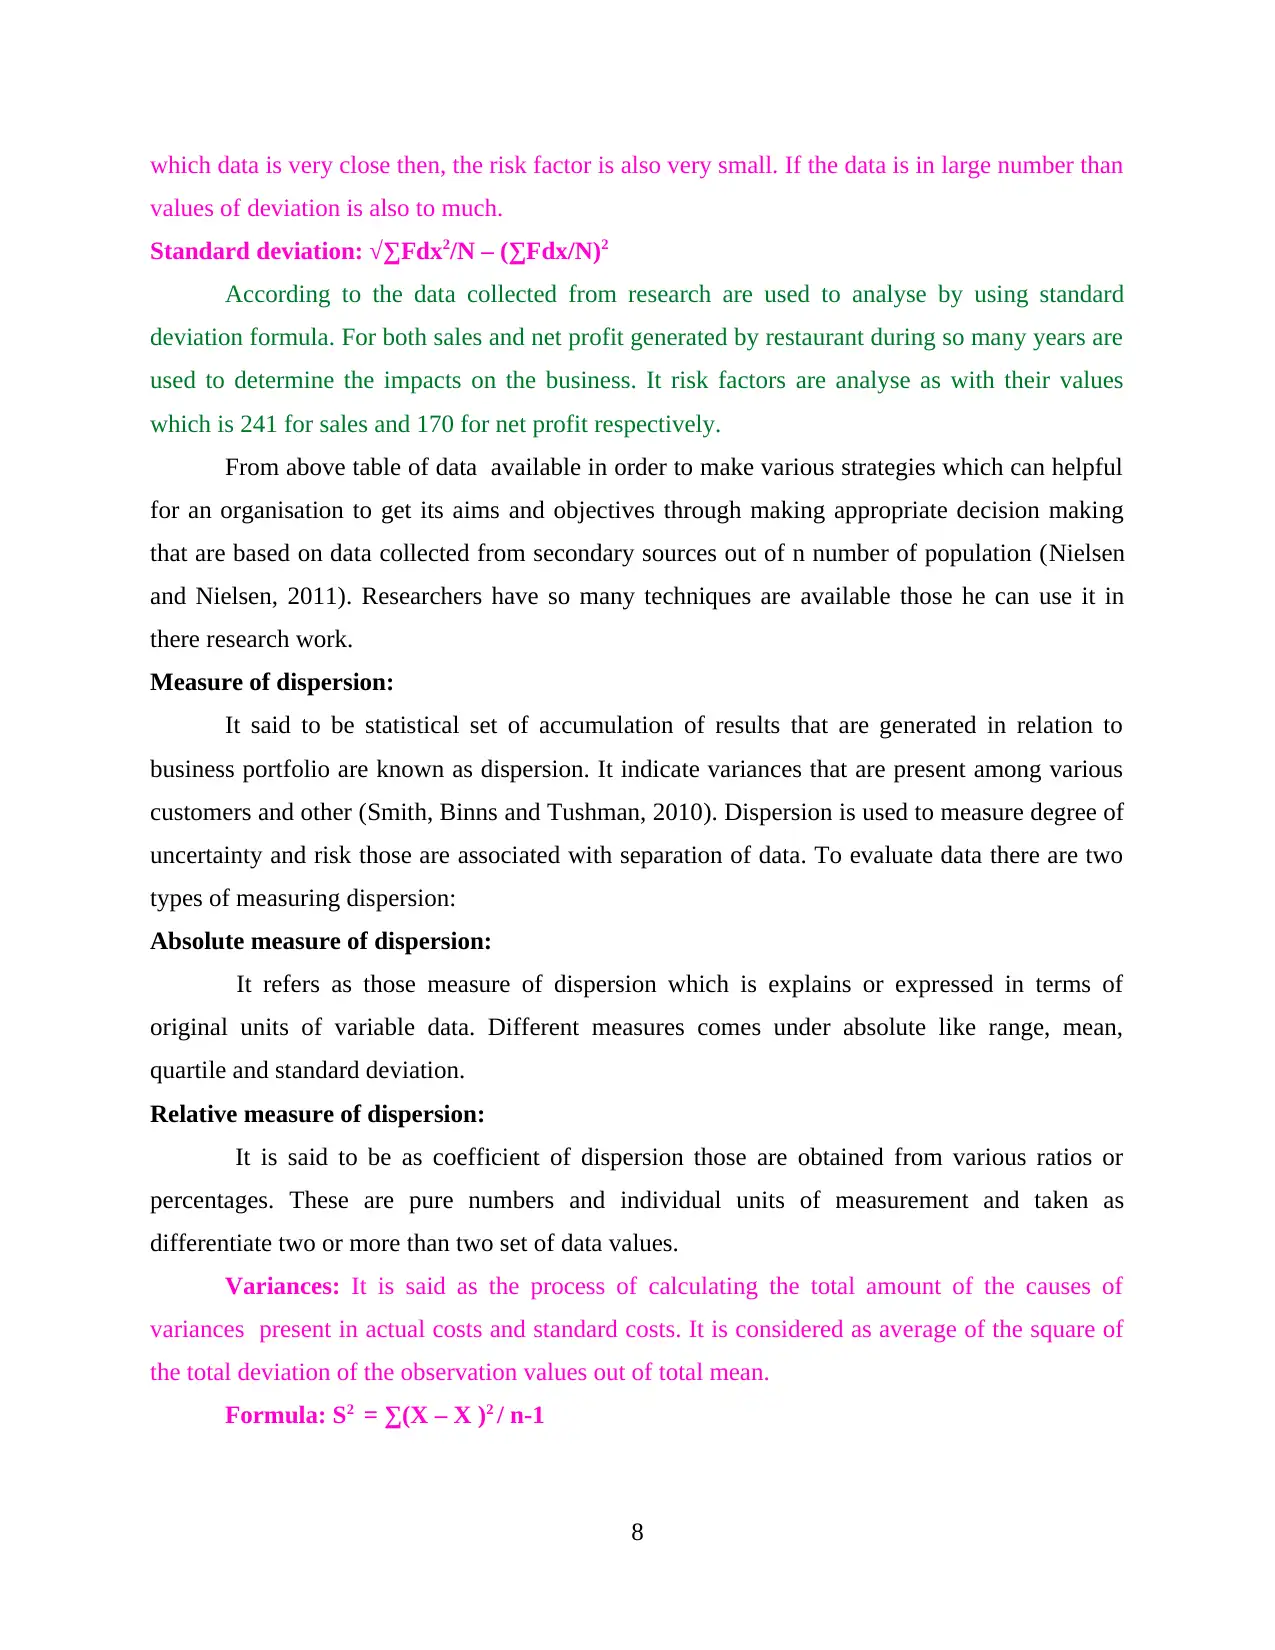
which data is very close then, the risk factor is also very small. If the data is in large number than
values of deviation is also to much.
Standard deviation: √∑Fdx2/N – (∑Fdx/N)2
According to the data collected from research are used to analyse by using standard
deviation formula. For both sales and net profit generated by restaurant during so many years are
used to determine the impacts on the business. It risk factors are analyse as with their values
which is 241 for sales and 170 for net profit respectively.
From above table of data available in order to make various strategies which can helpful
for an organisation to get its aims and objectives through making appropriate decision making
that are based on data collected from secondary sources out of n number of population (Nielsen
and Nielsen, 2011). Researchers have so many techniques are available those he can use it in
there research work.
Measure of dispersion:
It said to be statistical set of accumulation of results that are generated in relation to
business portfolio are known as dispersion. It indicate variances that are present among various
customers and other (Smith, Binns and Tushman, 2010). Dispersion is used to measure degree of
uncertainty and risk those are associated with separation of data. To evaluate data there are two
types of measuring dispersion:
Absolute measure of dispersion:
It refers as those measure of dispersion which is explains or expressed in terms of
original units of variable data. Different measures comes under absolute like range, mean,
quartile and standard deviation.
Relative measure of dispersion:
It is said to be as coefficient of dispersion those are obtained from various ratios or
percentages. These are pure numbers and individual units of measurement and taken as
differentiate two or more than two set of data values.
Variances: It is said as the process of calculating the total amount of the causes of
variances present in actual costs and standard costs. It is considered as average of the square of
the total deviation of the observation values out of total mean.
Formula: S2 = ∑(X – X )2 / n-1
8
Paraphrase This Document
Need a fresh take? Get an instant paraphrase of this document with our AI Paraphraser
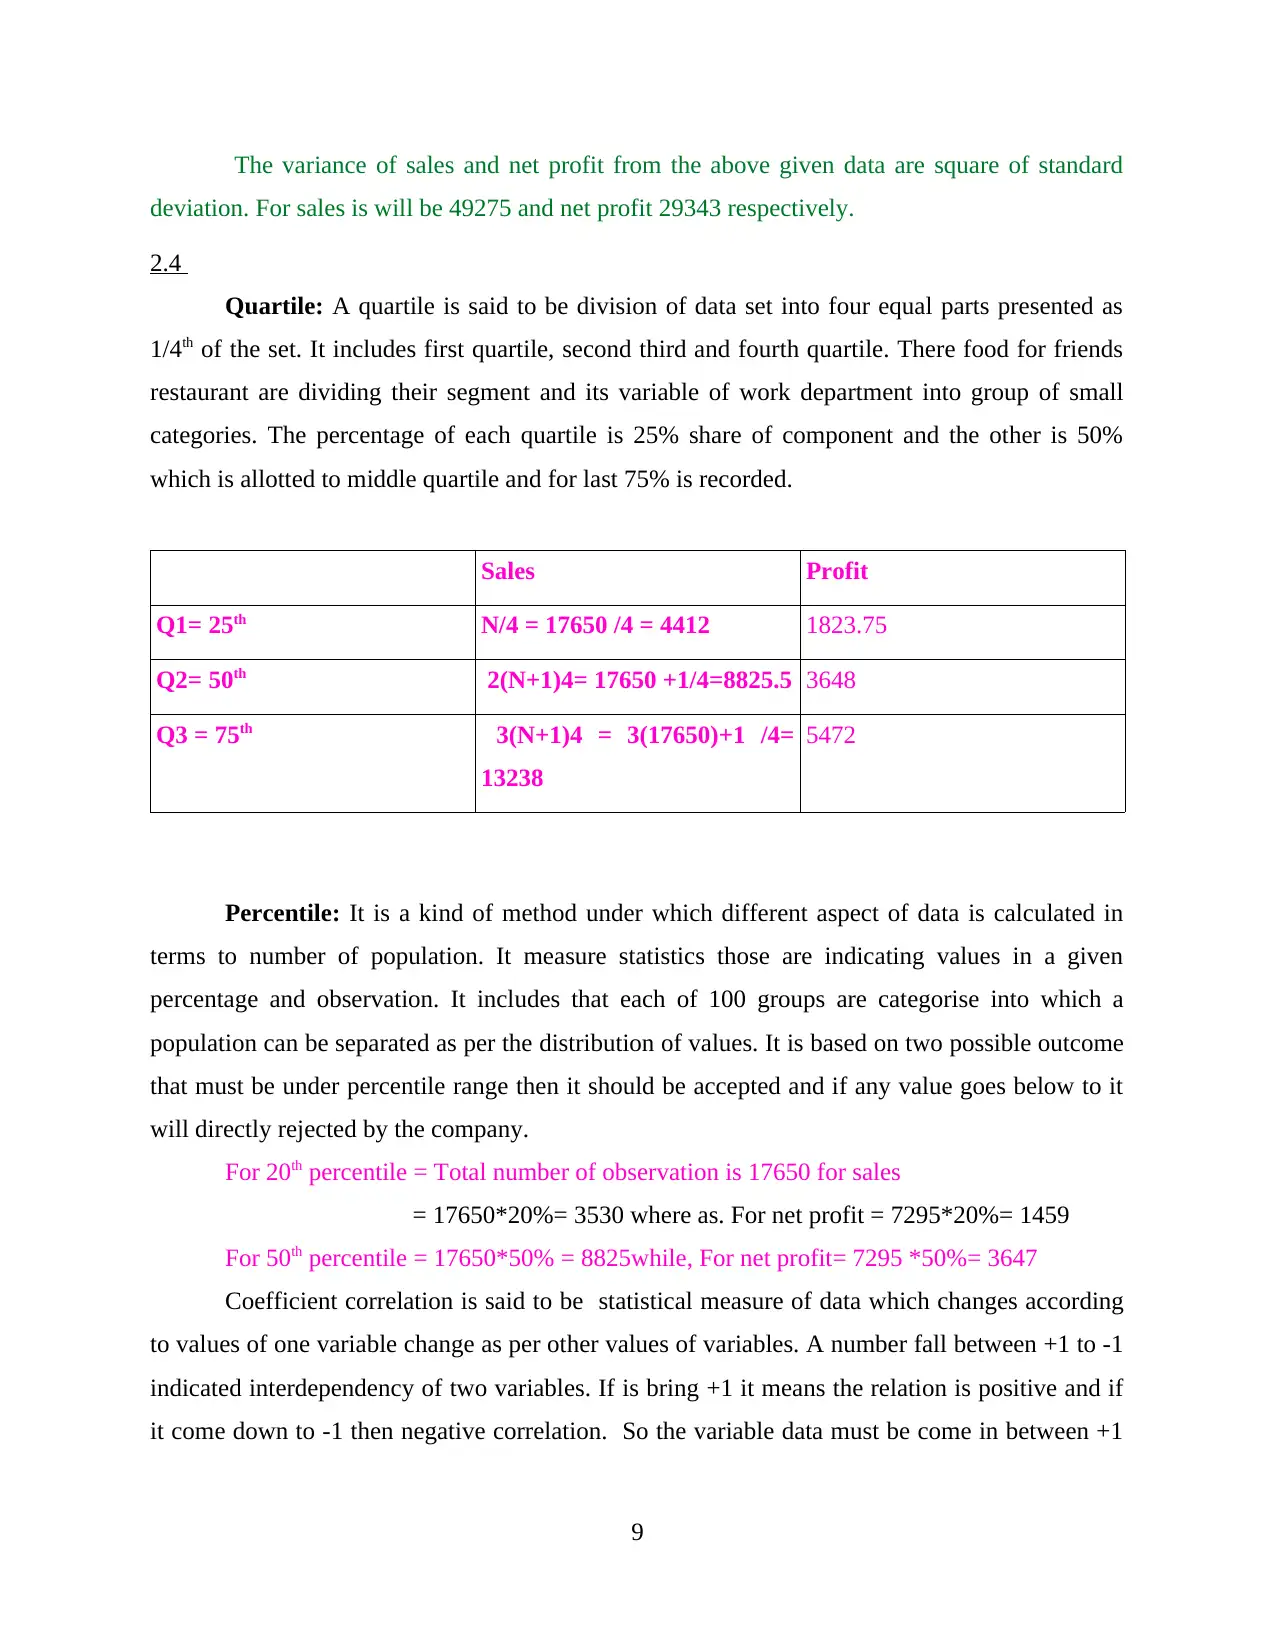
The variance of sales and net profit from the above given data are square of standard
deviation. For sales is will be 49275 and net profit 29343 respectively.
2.4
Quartile: A quartile is said to be division of data set into four equal parts presented as
1/4th of the set. It includes first quartile, second third and fourth quartile. There food for friends
restaurant are dividing their segment and its variable of work department into group of small
categories. The percentage of each quartile is 25% share of component and the other is 50%
which is allotted to middle quartile and for last 75% is recorded.
Sales Profit
Q1= 25th N/4 = 17650 /4 = 4412 1823.75
Q2= 50th 2(N+1)4= 17650 +1/4=8825.5 3648
Q3 = 75th 3(N+1)4 = 3(17650)+1 /4=
13238
5472
Percentile: It is a kind of method under which different aspect of data is calculated in
terms to number of population. It measure statistics those are indicating values in a given
percentage and observation. It includes that each of 100 groups are categorise into which a
population can be separated as per the distribution of values. It is based on two possible outcome
that must be under percentile range then it should be accepted and if any value goes below to it
will directly rejected by the company.
For 20th percentile = Total number of observation is 17650 for sales
= 17650*20%= 3530 where as. For net profit = 7295*20%= 1459
For 50th percentile = 17650*50% = 8825while, For net profit= 7295 *50%= 3647
Coefficient correlation is said to be statistical measure of data which changes according
to values of one variable change as per other values of variables. A number fall between +1 to -1
indicated interdependency of two variables. If is bring +1 it means the relation is positive and if
it come down to -1 then negative correlation. So the variable data must be come in between +1
9
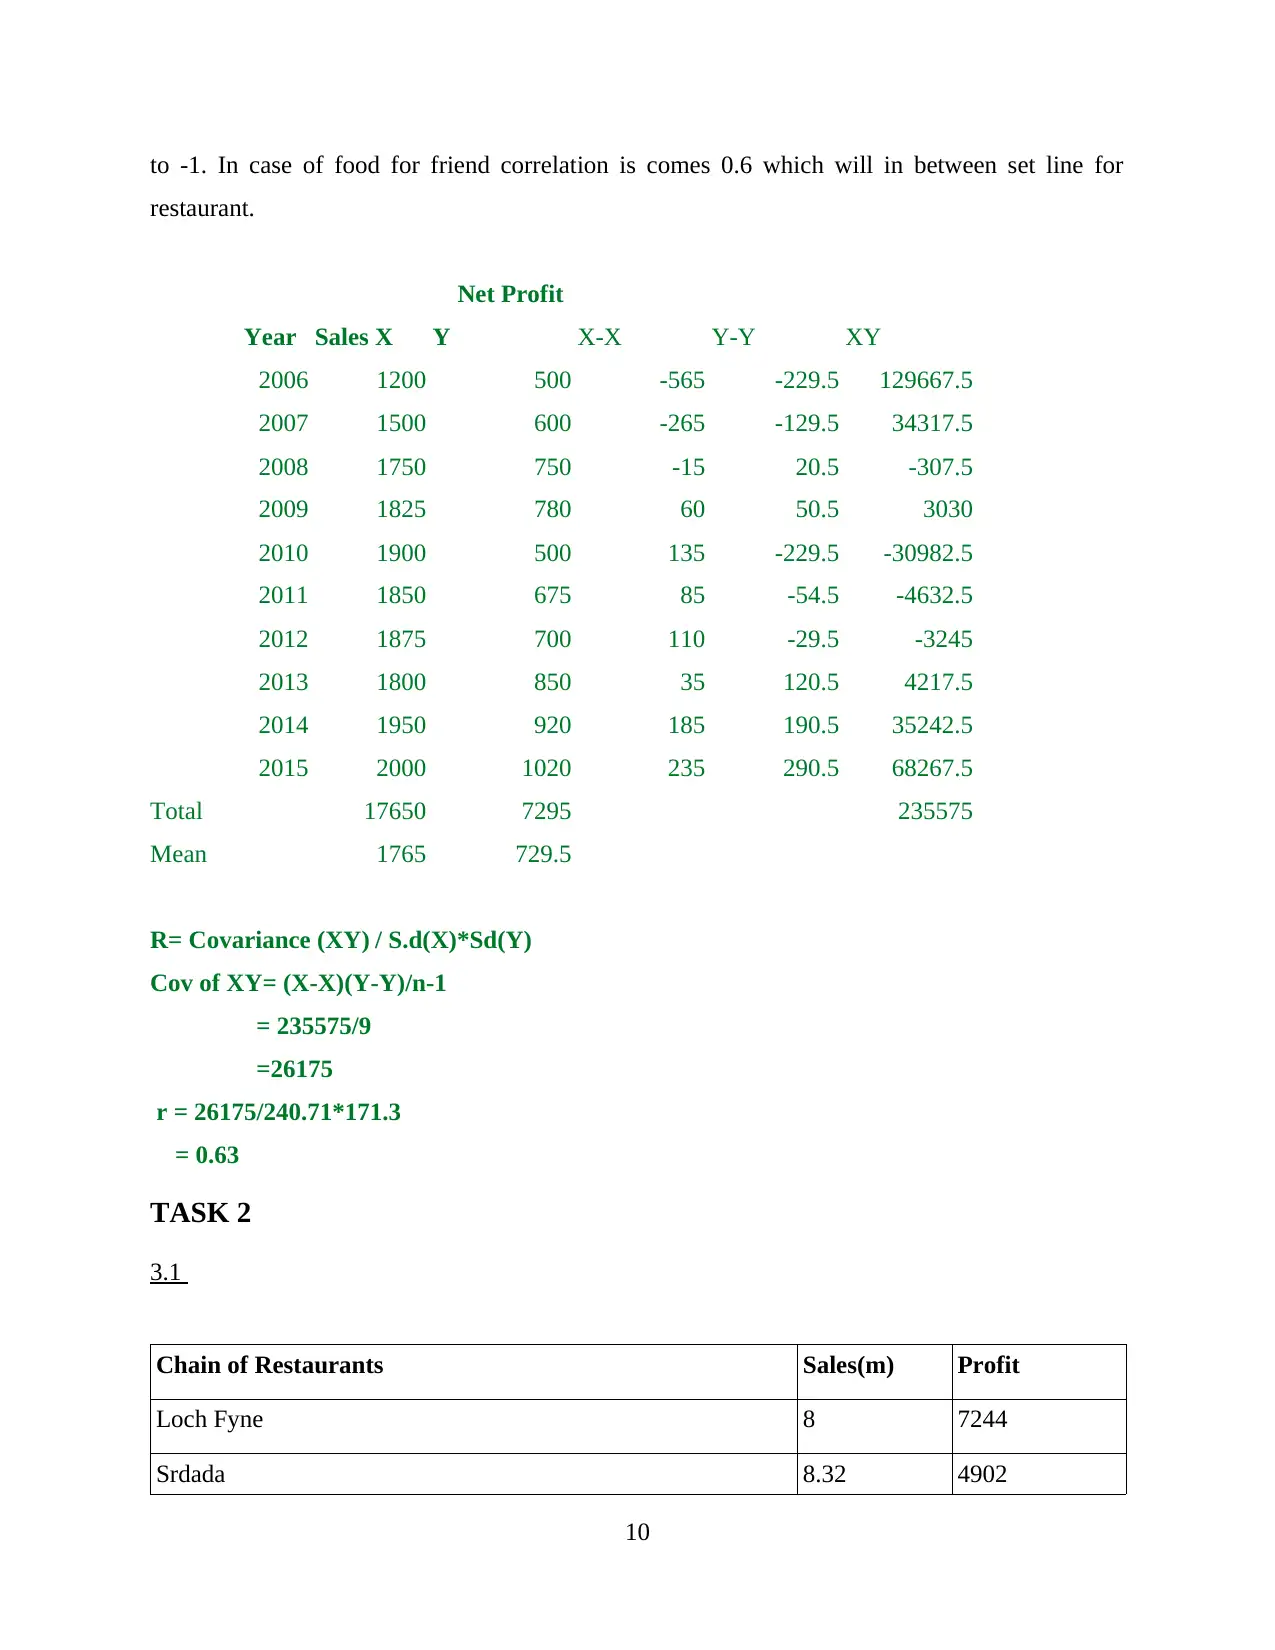
to -1. In case of food for friend correlation is comes 0.6 which will in between set line for
restaurant.
Year Sales X
Net Profit
Y X-X Y-Y XY
2006 1200 500 -565 -229.5 129667.5
2007 1500 600 -265 -129.5 34317.5
2008 1750 750 -15 20.5 -307.5
2009 1825 780 60 50.5 3030
2010 1900 500 135 -229.5 -30982.5
2011 1850 675 85 -54.5 -4632.5
2012 1875 700 110 -29.5 -3245
2013 1800 850 35 120.5 4217.5
2014 1950 920 185 190.5 35242.5
2015 2000 1020 235 290.5 68267.5
Total 17650 7295 235575
Mean 1765 729.5
R= Covariance (XY) / S.d(X)*Sd(Y)
Cov of XY= (X-X)(Y-Y)/n-1
= 235575/9
=26175
r = 26175/240.71*171.3
= 0.63
TASK 2
3.1
Chain of Restaurants Sales(m) Profit
Loch Fyne 8 7244
Srdada 8.32 4902
10
⊘ This is a preview!⊘
Do you want full access?
Subscribe today to unlock all pages.
Trusted by 1+ million students worldwide
1 out of 19
Related Documents


Your All-in-One AI-Powered Toolkit for Academic Success.
+13062052269
info@desklib.com
Available 24*7 on WhatsApp / Email
![[object Object]](/_next/static/media/star-bottom.7253800d.svg)
Unlock your academic potential
Copyright © 2020–2026 A2Z Services. All Rights Reserved. Developed and managed by ZUCOL.