Business Decision Making Report - Food for Friend Analysis

Verified

Added on  2023/03/30

|13
|345
|313
Report
AI Summary
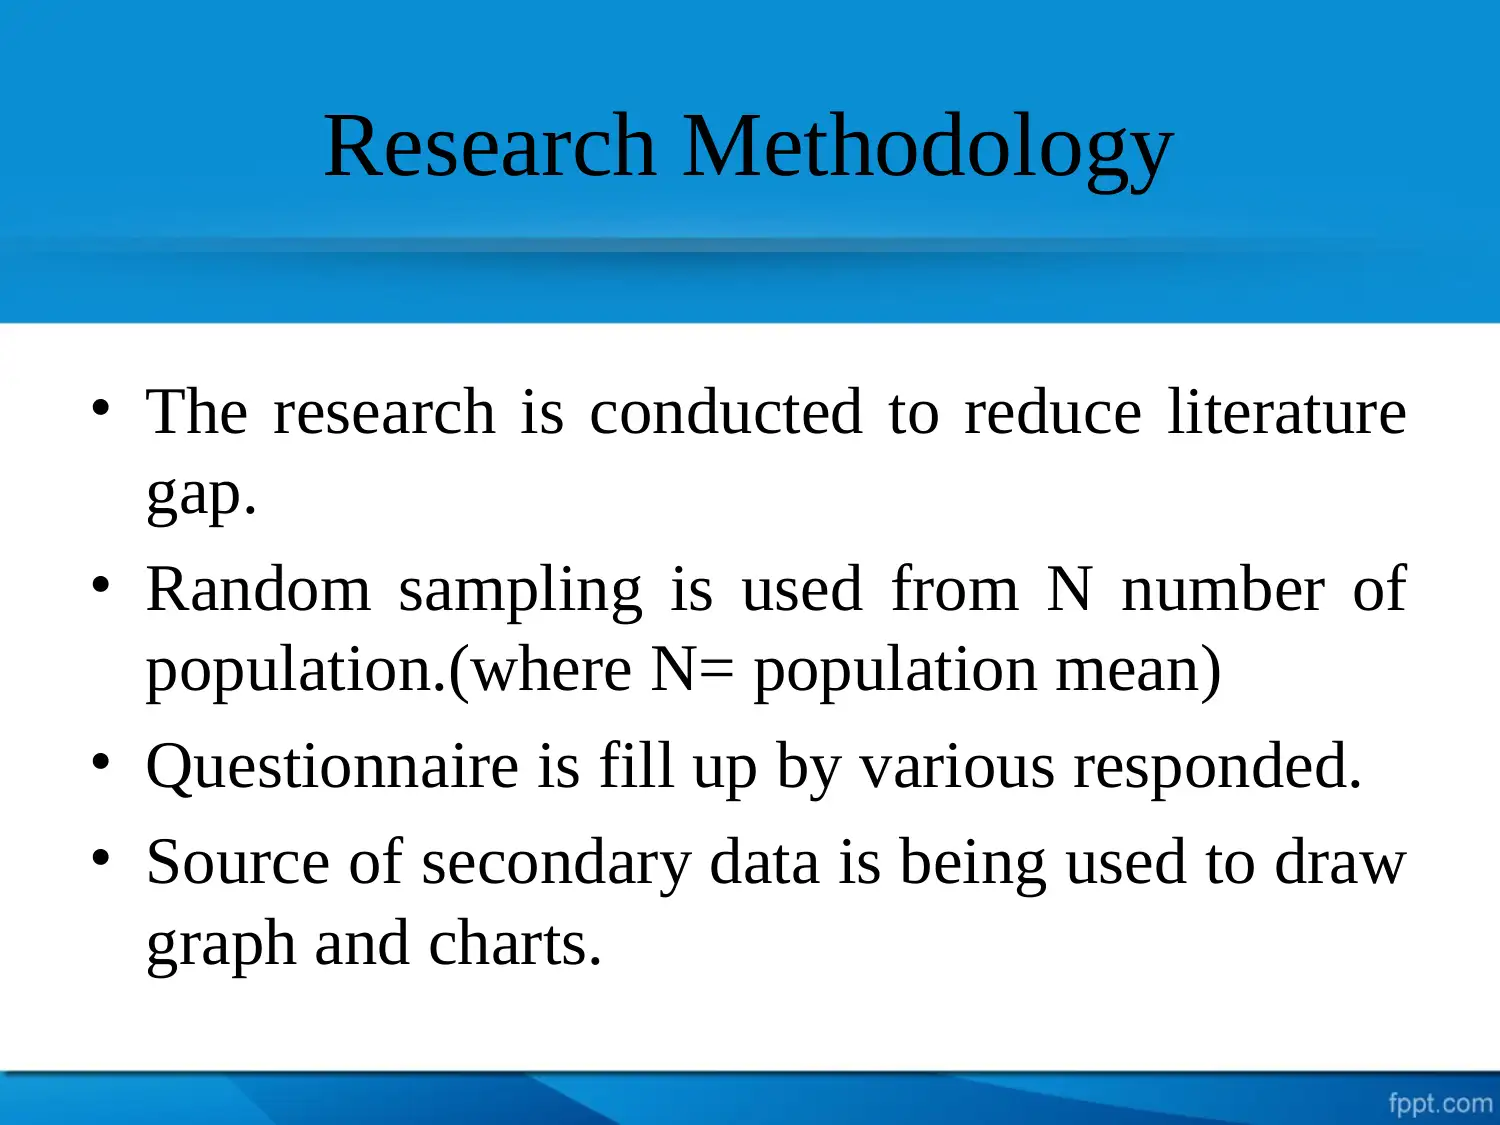
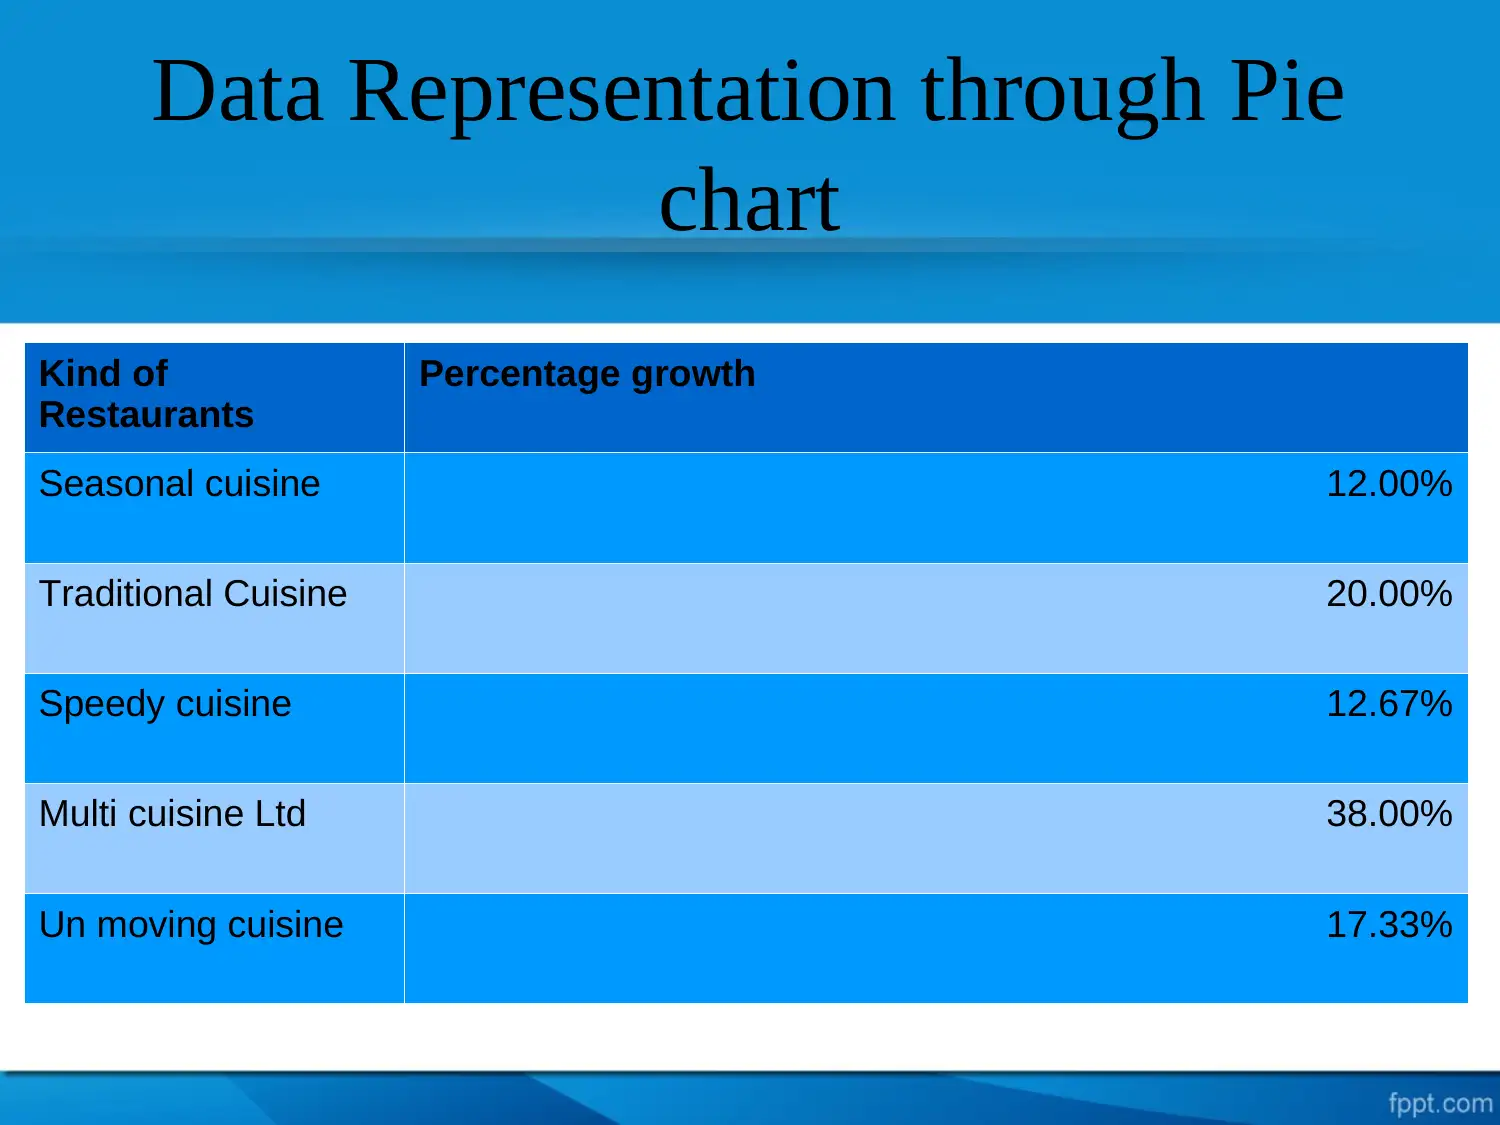
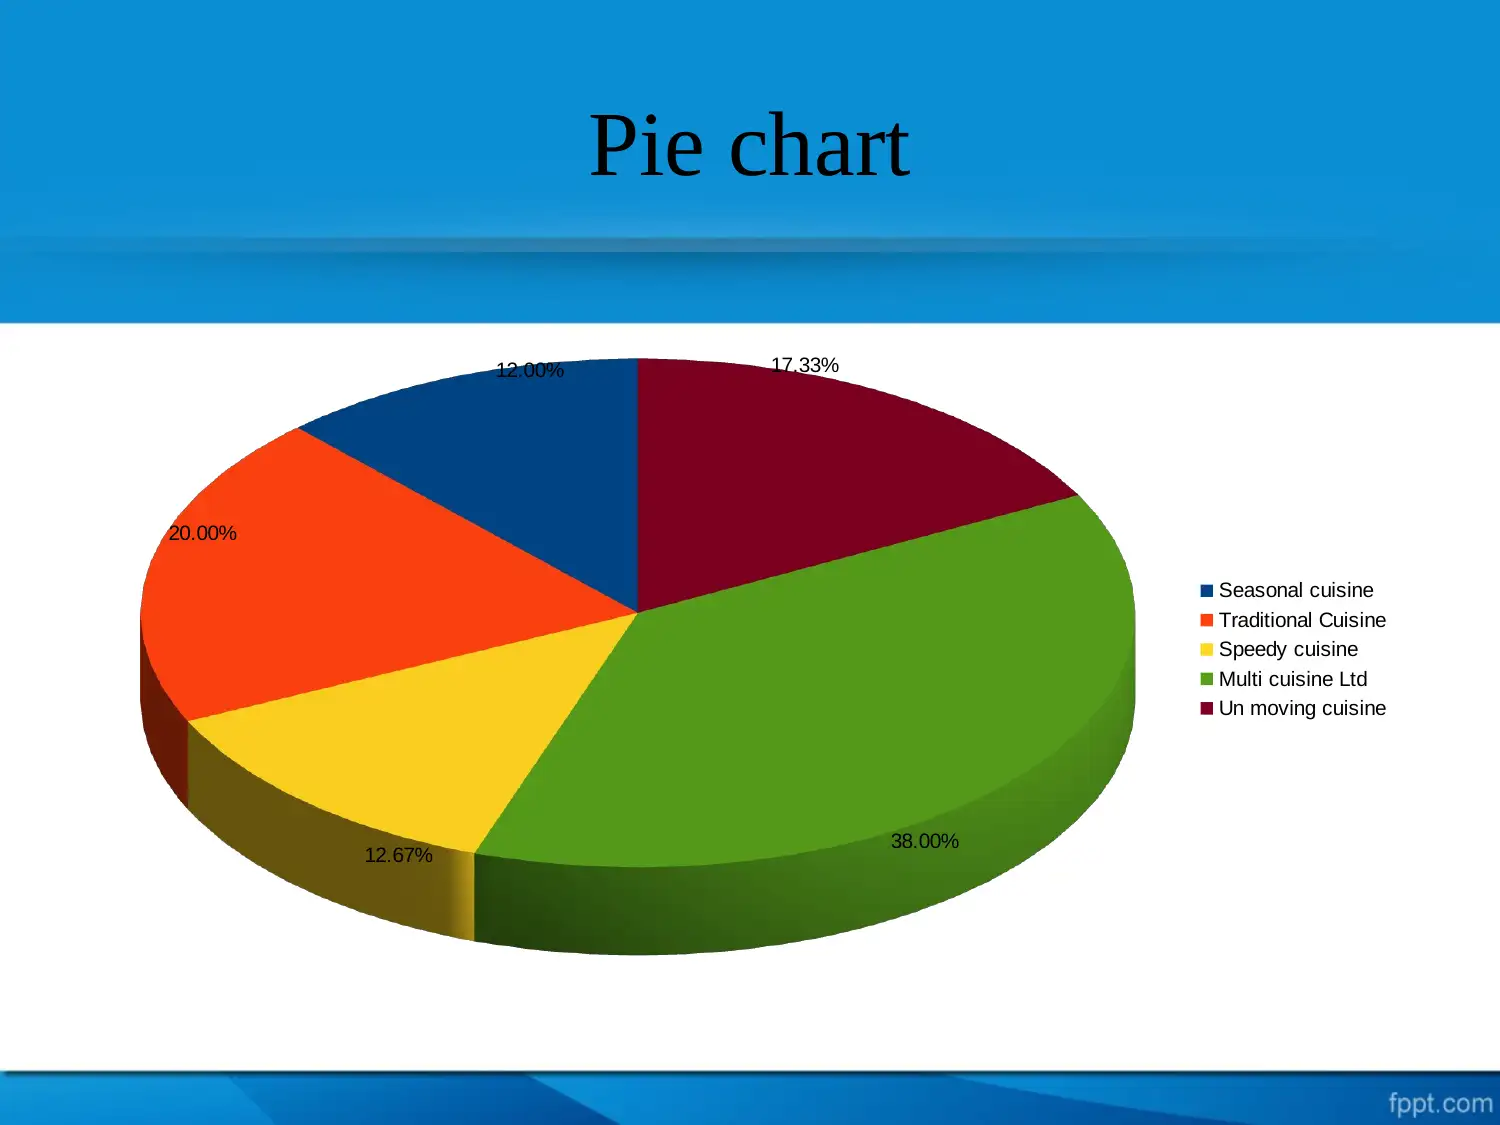
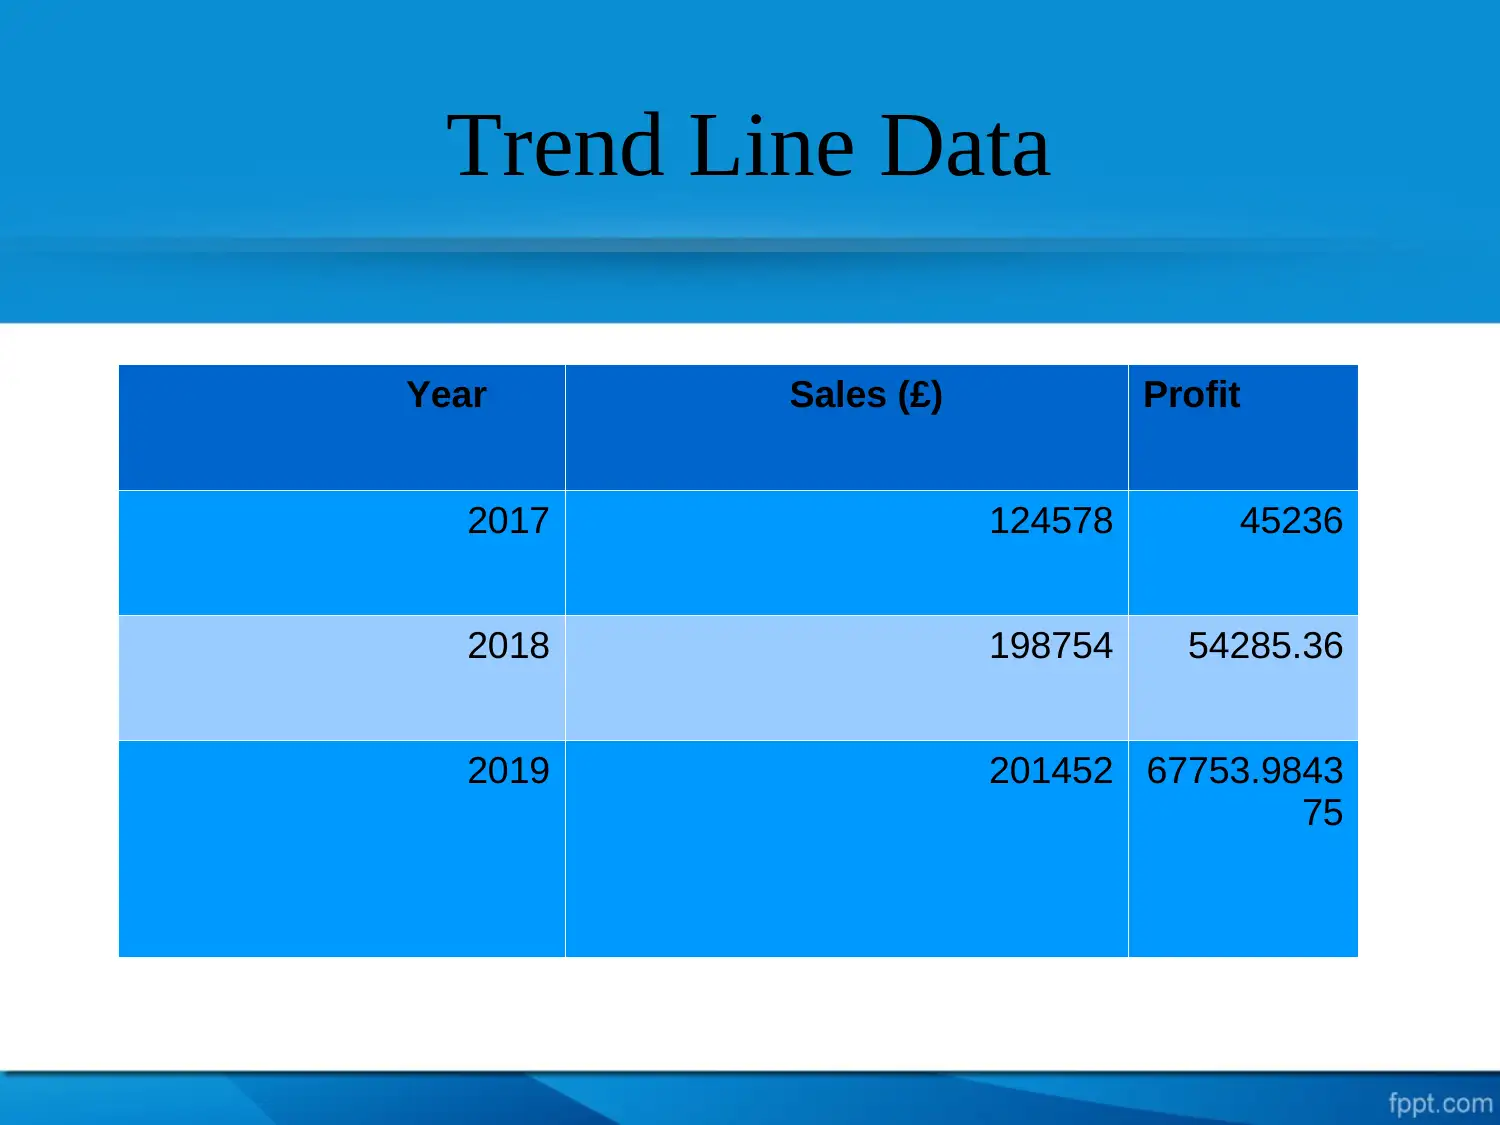
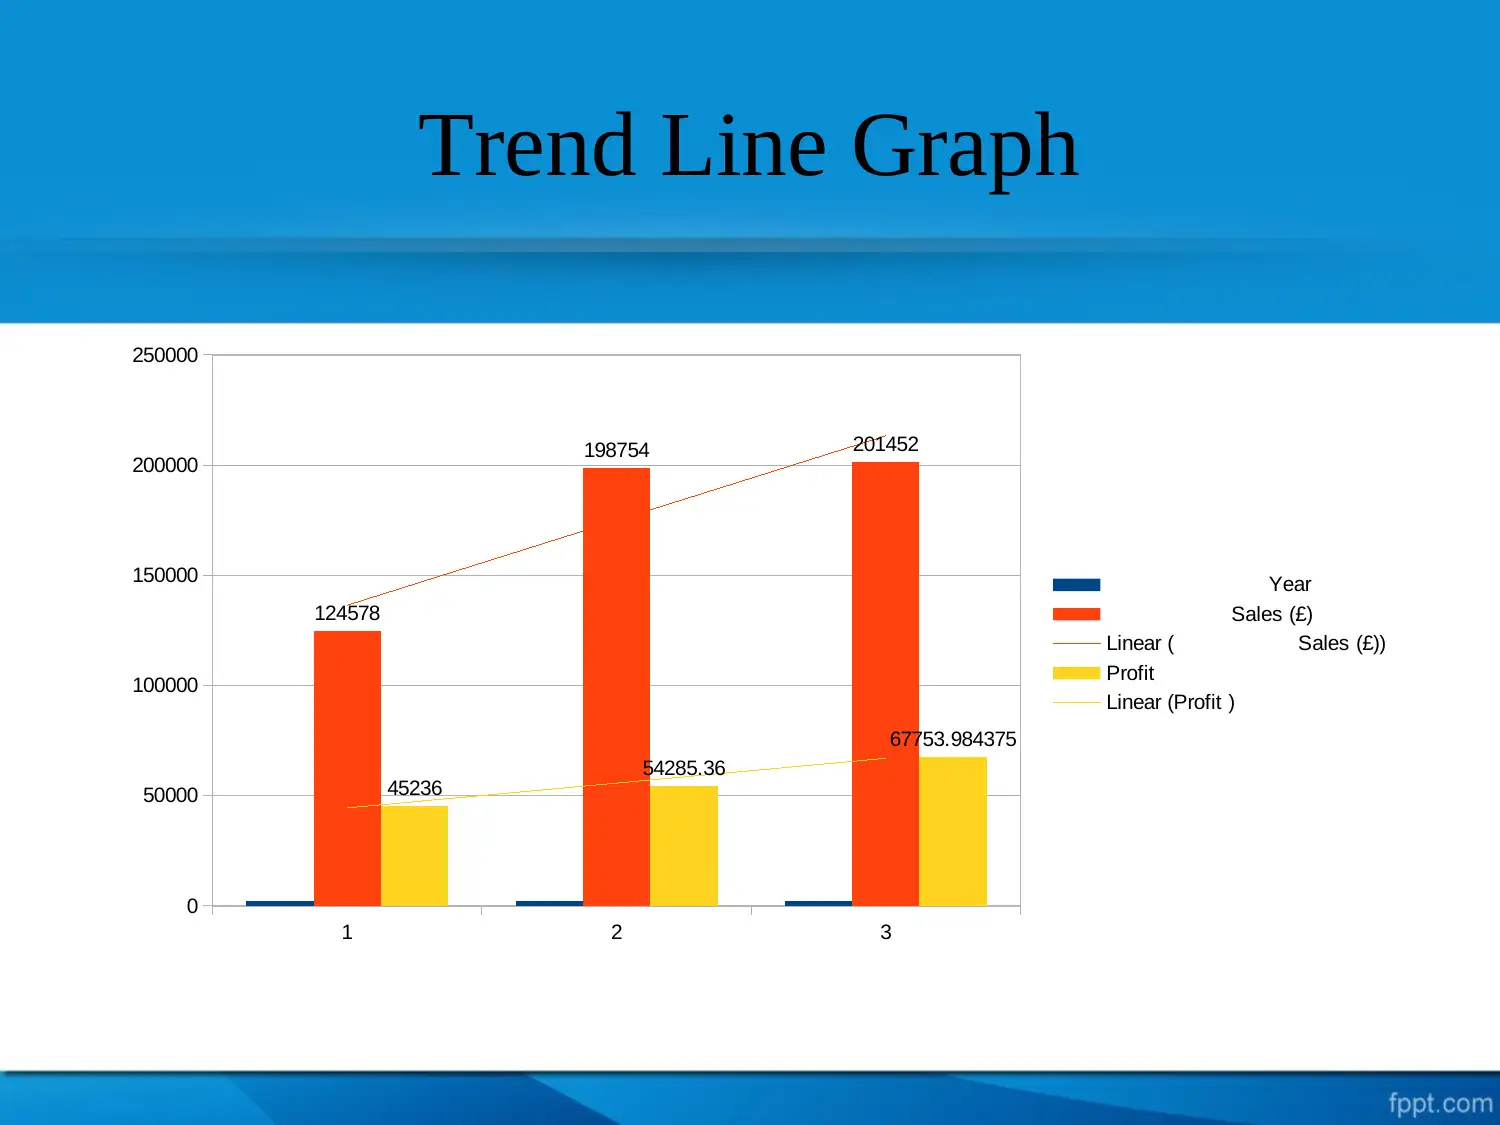
This report focuses on business decision making, specifically analyzing the performance of Food for Friend restaurant. It includes an introduction, objectives, research methodology, and data representation through pie charts and trend lines. The report presents findings on sales, customer feedback, and the performance of different cuisine types. It also offers suggestions for improvement, such as prioritizing customer feedback, conducting staff reviews, and expanding the menu. The report uses secondary data sources and includes references to support its analysis. Overall, the report aims to provide insights and recommendations to enhance the restaurant's operations and decision-making processes, with the goal of improving customer satisfaction and business performance.
Document Page
BUSINESS DECISION
MAKING
Task 3.3
tabler-icon-diamond-filled.svg

Paraphrase This Document

Need a fresh take? Get an instant paraphrase of this document with our AI Paraphraser
Document Page
Cover Content
Introduction
Objectives
Research methodology
Data Representation
Trend line
Findings
Suggestions
References
Document Page
Introduction
Business decision making is useful aspect of Food
for Friend restaurant that will be helpful in taking
corrective decision that would benefit them.
Document Page
Objective
The aim of conduction research on restaurant
sector is to know customer review's about the
service and quality of cuisine offered to their
customers.
tabler-icon-diamond-filled.svg

Paraphrase This Document

Need a fresh take? Get an instant paraphrase of this document with our AI Paraphraser
Document Page
Research Methodology
The research is conducted to reduce literature
gap.
Random sampling is used from N number of
population.(where N= population mean)
Questionnaire is fill up by various responded.
Source of secondary data is being used to draw
graph and charts.
Document Page
Data Representation through Pie
chart
Kind of
Restaurants
Percentage growth
Seasonal cuisine 12.00%
Traditional Cuisine 20.00%
Speedy cuisine 12.67%
Multi cuisine Ltd 38.00%
Un moving cuisine 17.33%
Document Page
Pie chart
12.00%
20.00%
12.67% 38.00%
17.33%
Seasonal cuisine
Traditional Cuisine
Speedy cuisine
Multi cuisine Ltd
Un moving cuisine
tabler-icon-diamond-filled.svg

Paraphrase This Document

Need a fresh take? Get an instant paraphrase of this document with our AI Paraphraser
Document Page
Trend Line Data
Year Sales (£) Profit
2017 124578 45236
2018 198754 54285.36
2019 201452 67753.9843
75
Document Page
Trend Line Graph
1 2 3
0
50000
100000
150000
200000
250000
124578
198754 201452
45236 54285.36
67753.984375
Year
Sales (£)
Linear ( Sales (£))
Profit
Linear (Profit )
Document Page
Findings
Record Sale is shown by company in past few
year.
Multi cuisine Ltd is showing highest growth
percentage from other restaurant.
Quality of traditional food are best part of this
restaurant.
tabler-icon-diamond-filled.svg

Paraphrase This Document

Need a fresh take? Get an instant paraphrase of this document with our AI Paraphraser
Document Page
Suggestions
Comments or feedback provided by customer
are solve with the first priority.
Review of staff's done on the basis of his/her
performance.
More variety of food is included in their
cuisine.
Document Page
References
Ho, W., Xu, X and Dey, P. K., 2010. Multi-criteria decision
making approaches for supplier evaluation and selection: A
literature review. European Journal of operational research.
202(1). pp.16-24.
Kahneman, D., Lovallo, D and Sibony, O., 2011. Before you
make that big decision. Harvard business review.89(6).
pp.50-60.
Li, C., 2010. Groundswell. Winning in a world transformed by
social technologies. Strategic Direction.26(8).
chevron_up_icon
1 out of 13
circle_padding
hide_on_mobile
zoom_out_icon
[object Object]