Report on Business Decision Making for Food for Friend Restaurant

Verified

Added on  2023/03/22

|18
|606
|96
Report
AI Summary
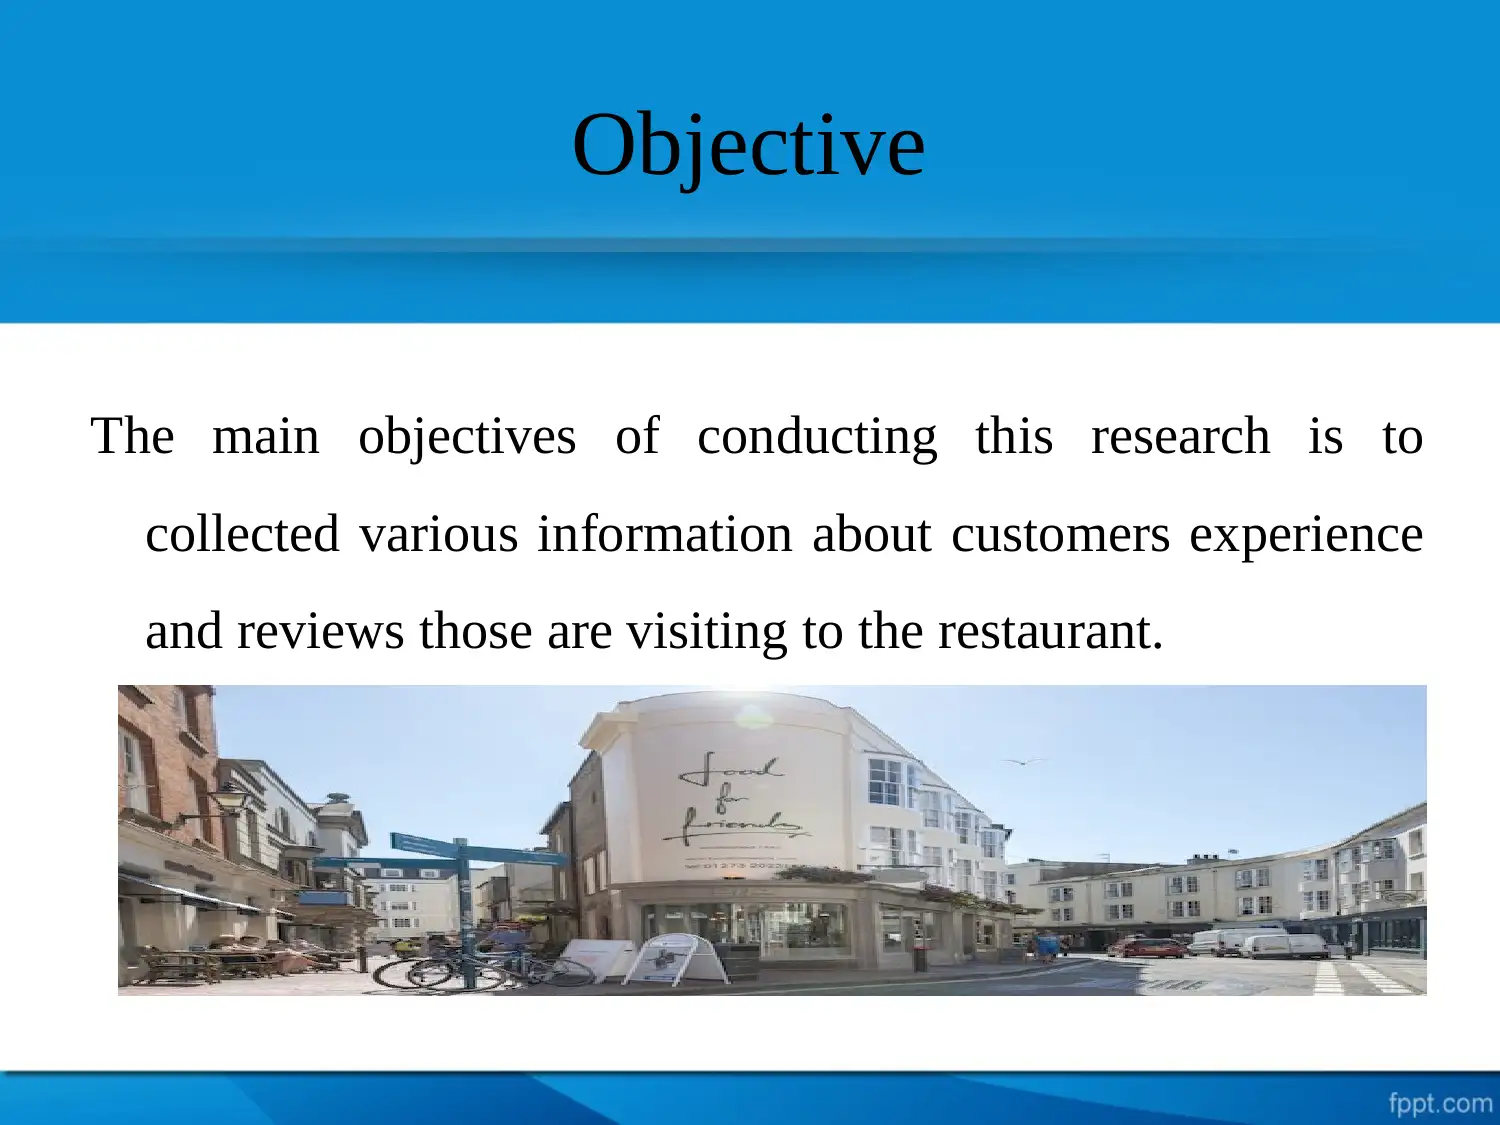
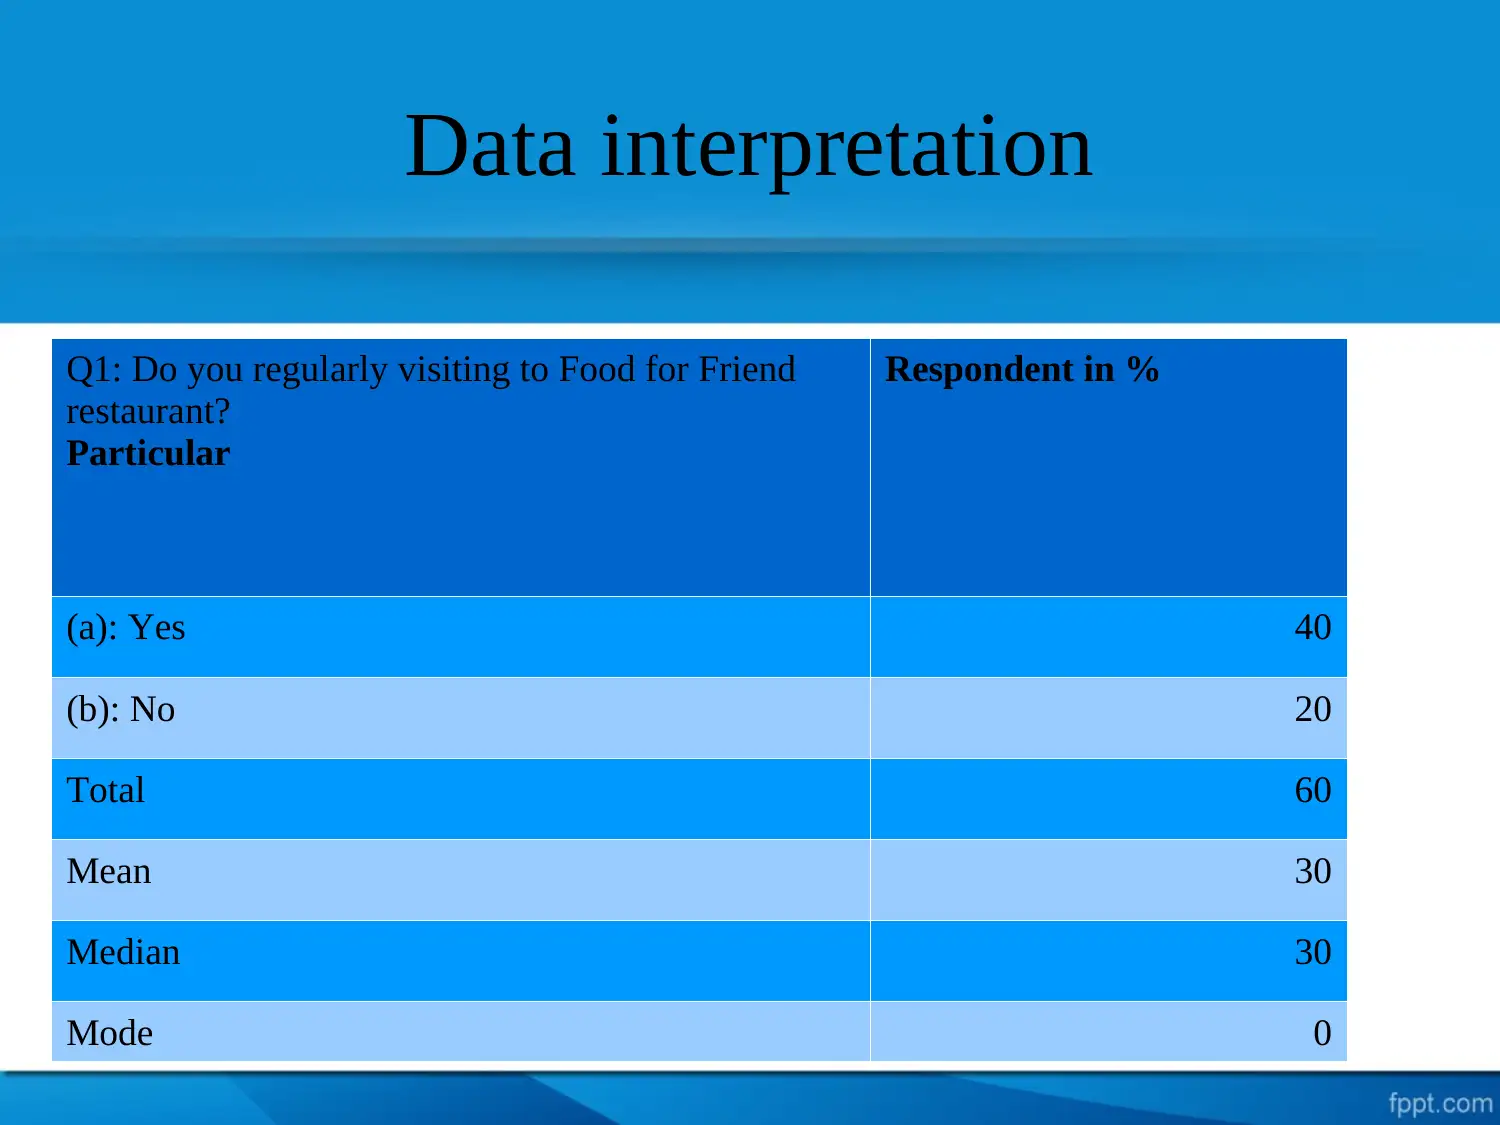
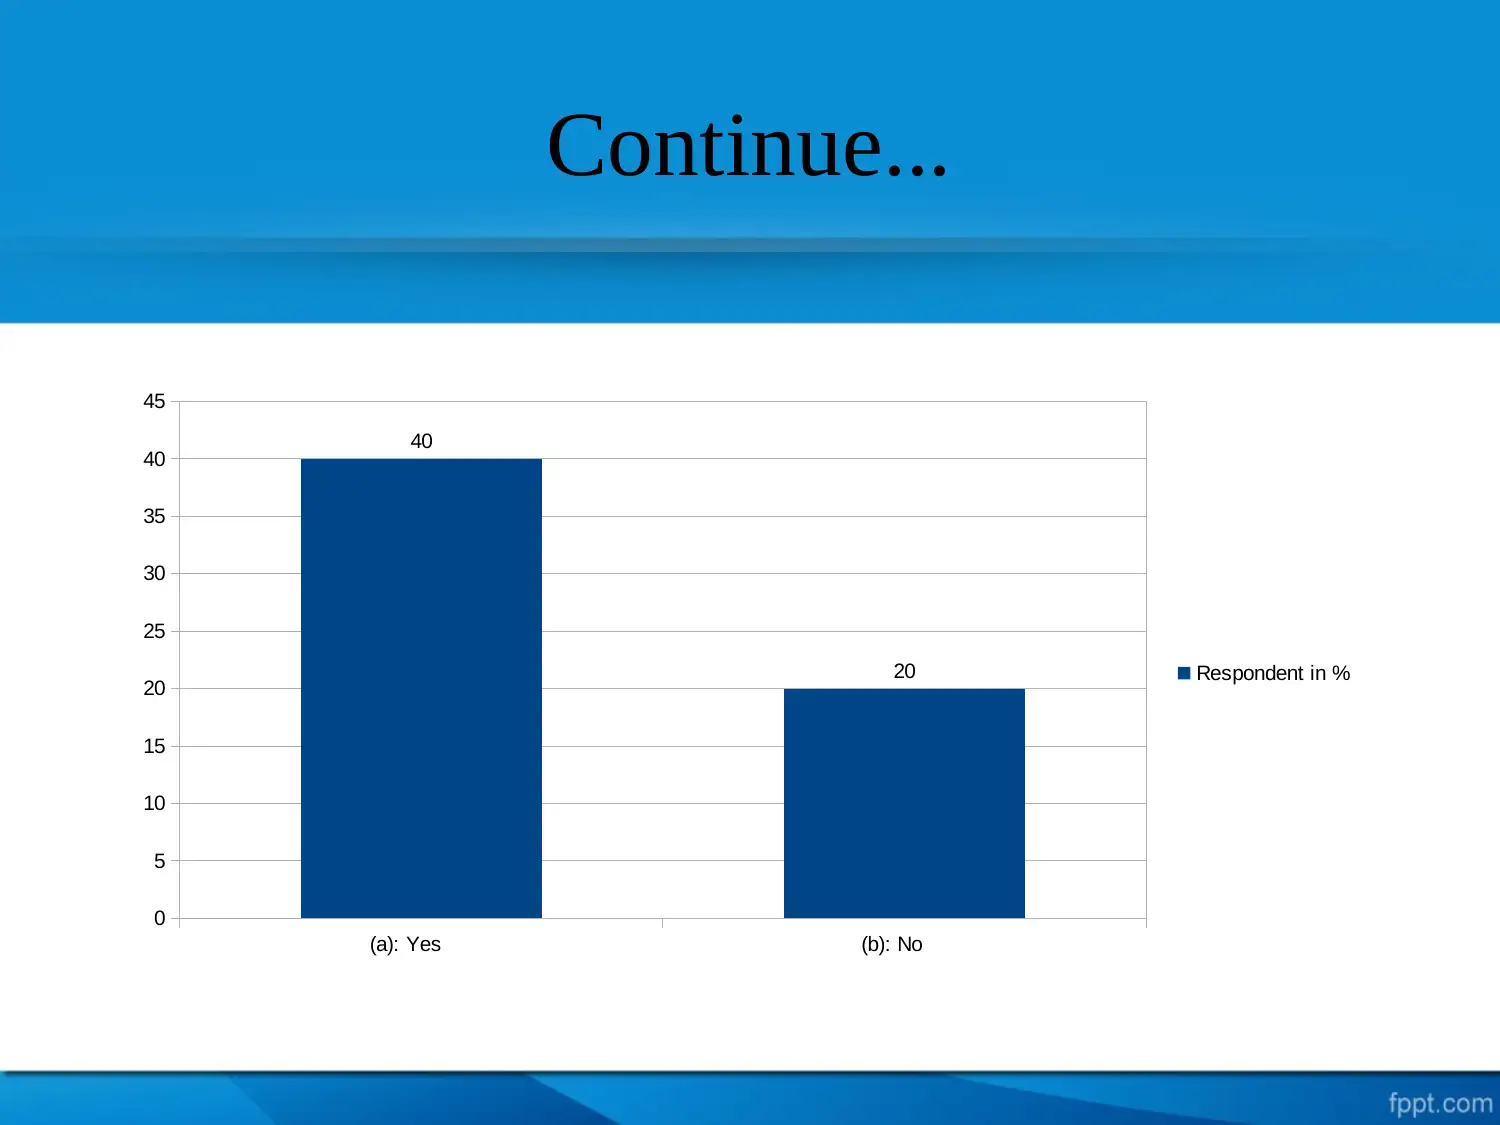
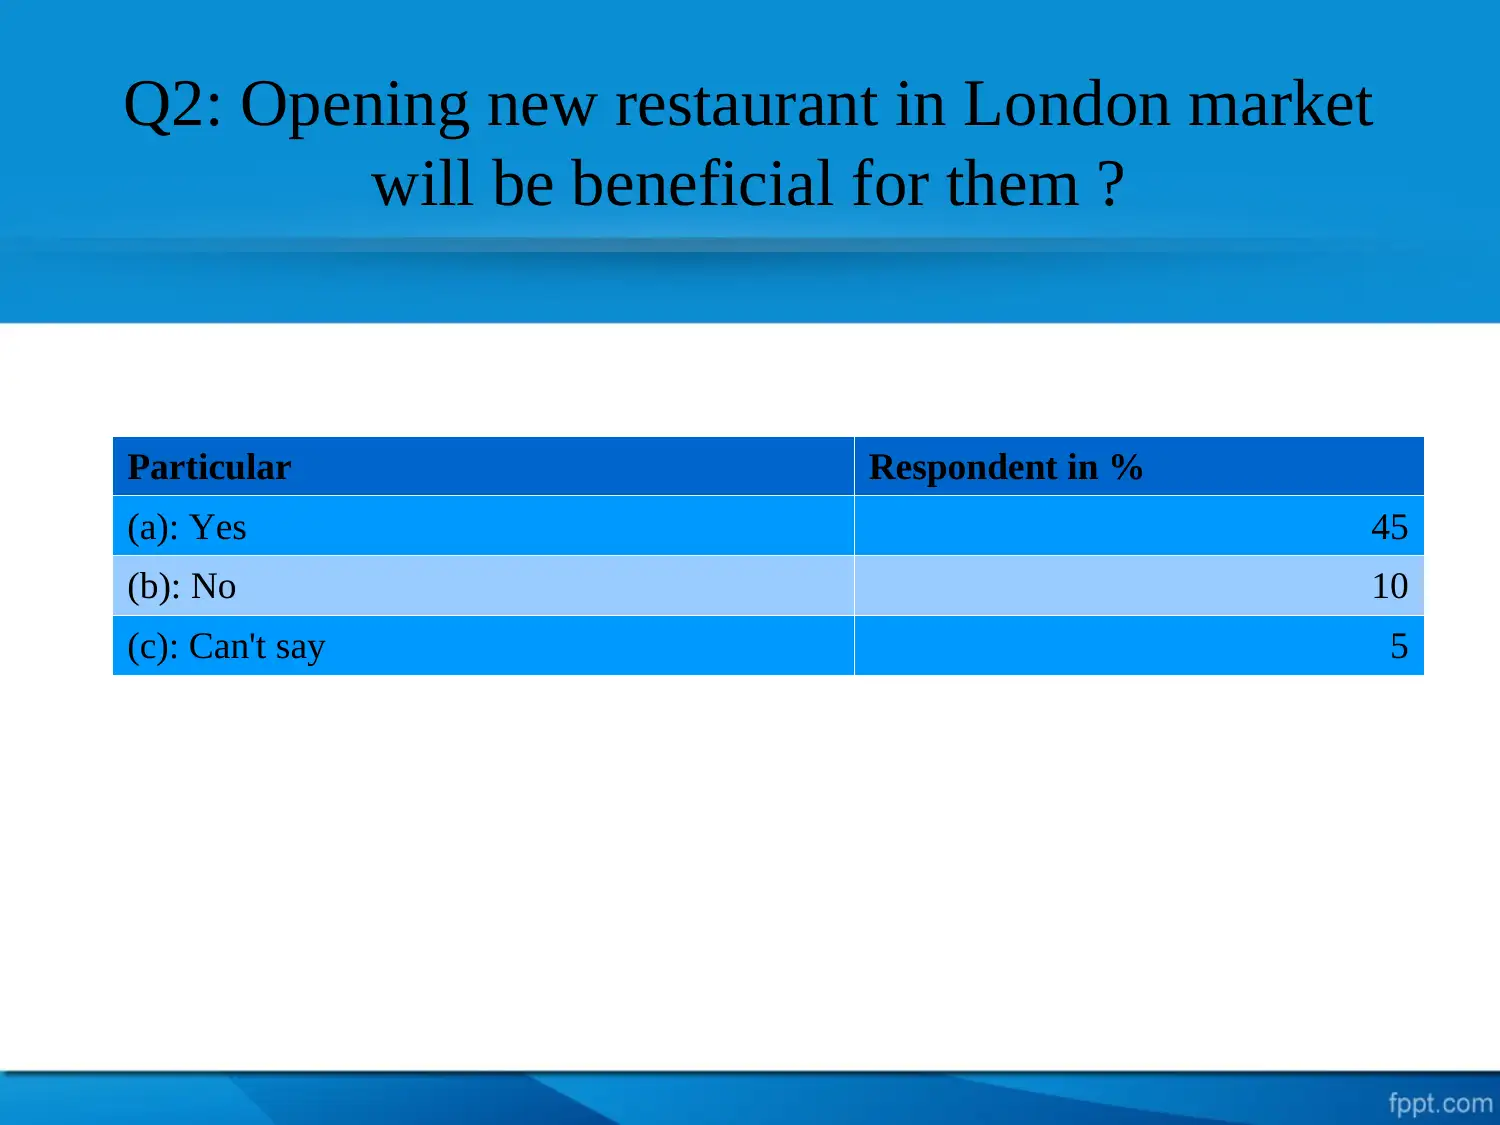
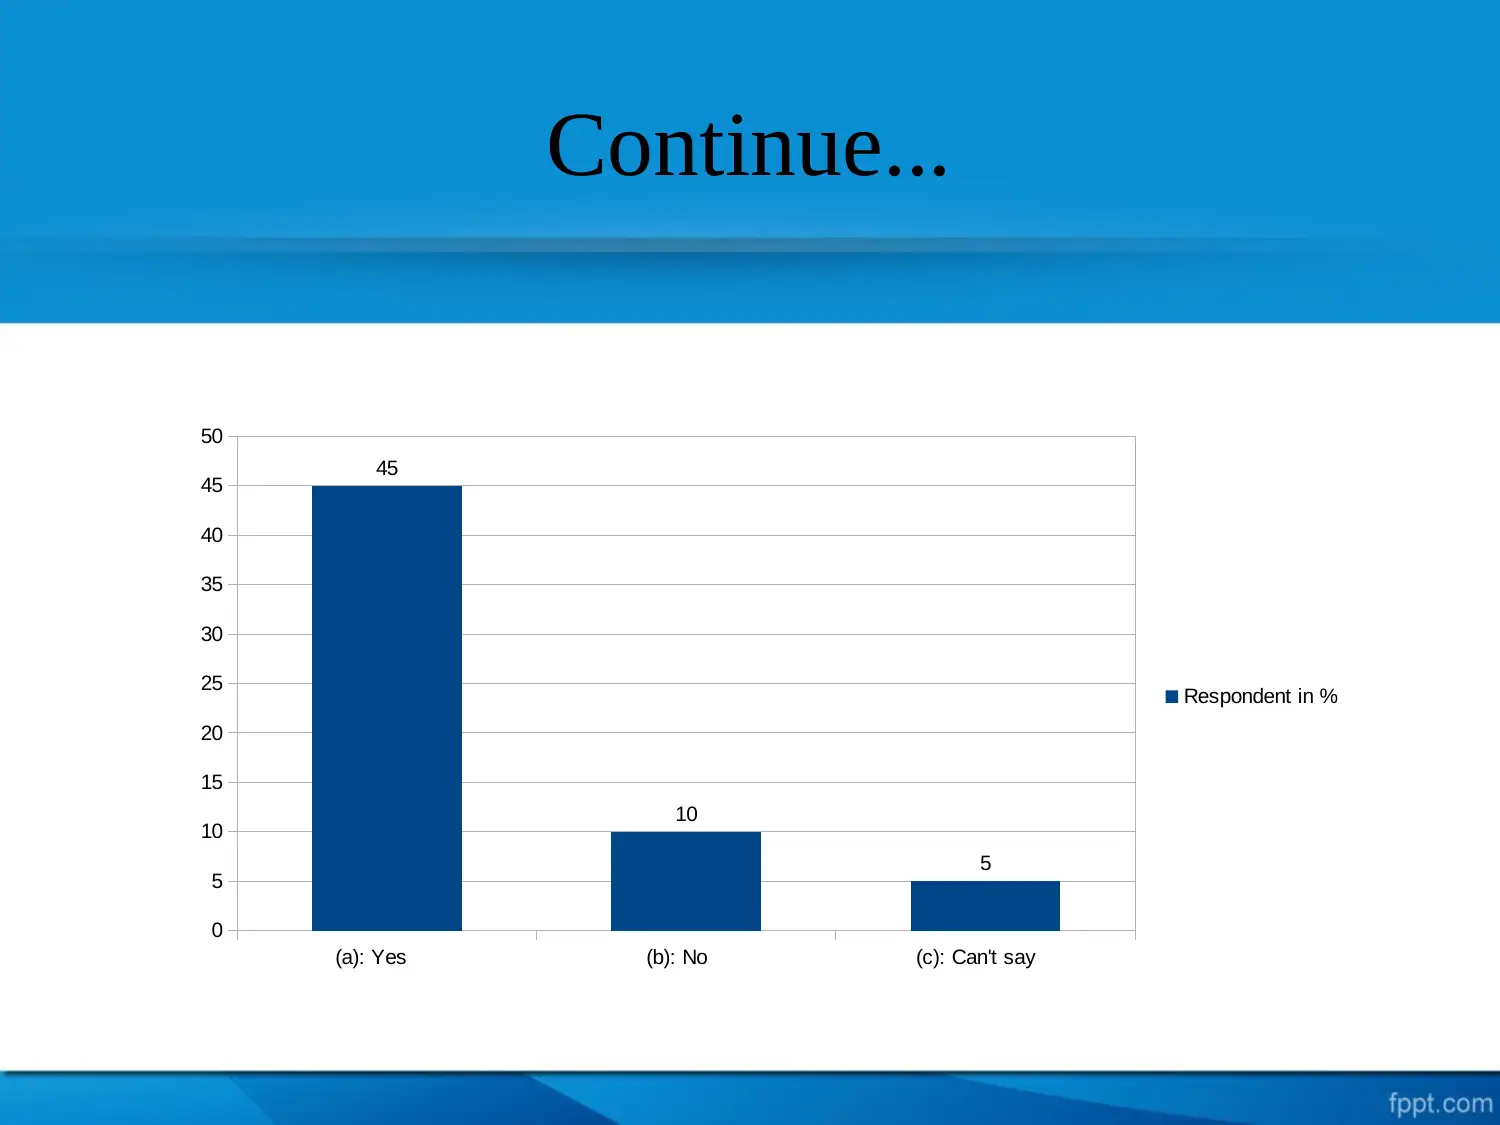
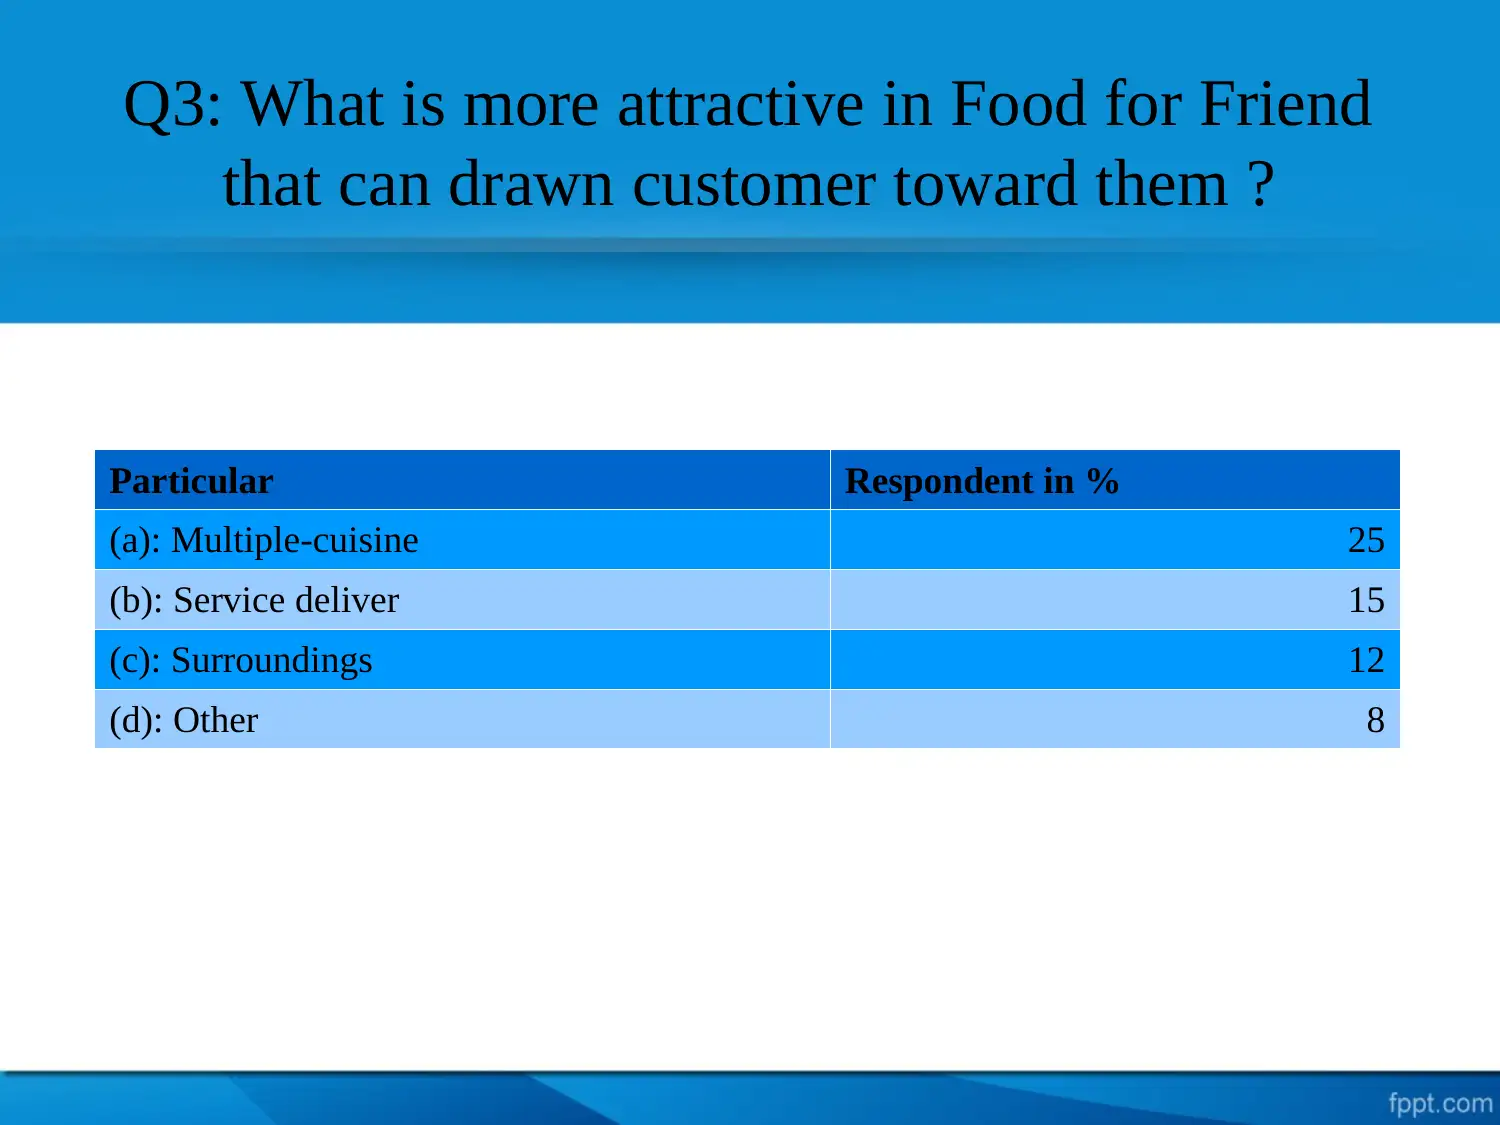
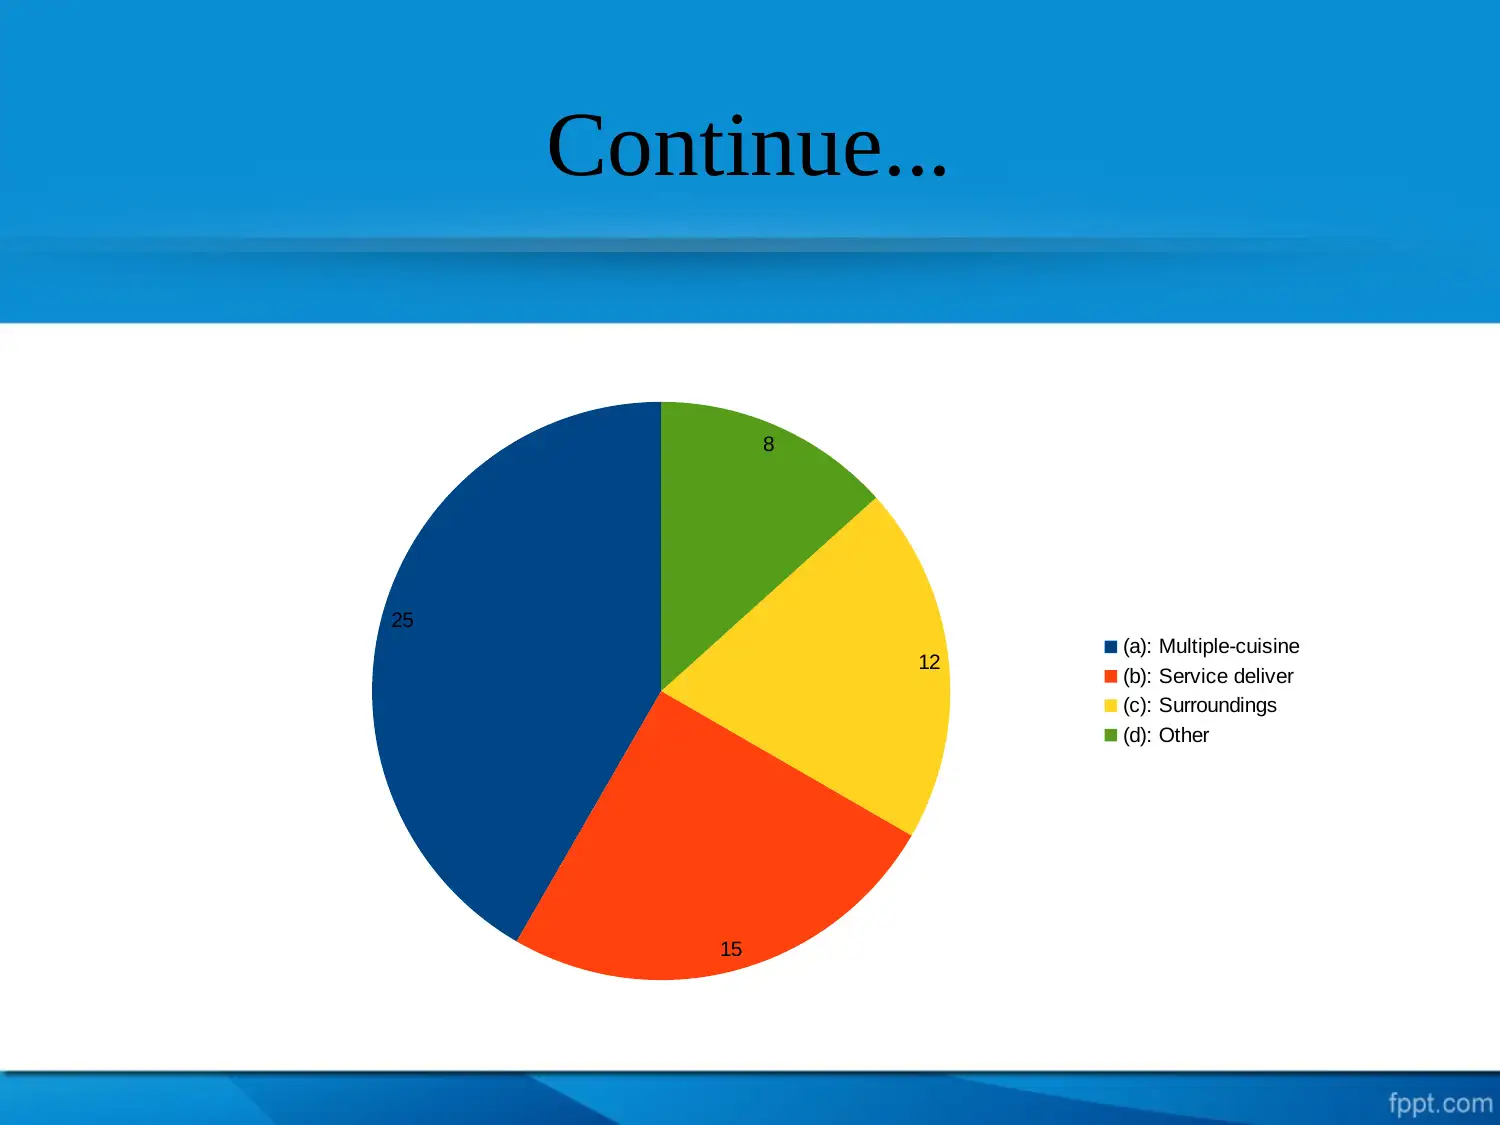
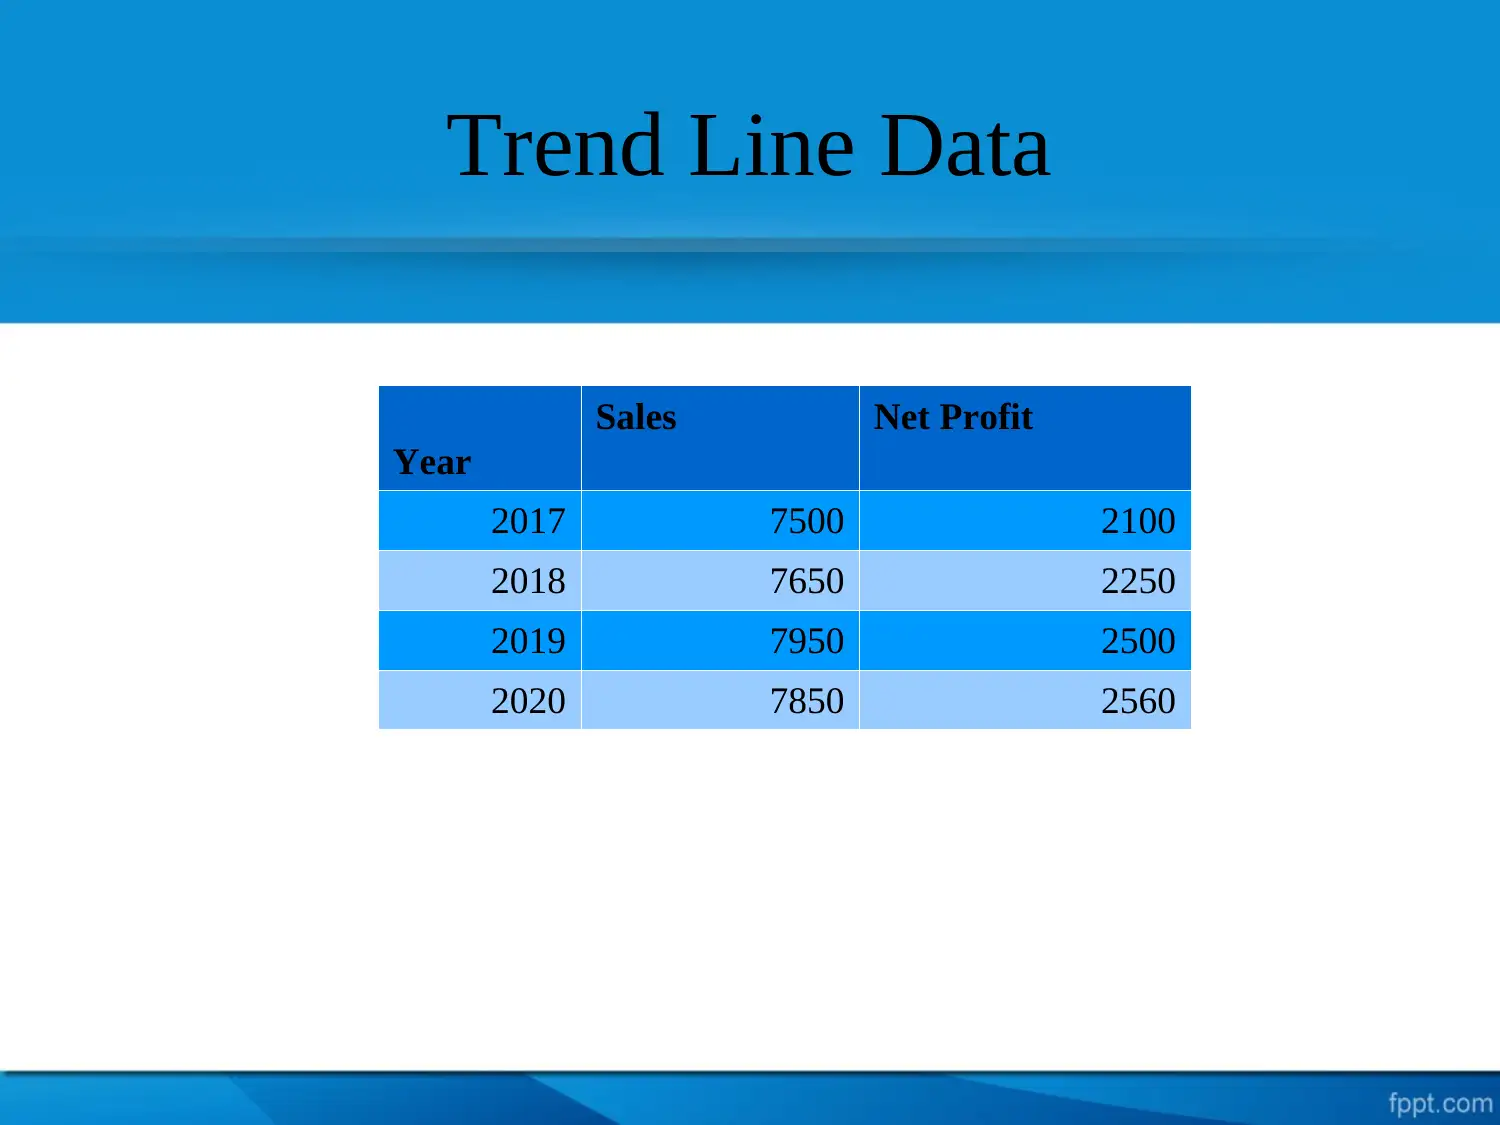
This report delves into the business decision-making process for Food for Friend Restaurant, focusing on customer experience and market analysis. It outlines the objectives of understanding customer reviews and experiences through descriptive research methods, utilizing random sampling with 60 respondents. The report interprets data presented in charts and graphs to identify the impact of customer feedback. Key findings reveal increasing customer numbers and affordability, while suggesting improvements to the online booking system and the introduction of diverse cuisines. Trend line analysis is used to estimate future profits. The conclusion emphasizes the importance of business decisions in analyzing research results and the role of charts in understanding growth impacts. The analysis incorporates external references to support its findings and recommendations.
Document Page
BUSINESS DECISION MAKING
Task 3.3
tabler-icon-diamond-filled.svg

Paraphrase This Document

Need a fresh take? Get an instant paraphrase of this document with our AI Paraphraser
Document Page
Cover Content
Introduction
Objectives
Research methodology
Data Interpretation
Trend line
Findings
Suggestions
Conclusion
References
Document Page
Introduction
Business decision is an essential aspects for every
researchers to analyse impacts of data those are collected
from various customers. Understanding of various sources of
data collection methods in a specific research about Food for
Friend restaurant.
Document Page
Objective
The main objectives of conducting this research is to
collected various information about customers experience
and reviews those are visiting to the restaurant.
tabler-icon-diamond-filled.svg

Paraphrase This Document

Need a fresh take? Get an instant paraphrase of this document with our AI Paraphraser
Document Page
The Descriptive methods is being used in order to make
research more specific.
By the use of random sampling with 60 respondents the data is
been collected.
Various types of charts and graphs is been use in order to
identify impacts of customers reviews.
Document Page
Data interpretation
Q1: Do you regularly visiting to Food for Friend
restaurant?
Particular
Respondent in %
(a): Yes 40
(b): No 20
Total 60
Mean 30
Median 30
Mode 0
Document Page
Continue...
(a): Yes (b): No
0
5
10
15
20
25
30
35
40
45
40
20 Respondent in %
tabler-icon-diamond-filled.svg

Paraphrase This Document

Need a fresh take? Get an instant paraphrase of this document with our AI Paraphraser
Document Page
Q2: Opening new restaurant in London market
will be beneficial for them ?
Particular Respondent in %
(a): Yes 45
(b): No 10
(c): Can't say 5
Document Page
Continue...
(a): Yes (b): No (c): Can't say
0
5
10
15
20
25
30
35
40
45
50
45
10
5
Respondent in %
Document Page
Q3: What is more attractive in Food for Friend
that can drawn customer toward them ?
Particular Respondent in %
(a): Multiple-cuisine 25
(b): Service deliver 15
(c): Surroundings 12
(d): Other 8
tabler-icon-diamond-filled.svg

Paraphrase This Document

Need a fresh take? Get an instant paraphrase of this document with our AI Paraphraser
Document Page
Continue...
25
15
12
8
(a): Multiple-cuisine
(b): Service deliver
(c): Surroundings
(d): Other
Document Page
Trend Line Data
Year
Sales Net Profit
2017 7500 2100
2018 7650 2250
2019 7950 2500
2020 7850 2560
chevron_up_icon
1 out of 18
circle_padding
hide_on_mobile
zoom_out_icon
[object Object]