Business Decision Making Project Report: Food for Friends Analysis
VerifiedAdded on 2020/01/28
|17
|4627
|62
Project
AI Summary
This project analyzes the business decision-making process for 'Food for Friends,' a vegetarian restaurant. It begins with data collection methods, including primary and secondary sources, and then details survey methodology, questionnaire design, and sampling techniques. The project summarizes the collected data, calculating measures of central tendency (mean, median, mode) and dispersion. Statistical analysis includes quartile, percentile, and correlation coefficient calculations to gain insights into consumer preferences and market trends. Graphical representations and trend lines are used to visualize the data. The assignment concludes with a project plan, critical path analysis for effective time management, and financial calculations to support the business decisions for the restaurant.
Business Decision Making
Paraphrase This Document
Need a fresh take? Get an instant paraphrase of this document with our AI Paraphraser
Table of Contents
INTRODUCTION...........................................................................................................................3
TASK 1............................................................................................................................................3
1.1 Data collection..................................................................................................................3
1.2 Survey methodology.........................................................................................................4
1.3 Questionnaire....................................................................................................................5
TASK 2............................................................................................................................................6
2.1 Summarising data.............................................................................................................6
2.2 Calculation based on mean, median and mode................................................................8
2.3 Measure if dispersion.......................................................................................................9
2.4 Calculation of quartile, percentile and correlation coefficient......................................10
TASK 3..........................................................................................................................................10
3.1 Graphical representation.................................................................................................10
3.2 Trend line........................................................................................................................12
3.3 Covered in PPT...............................................................................................................13
3.4 Formal report..................................................................................................................13
TASK 4..........................................................................................................................................14
4.1 Use of information processing tool................................................................................14
4.2 Preparation of project plan and critical path for effective time management................14
4.3 Calculation for the project..............................................................................................15
CONCLUSION..............................................................................................................................16
REFERENCES..............................................................................................................................17
INTRODUCTION
The employees of the firm have to make the correct and appropriate decision to do the
market research so that they can do the proper analysis of the market and identify the needs and
wants of the consumers (Hodges and Wu, 2010). The staff members of the business entity have
to collect the data or information by using the different sources whether it is primary or
secondary so that they can not face any obstacles in providing the best products and services and
on the basis of that they have to make the proper judgement. The present assignment is based on
food for friends which is a vegetarian restaurant which serve then innovative dishes as well as
offering the seasonal set menus (Quartiles, percentiles and correlation coefficients, 2017). In the
below mentioned reports, discussion on the data collection by using the different sources. Along
with this different processing tools and techniques which aid in gathering information has to be
discussed.
TASK 1
1.1 Data collection
The managers of business entity needs to do proper research so that they can collect the
accurate data by using the different sources. Two type of sources which includes:
Primary source: By using this source they can collect or gather the first hand information
and they can use that information in providing the services so that they can attain the goals and
objectives. It provides the direct or first hand evidence which are related to event, object, person
etc. It also includes the historical as well as legal documents, results of experiments etc. There
are four type of marketing research which are:
Observation: The employees can collect the information or data by observing the
consumers and take the action on their behaviours.
Interview: They are just like the focus groups and in this interaction between the
consumers are to be done. They have to take face to face, telephonic interview and collect
the information (Kingsley and et. al., 2012).
Questionnaire: The employees of food for friends can make the questionnaire which
includes the different questions and filled by the consumers so that they can gather the
actual data and used in providing the services to their consumers.
⊘ This is a preview!⊘
Do you want full access?
Subscribe today to unlock all pages.
Trusted by 1+ million students worldwide
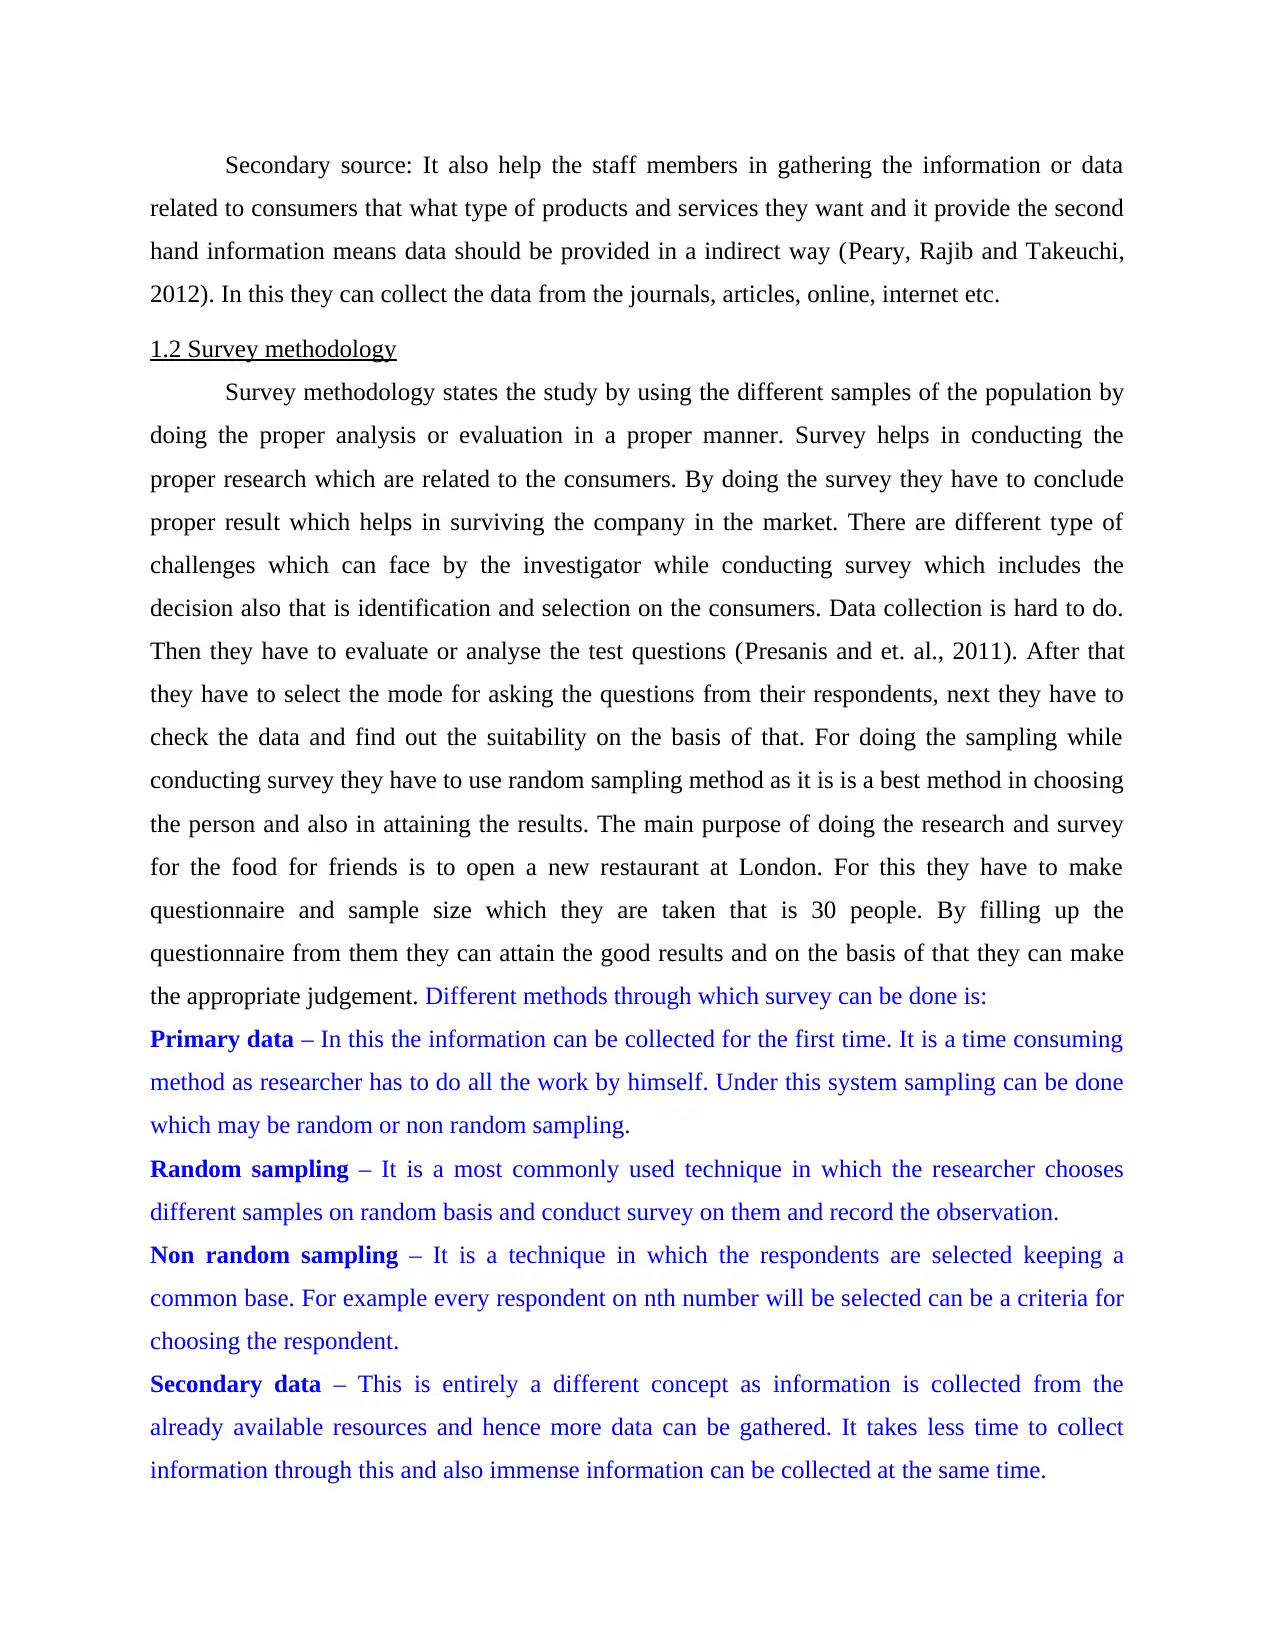
Secondary source: It also help the staff members in gathering the information or data
related to consumers that what type of products and services they want and it provide the second
hand information means data should be provided in a indirect way (Peary, Rajib and Takeuchi,
2012). In this they can collect the data from the journals, articles, online, internet etc.
1.2 Survey methodology
Survey methodology states the study by using the different samples of the population by
doing the proper analysis or evaluation in a proper manner. Survey helps in conducting the
proper research which are related to the consumers. By doing the survey they have to conclude
proper result which helps in surviving the company in the market. There are different type of
challenges which can face by the investigator while conducting survey which includes the
decision also that is identification and selection on the consumers. Data collection is hard to do.
Then they have to evaluate or analyse the test questions (Presanis and et. al., 2011). After that
they have to select the mode for asking the questions from their respondents, next they have to
check the data and find out the suitability on the basis of that. For doing the sampling while
conducting survey they have to use random sampling method as it is is a best method in choosing
the person and also in attaining the results. The main purpose of doing the research and survey
for the food for friends is to open a new restaurant at London. For this they have to make
questionnaire and sample size which they are taken that is 30 people. By filling up the
questionnaire from them they can attain the good results and on the basis of that they can make
the appropriate judgement. Different methods through which survey can be done is:
Primary data – In this the information can be collected for the first time. It is a time consuming
method as researcher has to do all the work by himself. Under this system sampling can be done
which may be random or non random sampling.
Random sampling – It is a most commonly used technique in which the researcher chooses
different samples on random basis and conduct survey on them and record the observation.
Non random sampling – It is a technique in which the respondents are selected keeping a
common base. For example every respondent on nth number will be selected can be a criteria for
choosing the respondent.
Secondary data – This is entirely a different concept as information is collected from the
already available resources and hence more data can be gathered. It takes less time to collect
information through this and also immense information can be collected at the same time.
Paraphrase This Document
Need a fresh take? Get an instant paraphrase of this document with our AI Paraphraser
1.3 Questionnaire
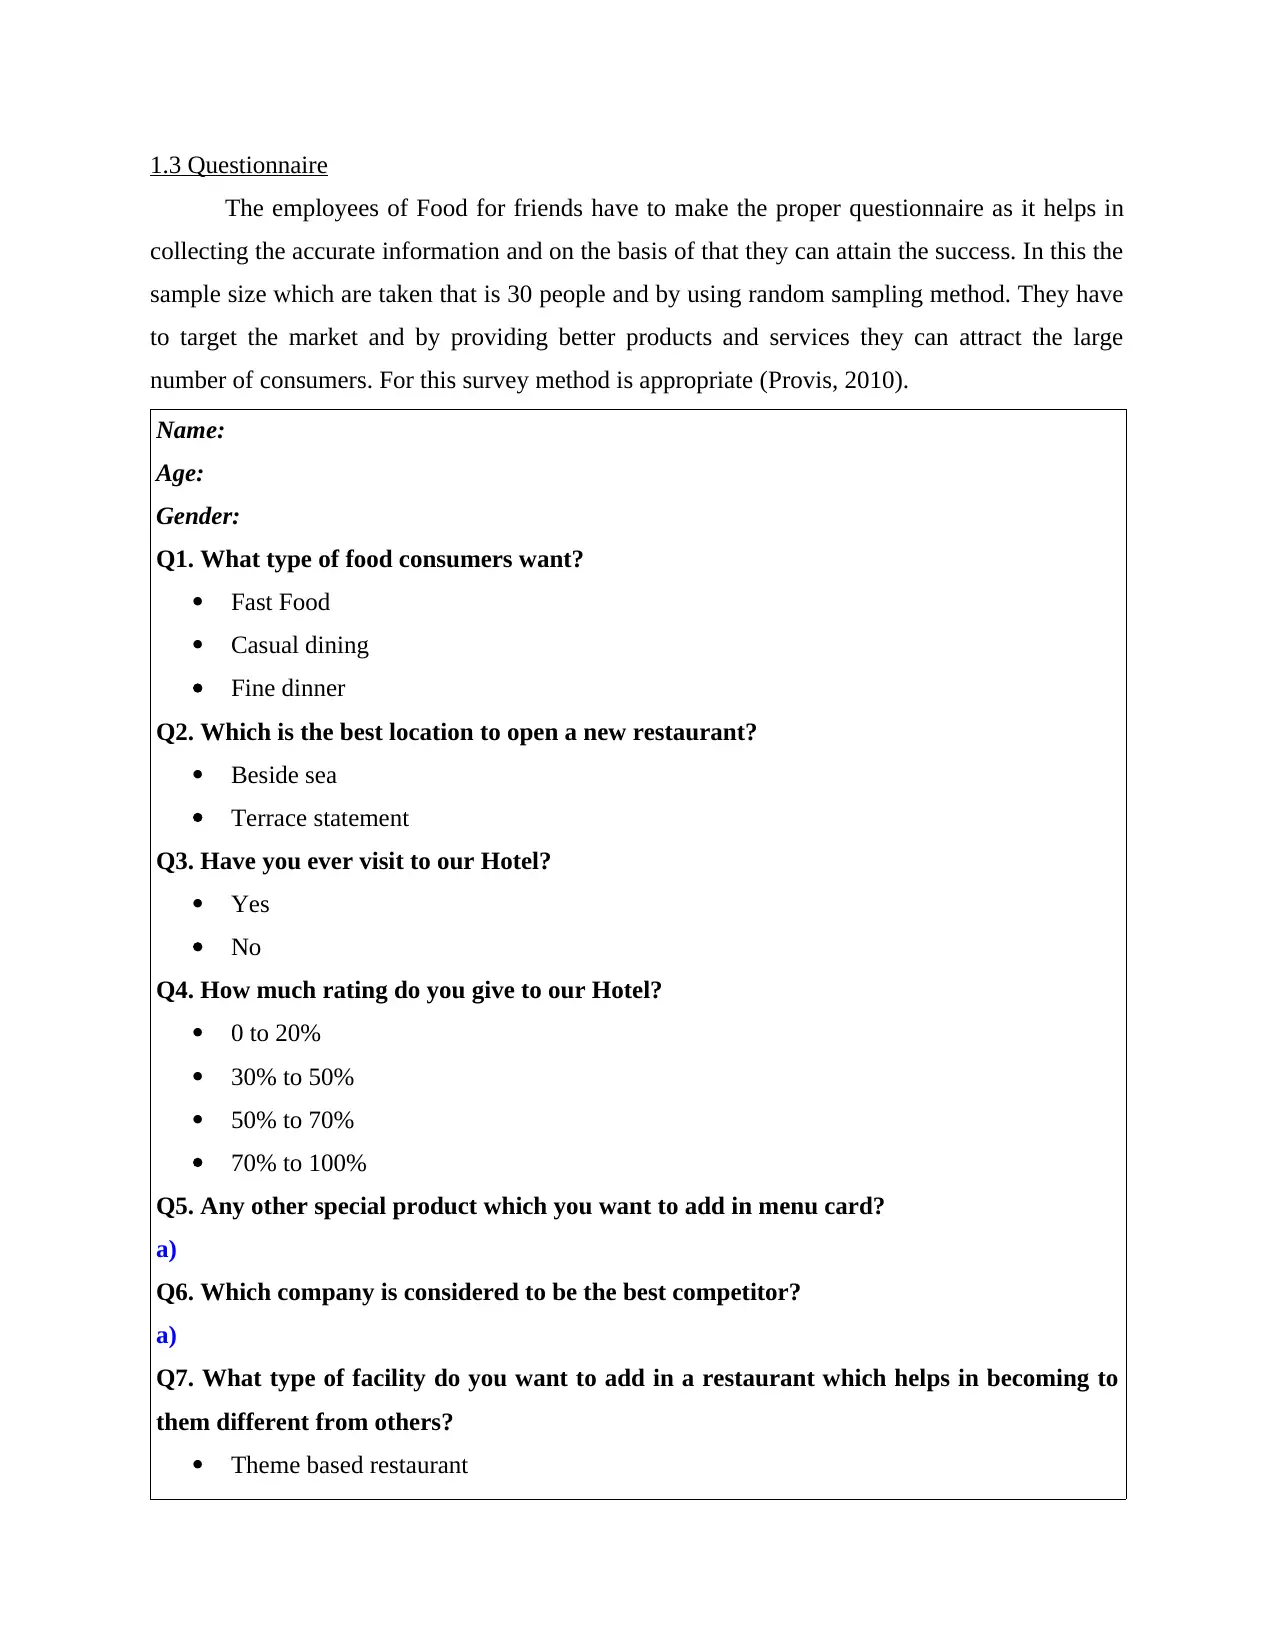
The employees of Food for friends have to make the proper questionnaire as it helps in
collecting the accurate information and on the basis of that they can attain the success. In this the
sample size which are taken that is 30 people and by using random sampling method. They have
to target the market and by providing better products and services they can attract the large
number of consumers. For this survey method is appropriate (Provis, 2010).
Name:
Age:
Gender:
Q1. What type of food consumers want?
Fast Food
Casual dining
Fine dinner
Q2. Which is the best location to open a new restaurant?
Beside sea
Terrace statement
Q3. Have you ever visit to our Hotel?
Yes
No
Q4. How much rating do you give to our Hotel?
0 to 20%
30% to 50%
50% to 70%
70% to 100%
Q5. Any other special product which you want to add in menu card?
a)
Q6. Which company is considered to be the best competitor?
a)
Q7. What type of facility do you want to add in a restaurant which helps in becoming to
them different from others?
Theme based restaurant
Simple like others
Q8. Suggest a range of products?
Between £10 to 20
More than £20
Any other suggestion
Q9. Please rate our services?
Excellent
Good
Very good
Not so much appropriate
Q10. Which variety of product do you like of our competitor?
a)
Q11. Any recommendations? If necessary?
TASK 2
2.1 Summarising data
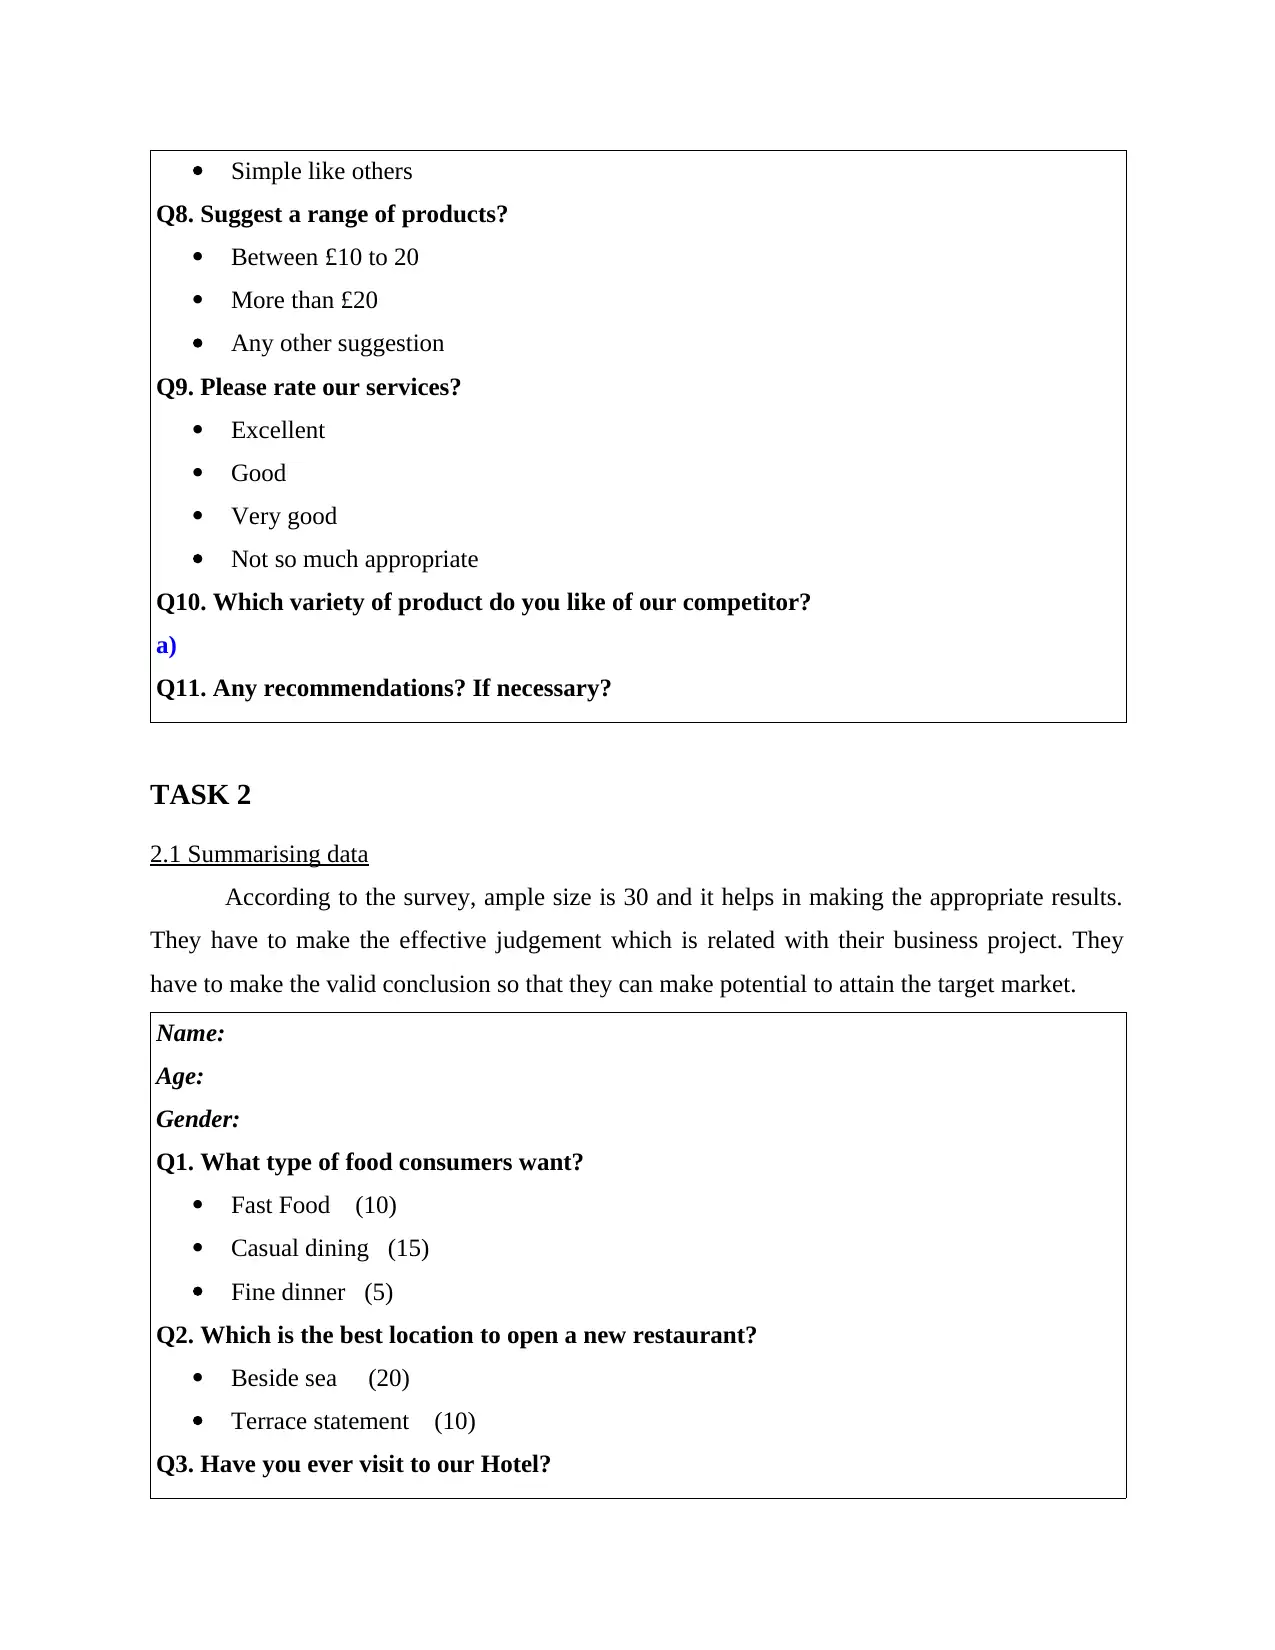
According to the survey, ample size is 30 and it helps in making the appropriate results.
They have to make the effective judgement which is related with their business project. They
have to make the valid conclusion so that they can make potential to attain the target market.
Name:
Age:
Gender:
Q1. What type of food consumers want?
Fast Food (10)
Casual dining (15)
Fine dinner (5)
Q2. Which is the best location to open a new restaurant?
Beside sea (20)
Terrace statement (10)
Q3. Have you ever visit to our Hotel?
Q8. Suggest a range of products?
Between £10 to 20
More than £20
Any other suggestion
Q9. Please rate our services?
Excellent
Good
Very good
Not so much appropriate
Q10. Which variety of product do you like of our competitor?
a)
Q11. Any recommendations? If necessary?
TASK 2
2.1 Summarising data
According to the survey, ample size is 30 and it helps in making the appropriate results.
They have to make the effective judgement which is related with their business project. They
have to make the valid conclusion so that they can make potential to attain the target market.
Name:
Age:
Gender:
Q1. What type of food consumers want?
Fast Food (10)
Casual dining (15)
Fine dinner (5)
Q2. Which is the best location to open a new restaurant?
Beside sea (20)
Terrace statement (10)
Q3. Have you ever visit to our Hotel?
⊘ This is a preview!⊘
Do you want full access?
Subscribe today to unlock all pages.
Trusted by 1+ million students worldwide
Yes (18)
No (12)
Q4. How much rating do you give to our Hotel?
0 to 20% (2)
30% to 50% (6)
50% to 70% (10)
70% to 100% (12)
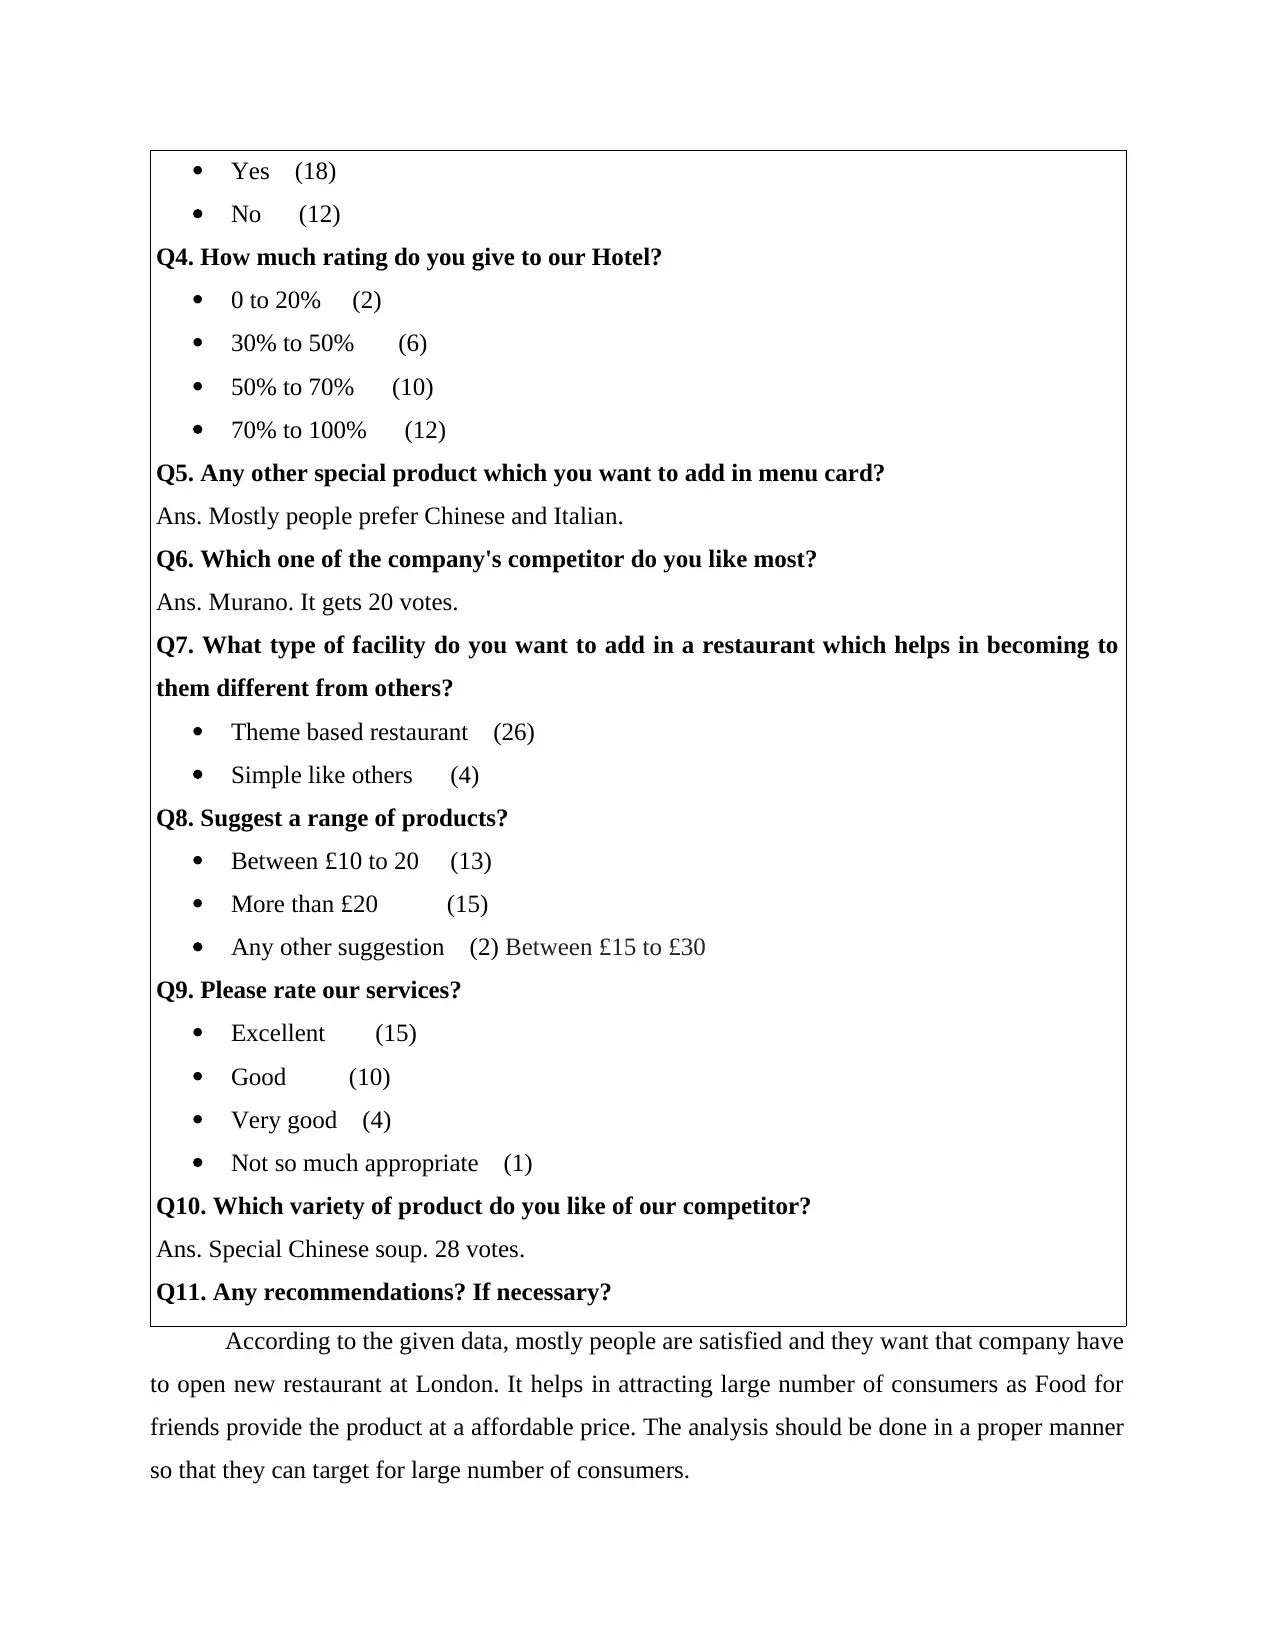
Q5. Any other special product which you want to add in menu card?
Ans. Mostly people prefer Chinese and Italian.
Q6. Which one of the company's competitor do you like most?
Ans. Murano. It gets 20 votes.
Q7. What type of facility do you want to add in a restaurant which helps in becoming to
them different from others?
Theme based restaurant (26)
Simple like others (4)
Q8. Suggest a range of products?
Between £10 to 20 (13)
More than £20 (15)
Any other suggestion (2) Between £15 to £30
Q9. Please rate our services?
Excellent (15)
Good (10)
Very good (4)
Not so much appropriate (1)
Q10. Which variety of product do you like of our competitor?
Ans. Special Chinese soup. 28 votes.
Q11. Any recommendations? If necessary?
According to the given data, mostly people are satisfied and they want that company have
to open new restaurant at London. It helps in attracting large number of consumers as Food for
friends provide the product at a affordable price. The analysis should be done in a proper manner
so that they can target for large number of consumers.
No (12)
Q4. How much rating do you give to our Hotel?
0 to 20% (2)
30% to 50% (6)
50% to 70% (10)
70% to 100% (12)
Q5. Any other special product which you want to add in menu card?
Ans. Mostly people prefer Chinese and Italian.
Q6. Which one of the company's competitor do you like most?
Ans. Murano. It gets 20 votes.
Q7. What type of facility do you want to add in a restaurant which helps in becoming to
them different from others?
Theme based restaurant (26)
Simple like others (4)
Q8. Suggest a range of products?
Between £10 to 20 (13)
More than £20 (15)
Any other suggestion (2) Between £15 to £30
Q9. Please rate our services?
Excellent (15)
Good (10)
Very good (4)
Not so much appropriate (1)
Q10. Which variety of product do you like of our competitor?
Ans. Special Chinese soup. 28 votes.
Q11. Any recommendations? If necessary?
According to the given data, mostly people are satisfied and they want that company have
to open new restaurant at London. It helps in attracting large number of consumers as Food for
friends provide the product at a affordable price. The analysis should be done in a proper manner
so that they can target for large number of consumers.
Paraphrase This Document
Need a fresh take? Get an instant paraphrase of this document with our AI Paraphraser
2.2 Calculation based on mean, median and mode
Year Sales Net Profit
2008 3210 1100
2009 3650 1252
2010 4521 1524
2011 5313 1620
2012 5750 1750
2013 6150 1821
2014 6258 1950
2015 6420 1754
2016 5980 1947
2017 6540 2187
Sales Net profit
Mean 5379.2 1690.5
Median 5865 1752
mode 3210 1100
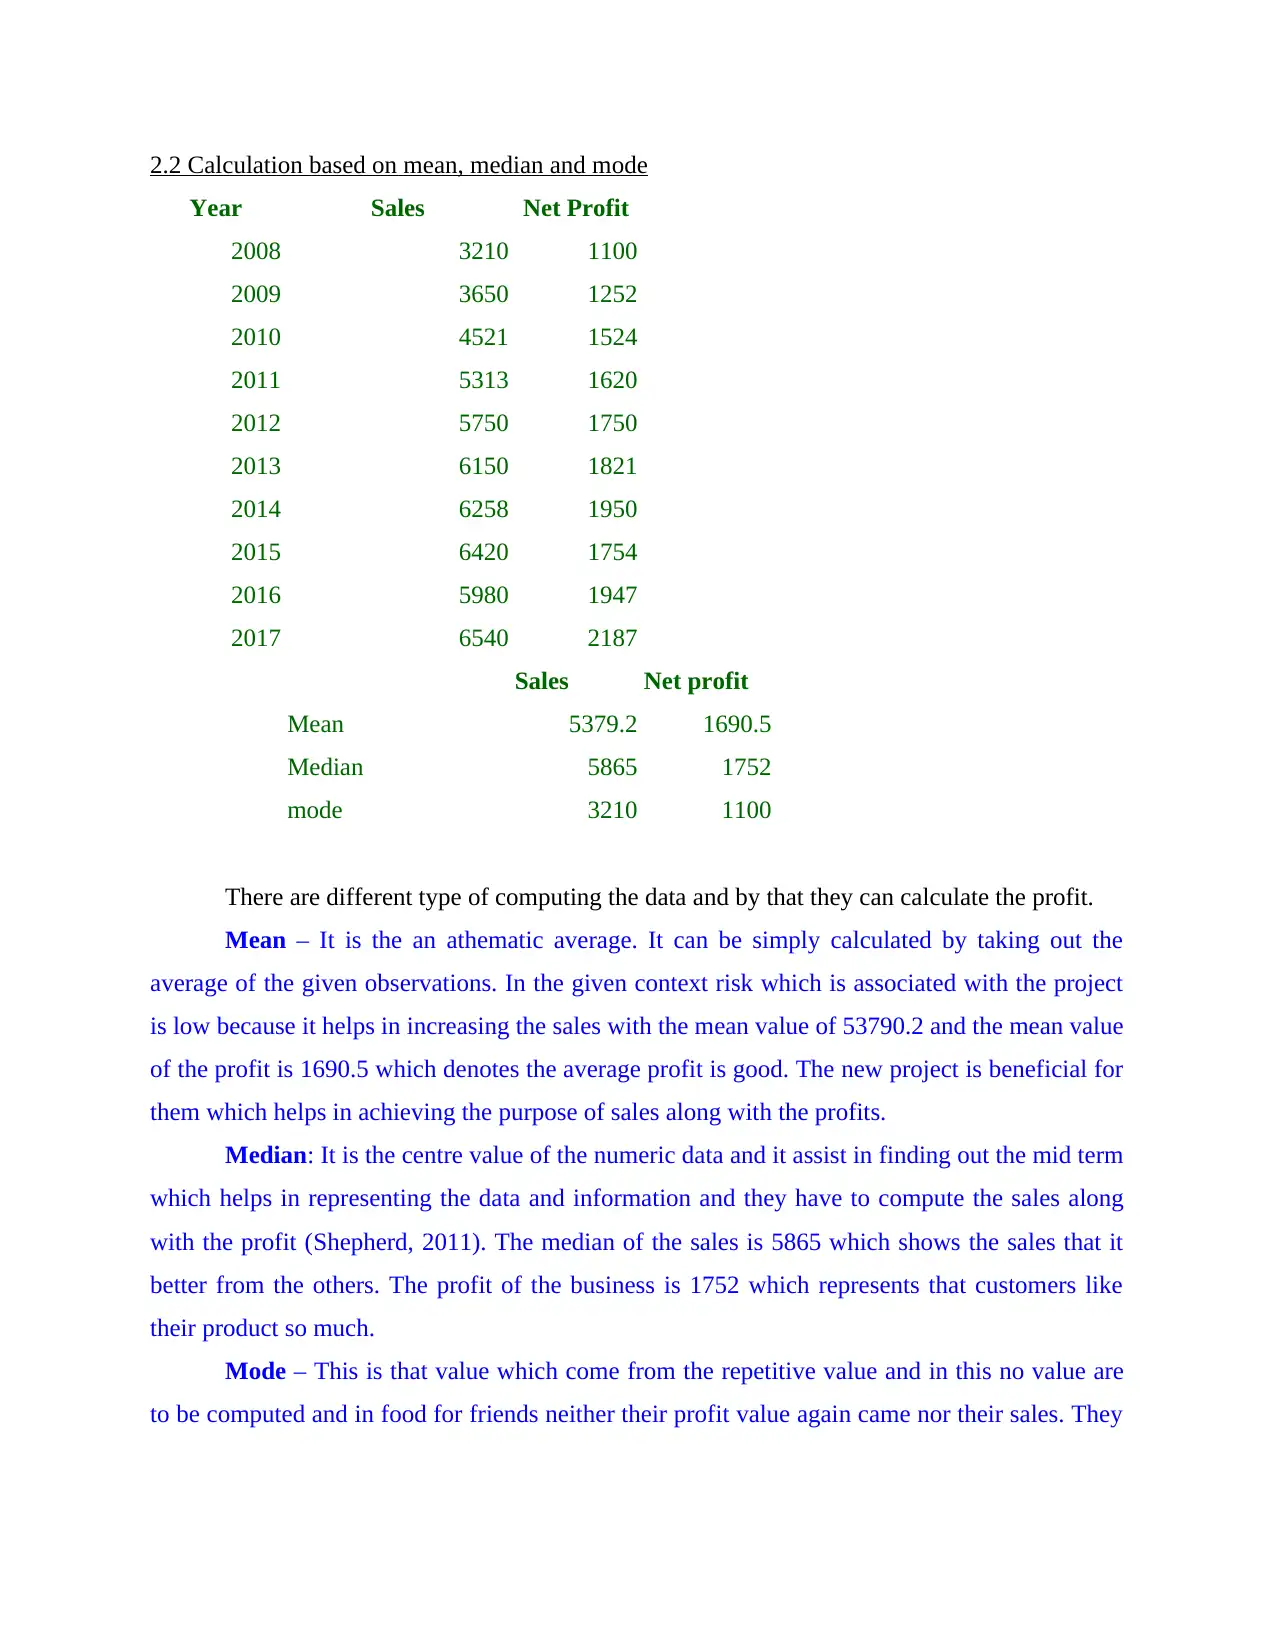
There are different type of computing the data and by that they can calculate the profit.
Mean – It is the an athematic average. It can be simply calculated by taking out the
average of the given observations. In the given context risk which is associated with the project
is low because it helps in increasing the sales with the mean value of 53790.2 and the mean value
of the profit is 1690.5 which denotes the average profit is good. The new project is beneficial for
them which helps in achieving the purpose of sales along with the profits.
Median: It is the centre value of the numeric data and it assist in finding out the mid term
which helps in representing the data and information and they have to compute the sales along
with the profit (Shepherd, 2011). The median of the sales is 5865 which shows the sales that it
better from the others. The profit of the business is 1752 which represents that customers like
their product so much.
Mode – This is that value which come from the repetitive value and in this no value are
to be computed and in food for friends neither their profit value again came nor their sales. They
Year Sales Net Profit
2008 3210 1100
2009 3650 1252
2010 4521 1524
2011 5313 1620
2012 5750 1750
2013 6150 1821
2014 6258 1950
2015 6420 1754
2016 5980 1947
2017 6540 2187
Sales Net profit
Mean 5379.2 1690.5
Median 5865 1752
mode 3210 1100
There are different type of computing the data and by that they can calculate the profit.
Mean – It is the an athematic average. It can be simply calculated by taking out the
average of the given observations. In the given context risk which is associated with the project
is low because it helps in increasing the sales with the mean value of 53790.2 and the mean value
of the profit is 1690.5 which denotes the average profit is good. The new project is beneficial for
them which helps in achieving the purpose of sales along with the profits.
Median: It is the centre value of the numeric data and it assist in finding out the mid term
which helps in representing the data and information and they have to compute the sales along
with the profit (Shepherd, 2011). The median of the sales is 5865 which shows the sales that it
better from the others. The profit of the business is 1752 which represents that customers like
their product so much.
Mode – This is that value which come from the repetitive value and in this no value are
to be computed and in food for friends neither their profit value again came nor their sales. They
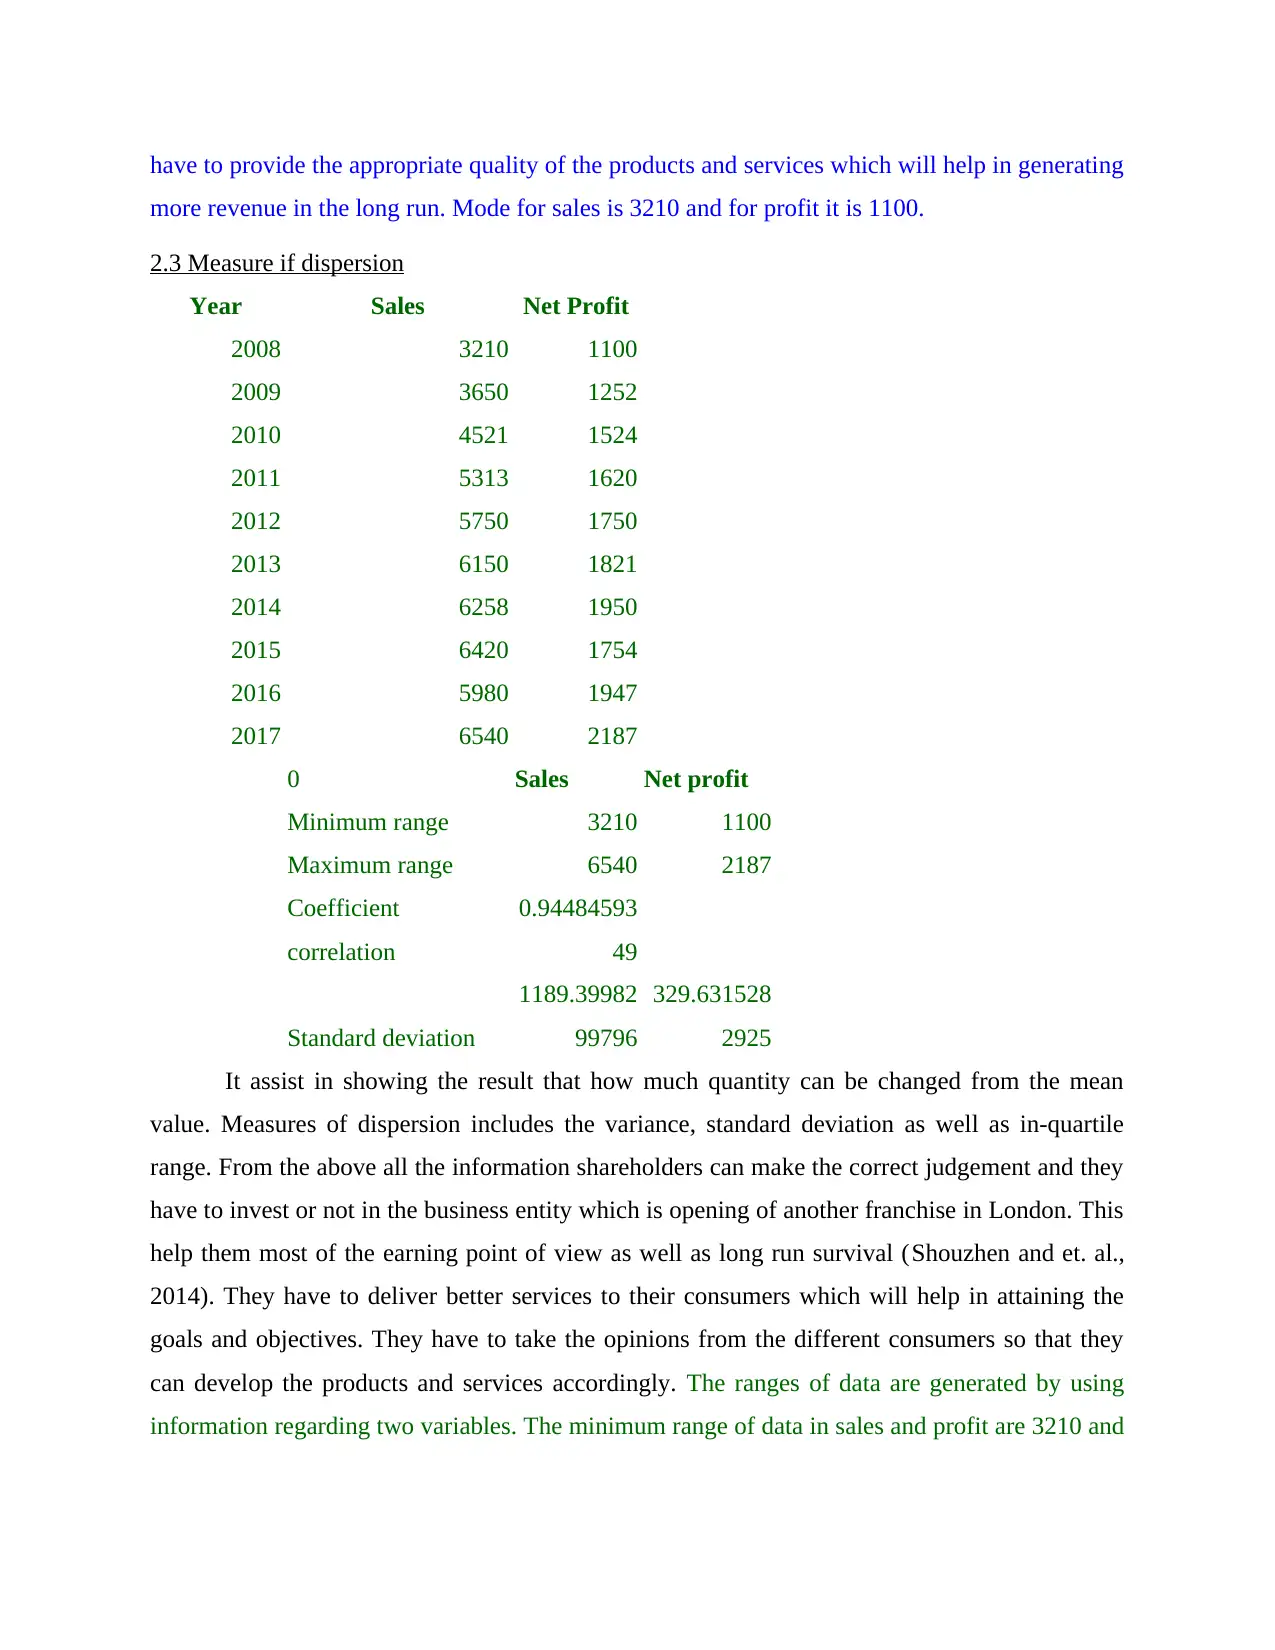
have to provide the appropriate quality of the products and services which will help in generating
more revenue in the long run. Mode for sales is 3210 and for profit it is 1100.
2.3 Measure if dispersion
Year Sales Net Profit
2008 3210 1100
2009 3650 1252
2010 4521 1524
2011 5313 1620
2012 5750 1750
2013 6150 1821
2014 6258 1950
2015 6420 1754
2016 5980 1947
2017 6540 2187
0 Sales Net profit
Minimum range 3210 1100
Maximum range 6540 2187
Coefficient
correlation
0.94484593
49
Standard deviation
1189.39982
99796
329.631528
2925
It assist in showing the result that how much quantity can be changed from the mean
value. Measures of dispersion includes the variance, standard deviation as well as in-quartile
range. From the above all the information shareholders can make the correct judgement and they
have to invest or not in the business entity which is opening of another franchise in London. This
help them most of the earning point of view as well as long run survival (Shouzhen and et. al.,
2014). They have to deliver better services to their consumers which will help in attaining the
goals and objectives. They have to take the opinions from the different consumers so that they
can develop the products and services accordingly. The ranges of data are generated by using
information regarding two variables. The minimum range of data in sales and profit are 3210 and
⊘ This is a preview!⊘
Do you want full access?
Subscribe today to unlock all pages.
Trusted by 1+ million students worldwide
1100 respectively. The maximum ranges from collected sales and profit are 6540 and 2187
respectively.
Standard deviation = It is tool which shows how numbers of a set are spread out. Through
this it can be analyse that what is the degree of deviation in the dispersion of observations and is
represented with a symbol of sigma.
According to the sales and net profit variance standard deviation is 1189 and 329
respectively it is necessary to determine right impact of outcome on the profitability position of
Food for friends.
2.4 Calculation of quartile, percentile and correlation coefficient
Quartile is the one which includes the three points which divide the information or data
into four parts. According to the data the result which attain that is:
1st quartile
2nd quartile
3rd quartile
Percentile: the number along with the value which represent the percentage position is a
list of data (Silva and et. al., 2011). According to the current scenario it represents the sales and
profit percentile of the company. Sales of 1st 2nd 3rd 4th represents the different percentile groups
whose outcomes. same as the profit percentile depicts that it has majorly four groups 25th
percentile, 50th percentile, 75th percentile and the last one is 100th percentile.
Correlation coefficients: It is refers as a statistical measurement that changes in relation
to two variables. If there is a positive correlation it means there is a parallel increase or decrease
among two sets of variables. In such situation in which the data is highly connected with each
other are having high correlation. The values under this situation are derived as:
+1 It means there is perfect correlation among those variables
-1 it states that a negative correlation.
0 means there is no any correlation exist.
Paraphrase This Document
Need a fresh take? Get an instant paraphrase of this document with our AI Paraphraser
From the above calculation, it has been seen that correlation from both sales and profit
are calculated as 0.94 which is less +1 and -1 so it is considered as zero. They is no correlation
exist between sales and profit.
TASK 3
3.1 Graphical representation
Year Sales Net Profit
2008 3210 1100
2009 3650 1252
2010 4521 1524
2011 5313 1620
2012 5750 1750
2013 6150 1821
2014 6258 1950
2015 6420 1754
2016 5980 1947
2017 6540 2187
Sales
1 2 3 4 5 6 7 8 9 10
0
1000
2000
3000
4000
5000
6000
7000
3210
3650
4521
5313
5750
6150 6258 6420
5980
6540
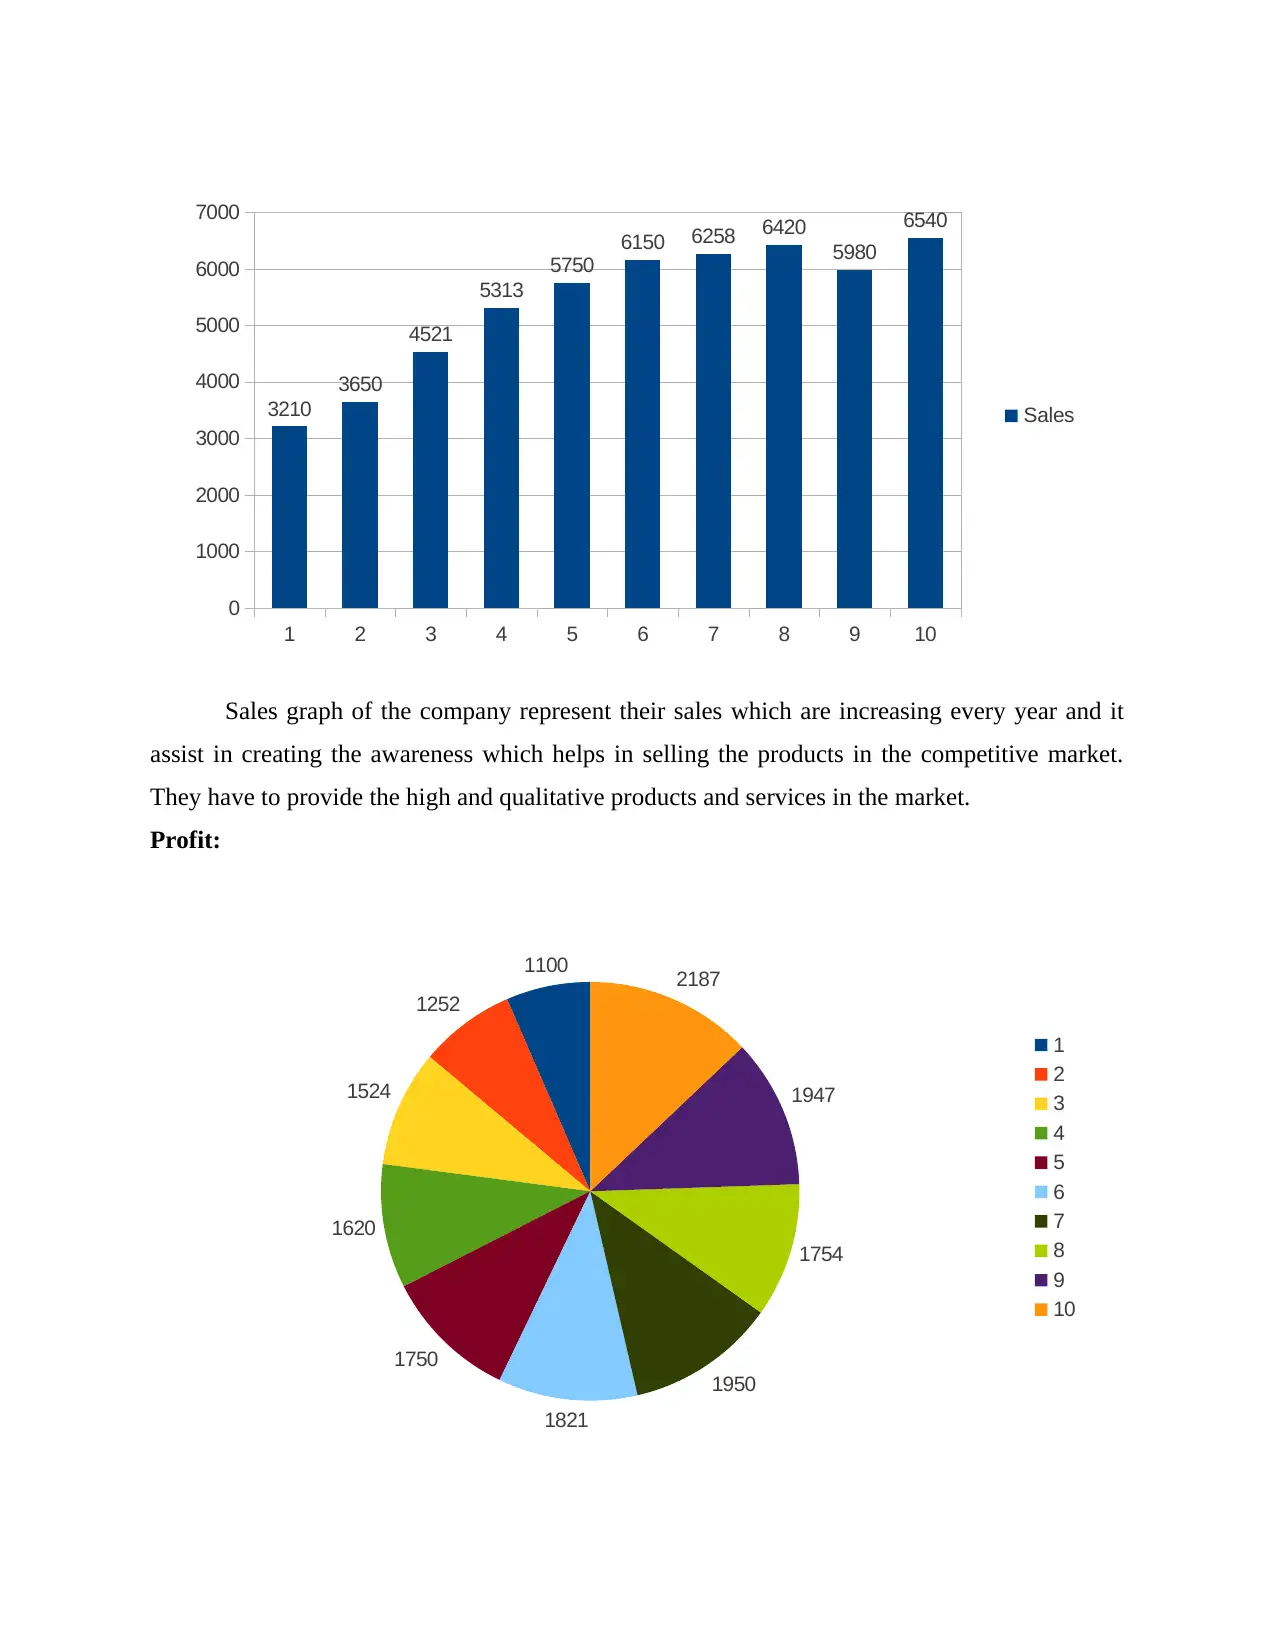
Sales
Sales graph of the company represent their sales which are increasing every year and it
assist in creating the awareness which helps in selling the products in the competitive market.
They have to provide the high and qualitative products and services in the market.
Profit:
1100
1252
1524
1620
1750
1821
1950
1754
1947
2187
1
2
3
4
5
6
7
8
9
10
0
1000
2000
3000
4000
5000
6000
7000
3210
3650
4521
5313
5750
6150 6258 6420
5980
6540
Sales
Sales graph of the company represent their sales which are increasing every year and it
assist in creating the awareness which helps in selling the products in the competitive market.
They have to provide the high and qualitative products and services in the market.
Profit:
1100
1252
1524
1620
1750
1821
1950
1754
1947
2187
1
2
3
4
5
6
7
8
9
10
⊘ This is a preview!⊘
Do you want full access?
Subscribe today to unlock all pages.
Trusted by 1+ million students worldwide
1 out of 17
Related Documents


Your All-in-One AI-Powered Toolkit for Academic Success.
+13062052269
info@desklib.com
Available 24*7 on WhatsApp / Email
![[object Object]](/_next/static/media/star-bottom.7253800d.svg)
Unlock your academic potential
Copyright © 2020–2026 A2Z Services. All Rights Reserved. Developed and managed by ZUCOL.