Food for Friends: Customer Feedback and Expansion Strategy Report
VerifiedAdded on 2020/07/22
|21
|4502
|27
Report
AI Summary
This report analyzes the potential expansion of Food for Friends, a UK-based restaurant, focusing on business decision-making processes. The report begins with the creation of a plan to assess customer feedback and market conditions in London. It utilizes both primary and secondary data sources, including questionnaires and surveys, to gather information about customer preferences and market trends. The analysis includes an examination of survey methodologies, sampling frameworks, and the construction of a questionnaire. The collected data is then analyzed using various statistical tools, such as mean, median, mode, range, standard deviation, and correlation. The report also covers the use of quartiles, percentiles, and correlation coefficients to interpret the data and derive meaningful conclusions regarding the viability of the expansion. Furthermore, the report includes a presentation of the findings, a trend line analysis, and a formal business report. Finally, the report discusses information processing tools, critical path analysis, and the application of financial tools in the decision-making process to assess the feasibility of the expansion plan.

BUSINESS DECISION
MAKING
MAKING
Paraphrase This Document
Need a fresh take? Get an instant paraphrase of this document with our AI Paraphraser

Table of Contents
INTRODUCTION...........................................................................................................................1
TASK 1............................................................................................................................................1
1.1 Creation of plan.....................................................................................................................1
1.2 Survey the methodology and sampling framing used...........................................................2
1.3 Questionnaire........................................................................................................................3
TASK 2............................................................................................................................................5
2.1 Analysis of the information.Yes, they are ............................................................................5
2.2 Evaluation of the results........................................................................................................8
2.3 Analaysis of information and different methods of dispersion.............................................9
2.4 Use of quartiles, percentiles and correlation cofficient.......................................................10
TASK 3..........................................................................................................................................10
3.1 Presentation and this provide information..........................................................................10
3.2 Trend line............................................................................................................................14
3.3 Covered in ppt.....................................................................................................................15
3.4 Formal busines report..........................................................................................................15
TASK 4..........................................................................................................................................16
4.1 Information processing tools...............................................................................................16
4.2 Analysis of critical path......................................................................................................17
4.3 Financial tools in the decision making................................................................................18
CONCLUSION..............................................................................................................................18
REFERENCES..............................................................................................................................19
Online:.......................................................................................................................................19
INTRODUCTION
Decision-making is that which is a important process which help in making a selection in
between the alternativesa available with them. Generally, selecting that decision which can
provide the better result to the company with certain hep like analysis of various investment
scenario by using tools like NPV and IRR (Aharoni, Tihanyi and Connelly, 2011). Even both the
tools are such which can help in determining the maximum return in better manner in
organsiation from different investments. The report is based on the food for friends which is a
restraunt in UK and provide various services like having Banquet hall for the wedding
sceanarios and many more things too. In this assignment various things will be included like
prmiar and secondars data to produce a plan, framing of samples and methodologies too.
Questionnaire, evaluation of information and use of different mehods with dispersion and having
a contribution with the quartile, percentiles and correlation which help in concluding the result.
Hence information tools are also used with the investment criteria and with the appraisal
techniques and their decision making too.
TASK 1
1.1 Creation of plan.
Food for Friends restaurant is one of the best restaurant which providing services in UK.
With the aim to open a new outlet in London ,management decides to know opinion & feedback
of customers related to food & services they offered and their future growth prospective. For this
purpose researcher,opted for collecting data from primary and secondary source . The research
will also reveal information regarding the preferences of toady's consumers & factors existing
in business environment of London (Ferrell and Fraedrich, 2015). This will enhance their
decision making power to prepare appropriate strategies.
Primary source: It is considered as most important method of collecting first-hand
information from respondents. AS this method provides the most authentic information it helps
in getting the idea about the tastes and preferences of customers besides revealing the current
market trends and market scenario which are prevailing in food industry of UK .
Questionnaire: It is a series of questions that are prepared to be asked from respondents
for obtaining information related to particular research or topics. Food for Friends
restaurant is one of the best restaurant which providing services in UK. With the aim to
open a new outlet in London ,management decides to know opinion & feedback of
⊘ This is a preview!⊘
Do you want full access?
Subscribe today to unlock all pages.
Trusted by 1+ million students worldwide
customers related to food & services they offered and their future growth prospective. For
this purpose researcher,opted for collecting data from primary and secondary source . The
research will also reveal information regarding the preferences of toady's consumers &
factors existing in business environment of London. This will enhance their decision
making power to prepare appropriate strategies (Ford and Richardson, 2013).
Primary source: It is considered as most important method of collecting first-hand
information from respondents. AS this method pro
Survey: It is a face to face interaction with respondents on a particular topic by asking
pre determined questions and taking their feedbacks on a specific topic for the purpose of
testing concepts , knowing customer satisfaction level etc.
Online: It is the most fastest, easiest and cost efficient way of gathering information by
reaching larger audience. It involves use of digital technology and social media for
collecting information and getting feedbacks. As it is convenient option respondents tends
to give authentic information ,
Secondary source: It is the second hand information collected by someone other than the
user itself which already has been published in newspapers and magazines. This type of
information doesn't help in ascertaining public opinion as it is based on past performance of
Food for Friends restaurant (Gigerenzer and Gaissmaier, 2011).
1.2 Survey the methodology and sampling framing used.
Even though the main aim of food for friends that they have to make a research about
various things in market and this help in having a better collection and information too from the
various respondents in the large period of time in better manner. For this purpose and thus it
makes although to select the different respondents form the population and also uses the best
survey criteria which uses different survey methodologies to acccomplish right information and
data too.
Survey methodology: This is something which also uses the selction method and survey
which also provides different optimum things and result as well. Management of food for friends
has decided to make a research to use primary sources of data collection in better manner
(Groebner and et. al., 2011). Moreover the questionannire is such which help in making a
effective research and from this needed information can be collected in right way too. Hence
certain questions is being covered in which different aspects are aslo there.
Paraphrase This Document
Need a fresh take? Get an instant paraphrase of this document with our AI Paraphraser
Sample framework: This is something which consider different methods by researcher
with the respondents as well. Various methods are being there like cluster, stratifies and random
and many more too. Therefore, it is best to choose the random sampling method and almost 30
candidates are choosen from total population and thus this uis such which include various
questions and it is being asked in questionannire. The main topic which is being considered in
the sample are as follows:
Looking forward to open their branch in UK.
To know the quality of their services and products which they offer to people.
To know the suggestion if customers need any changes in goods and servoces as
well.
Strength and weakness with their current performance too.
1.3 Questionnaire.
This is that which conside and include the different important and needed questions.
Questionnaire is having various things which is a advantage in comparison with others like time
saving, collecting the information etc even in better manner though. Hence with this behaviours
and facts can be collected in great way too.
Questionnaire
Name:
Address:
Email id:
Gender:
1.) Is it executable for food for friends to open a better branch in UK?
Yes
No
2.) Is people are satisfied with the performance of restraunt?
Satisfied
Not satisfied
Moderate
3.) Is food for friends is providing their services on time or not?
Yes, they are
No, they are not
Sometimes, they do
4.) Restraunt is using technology in better manner for effective working?
Yes
No
5.) Is product and services are satisfcatory in taste?
Yes
No
6.) Ambiance or banquet hall is well maintained or not?
Yes
No
7.) Do customer of UK will accept the new opening of food for friends?
Yes
No
8.) Is food for friends are charging high prices for their product and services?
Yes
No
9.) Diversified condition of activities will help in establishing restraunt in newer city?
Yes
No
May be
10.) Any reccomendations for the food for friends?
…......................................................................................................................................................
...............................................................................................
TASK 2
2.1 Analysis of the information.Yes, they are
No, they are not
⊘ This is a preview!⊘
Do you want full access?
Subscribe today to unlock all pages.
Trusted by 1+ million students worldwide
Sometimes, they do
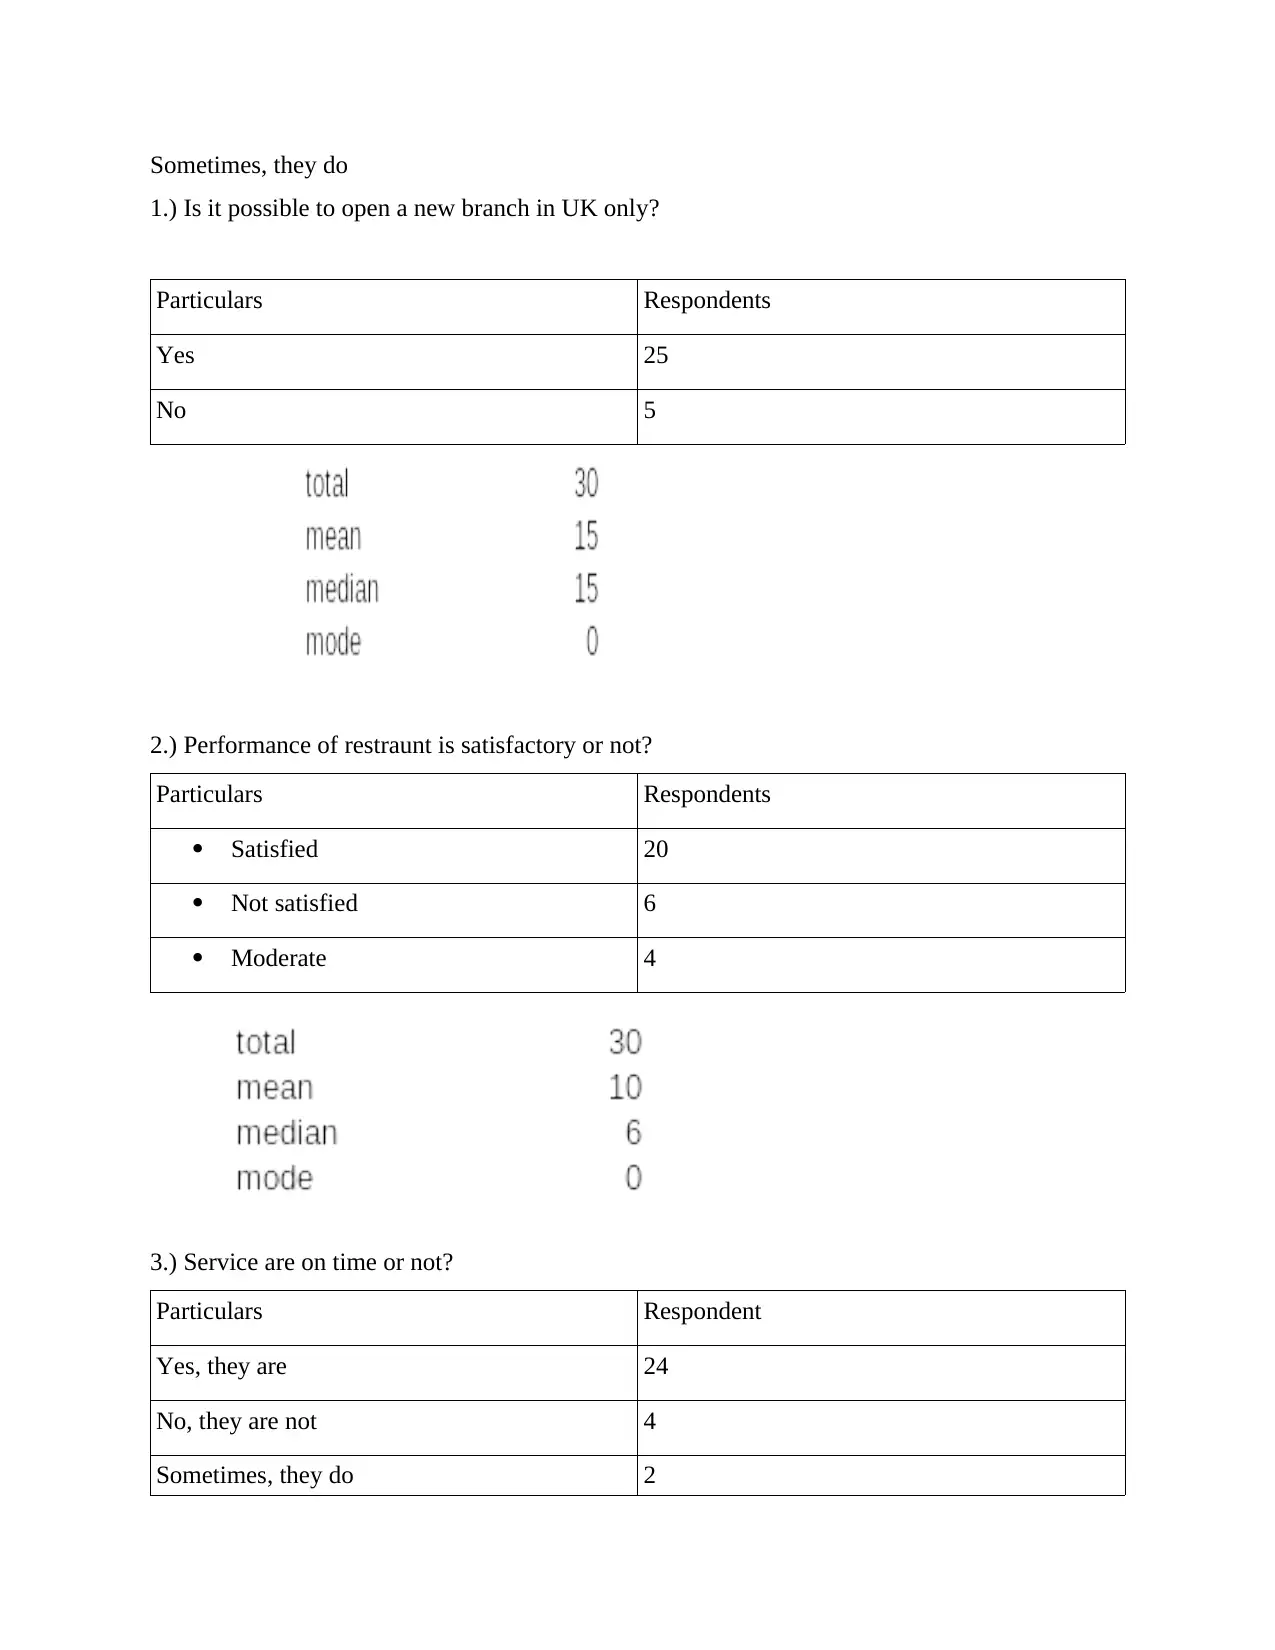
1.) Is it possible to open a new branch in UK only?
Particulars Respondents
Yes 25
No 5
2.) Performance of restraunt is satisfactory or not?
Particulars Respondents
Satisfied 20
Not satisfied 6
Moderate 4
3.) Service are on time or not?
Particulars Respondent
Yes, they are 24
No, they are not 4
Sometimes, they do 2
Paraphrase This Document
Need a fresh take? Get an instant paraphrase of this document with our AI Paraphraser
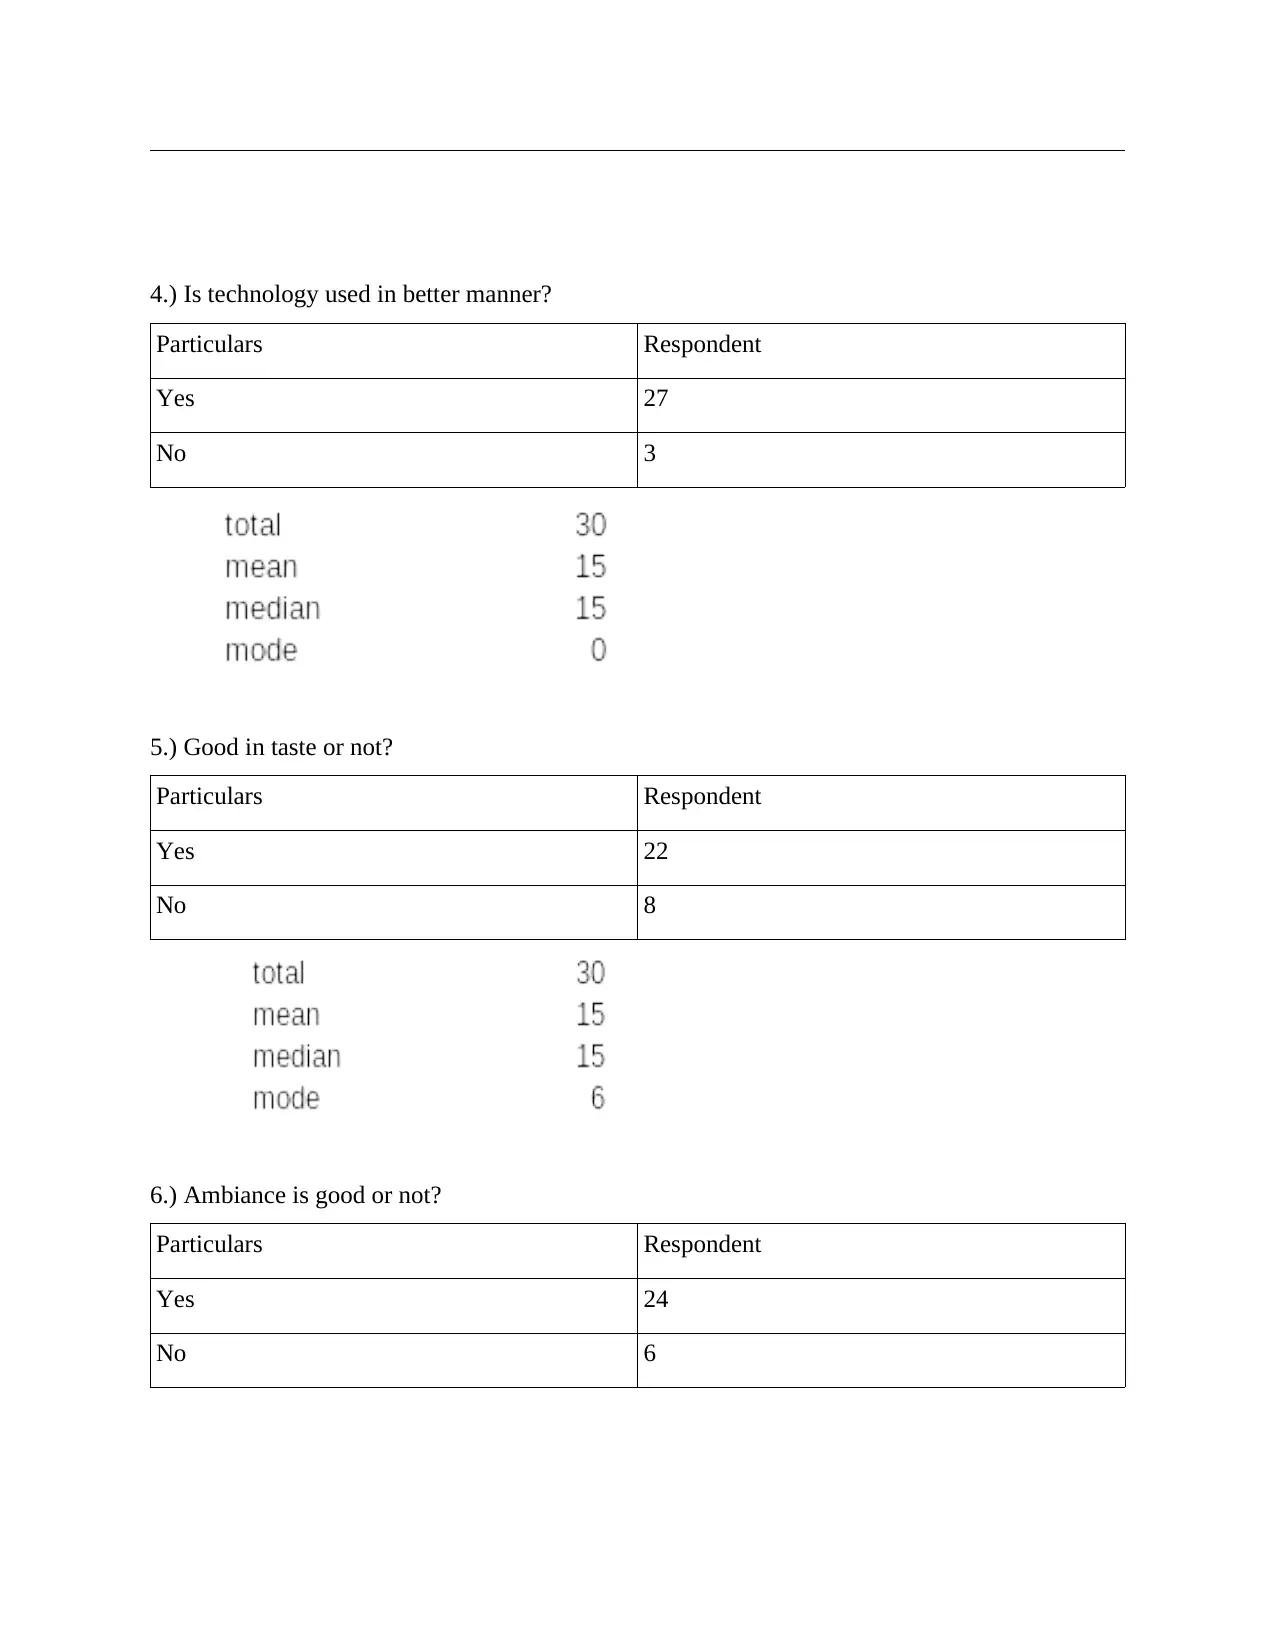
4.) Is technology used in better manner?
Particulars Respondent
Yes 27
No 3
5.) Good in taste or not?
Particulars Respondent
Yes 22
No 8
6.) Ambiance is good or not?
Particulars Respondent
Yes 24
No 6
Particulars Respondent
Yes 27
No 3
5.) Good in taste or not?
Particulars Respondent
Yes 22
No 8
6.) Ambiance is good or not?
Particulars Respondent
Yes 24
No 6
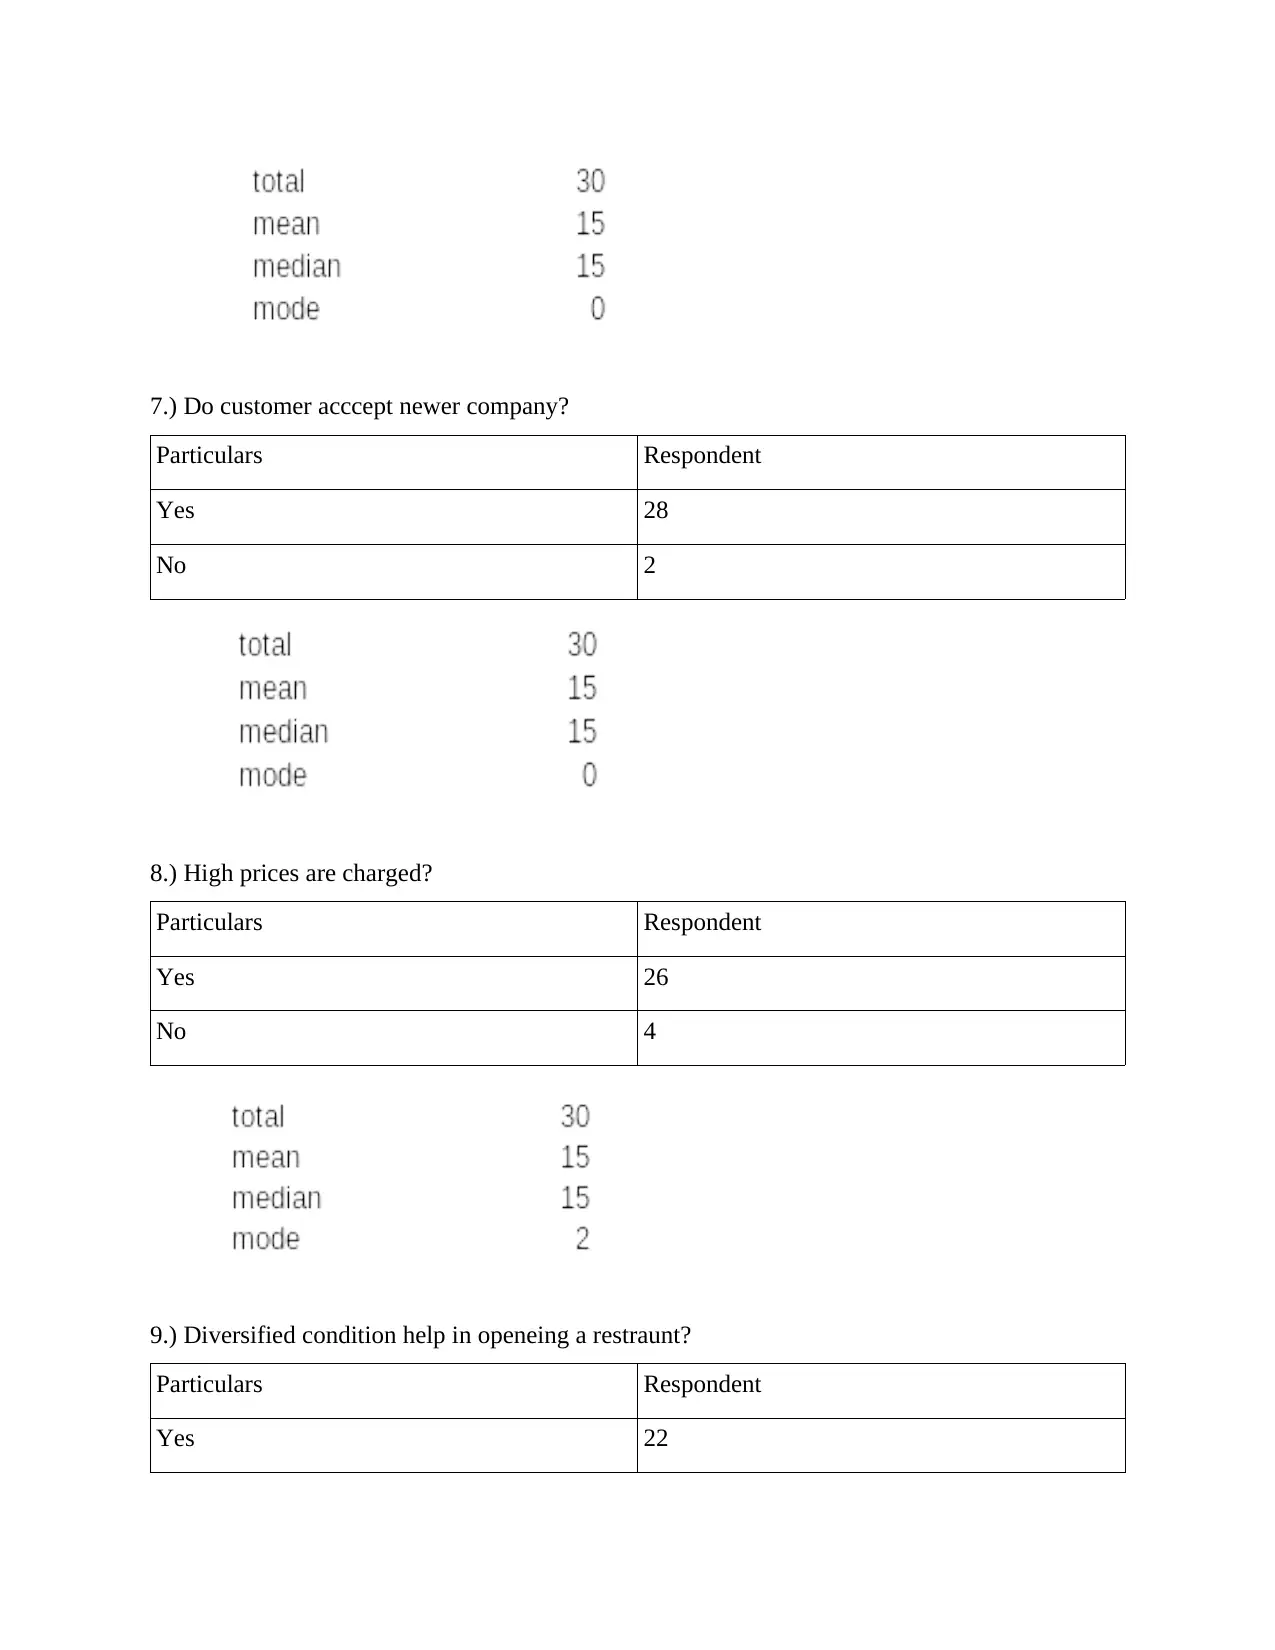
7.) Do customer acccept newer company?
Particulars Respondent
Yes 28
No 2
8.) High prices are charged?
Particulars Respondent
Yes 26
No 4
9.) Diversified condition help in openeing a restraunt?
Particulars Respondent
Yes 22
Particulars Respondent
Yes 28
No 2
8.) High prices are charged?
Particulars Respondent
Yes 26
No 4
9.) Diversified condition help in openeing a restraunt?
Particulars Respondent
Yes 22
⊘ This is a preview!⊘
Do you want full access?
Subscribe today to unlock all pages.
Trusted by 1+ million students worldwide
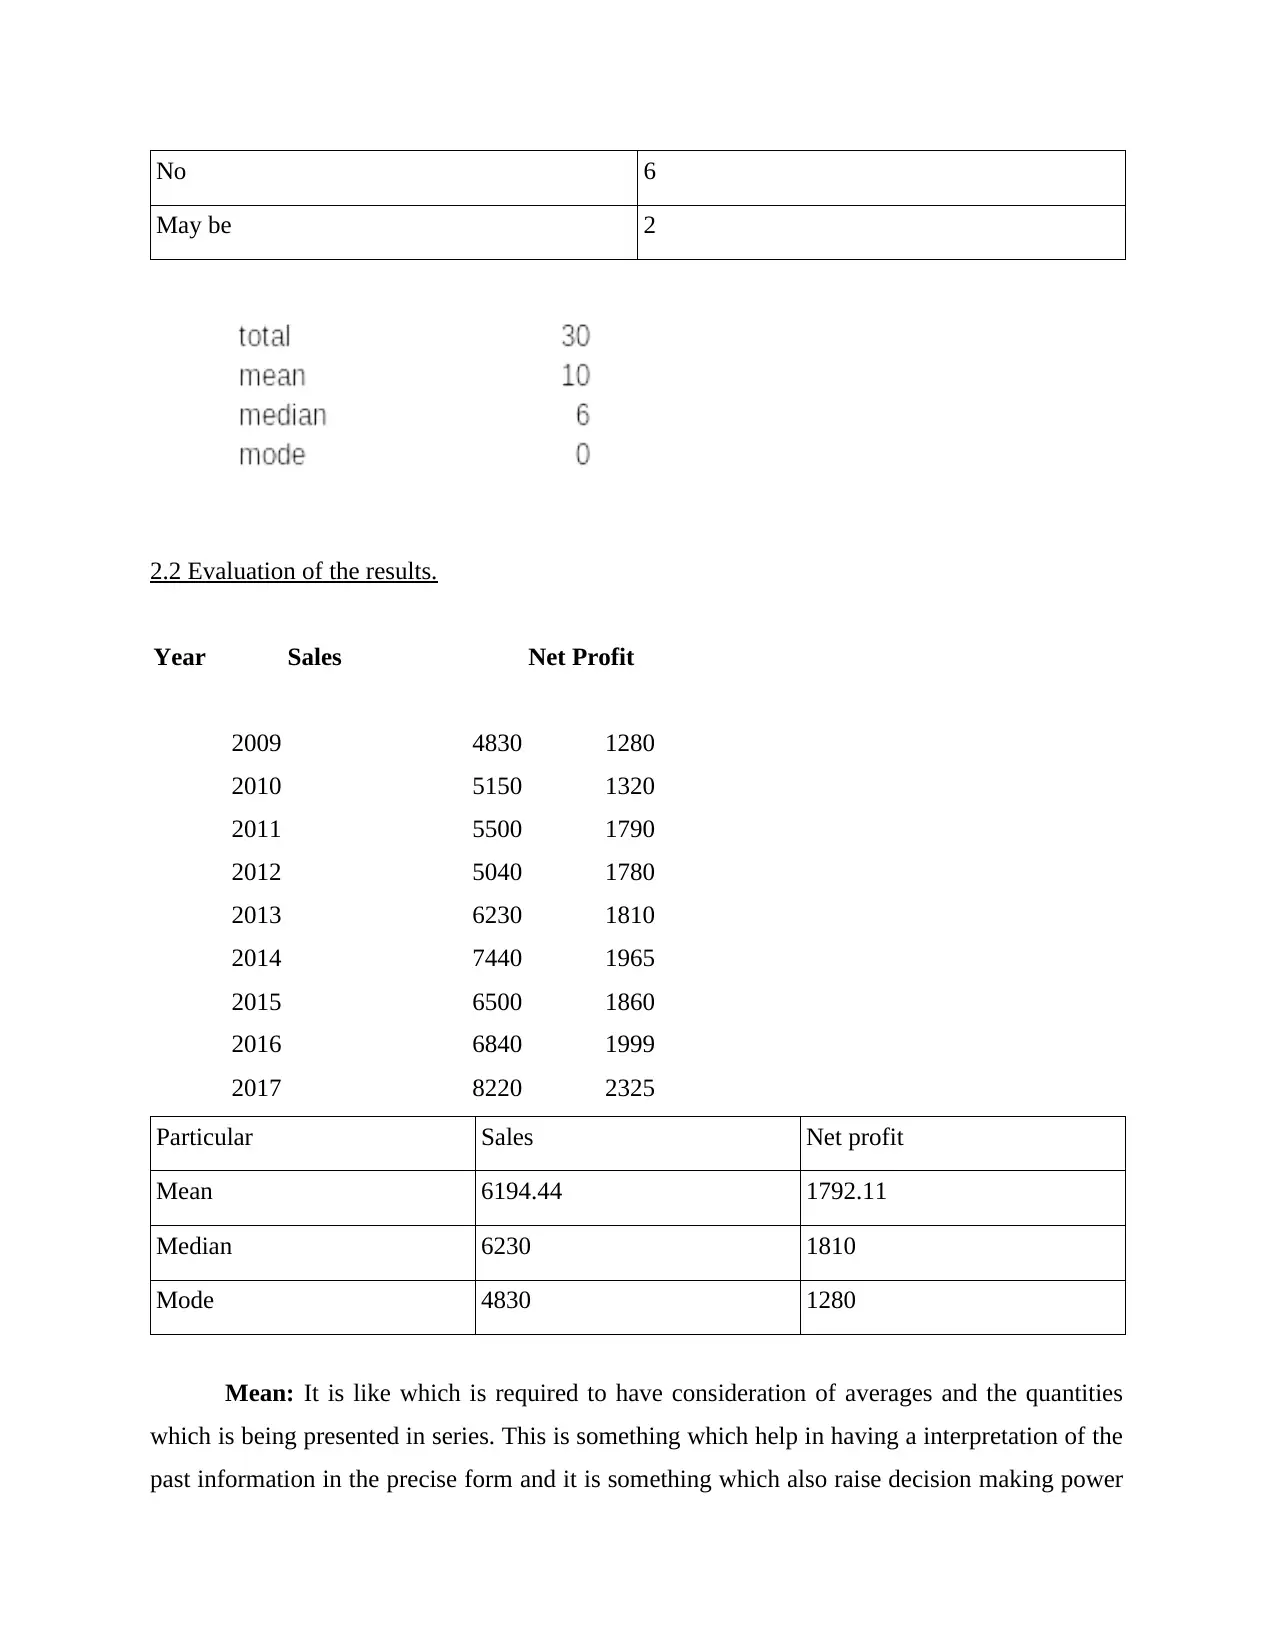
No 6
May be 2
2.2 Evaluation of the results.
Year Sales Net Profit
2009 4830 1280
2010 5150 1320
2011 5500 1790
2012 5040 1780
2013 6230 1810
2014 7440 1965
2015 6500 1860
2016 6840 1999
2017 8220 2325
Particular Sales Net profit
Mean 6194.44 1792.11
Median 6230 1810
Mode 4830 1280
Mean: It is like which is required to have consideration of averages and the quantities
which is being presented in series. This is something which help in having a interpretation of the
past information in the precise form and it is something which also raise decision making power
Paraphrase This Document
Need a fresh take? Get an instant paraphrase of this document with our AI Paraphraser
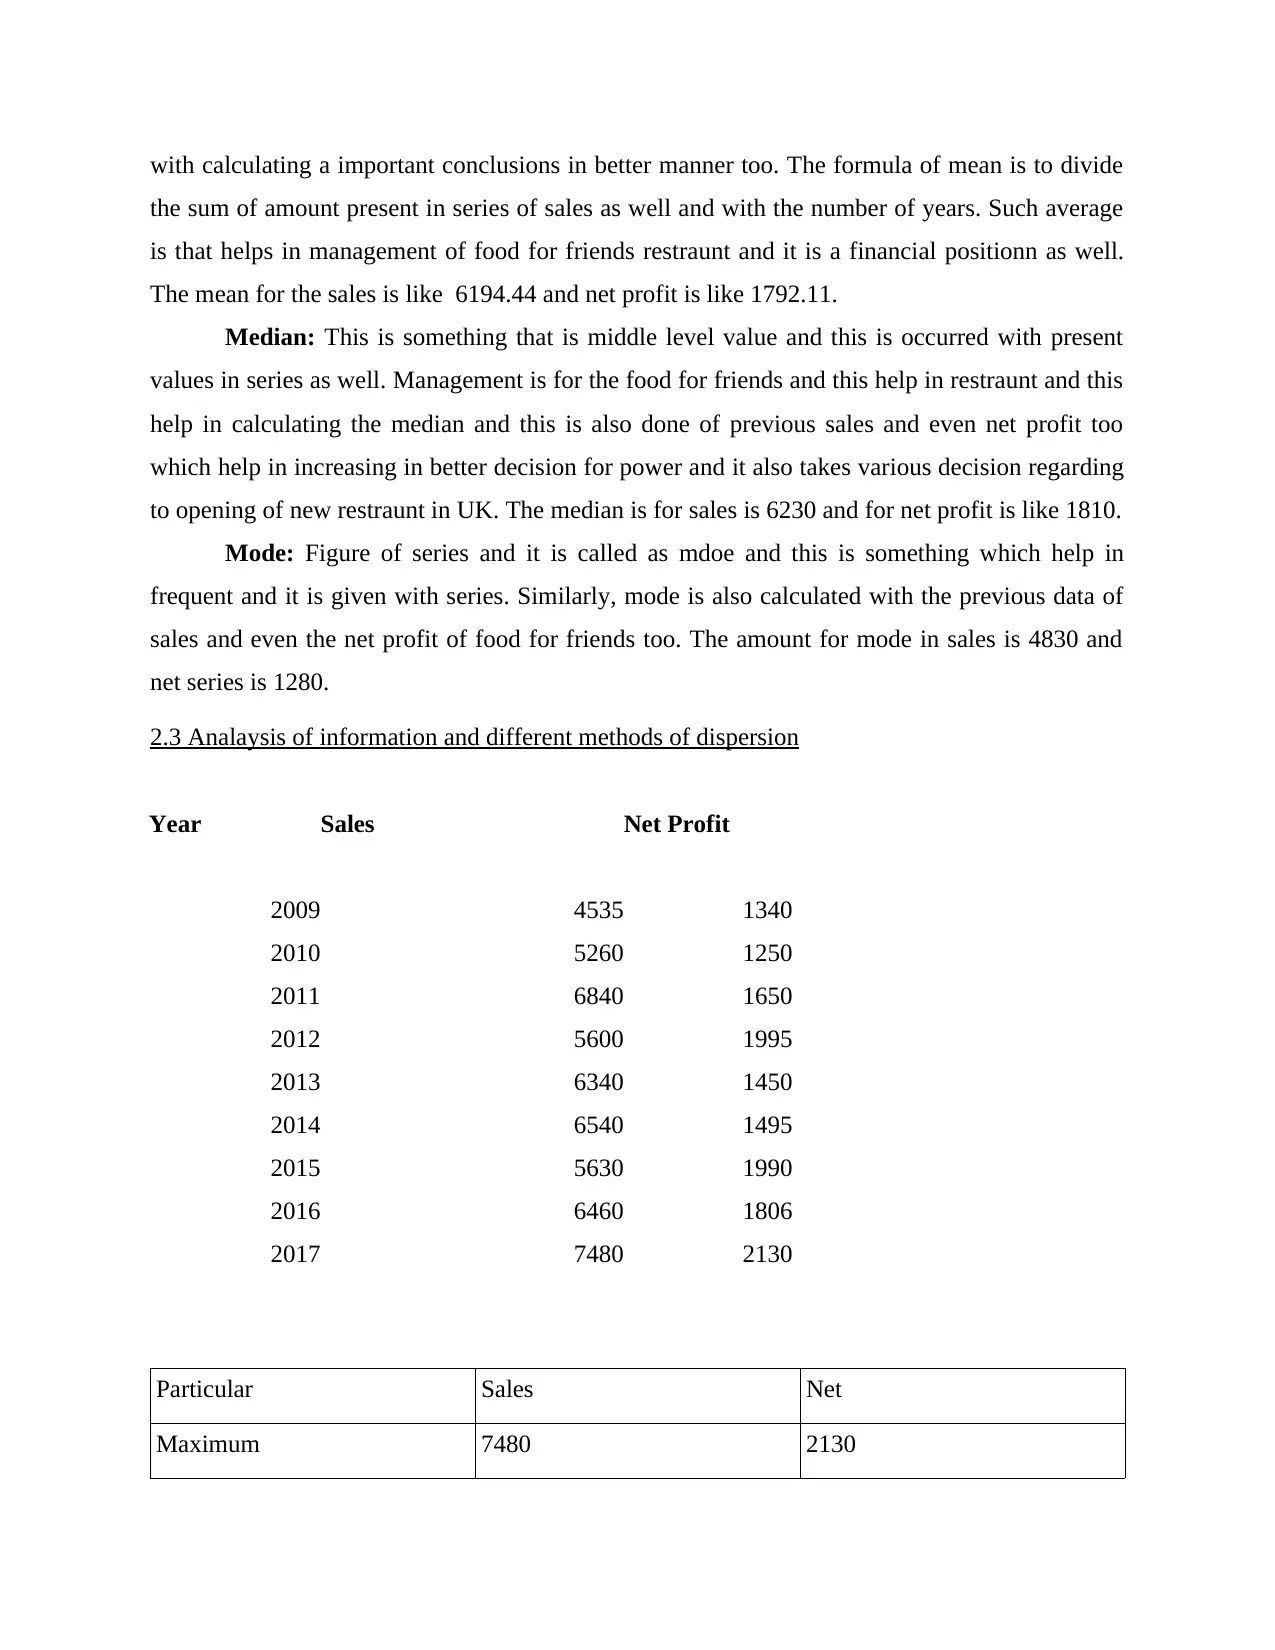
with calculating a important conclusions in better manner too. The formula of mean is to divide
the sum of amount present in series of sales as well and with the number of years. Such average
is that helps in management of food for friends restraunt and it is a financial positionn as well.
The mean for the sales is like 6194.44 and net profit is like 1792.11.
Median: This is something that is middle level value and this is occurred with present
values in series as well. Management is for the food for friends and this help in restraunt and this
help in calculating the median and this is also done of previous sales and even net profit too
which help in increasing in better decision for power and it also takes various decision regarding
to opening of new restraunt in UK. The median is for sales is 6230 and for net profit is like 1810.
Mode: Figure of series and it is called as mdoe and this is something which help in
frequent and it is given with series. Similarly, mode is also calculated with the previous data of
sales and even the net profit of food for friends too. The amount for mode in sales is 4830 and
net series is 1280.
2.3 Analaysis of information and different methods of dispersion
Year Sales Net Profit
2009 4535 1340
2010 5260 1250
2011 6840 1650
2012 5600 1995
2013 6340 1450
2014 6540 1495
2015 5630 1990
2016 6460 1806
2017 7480 2130
Particular Sales Net
Maximum 7480 2130
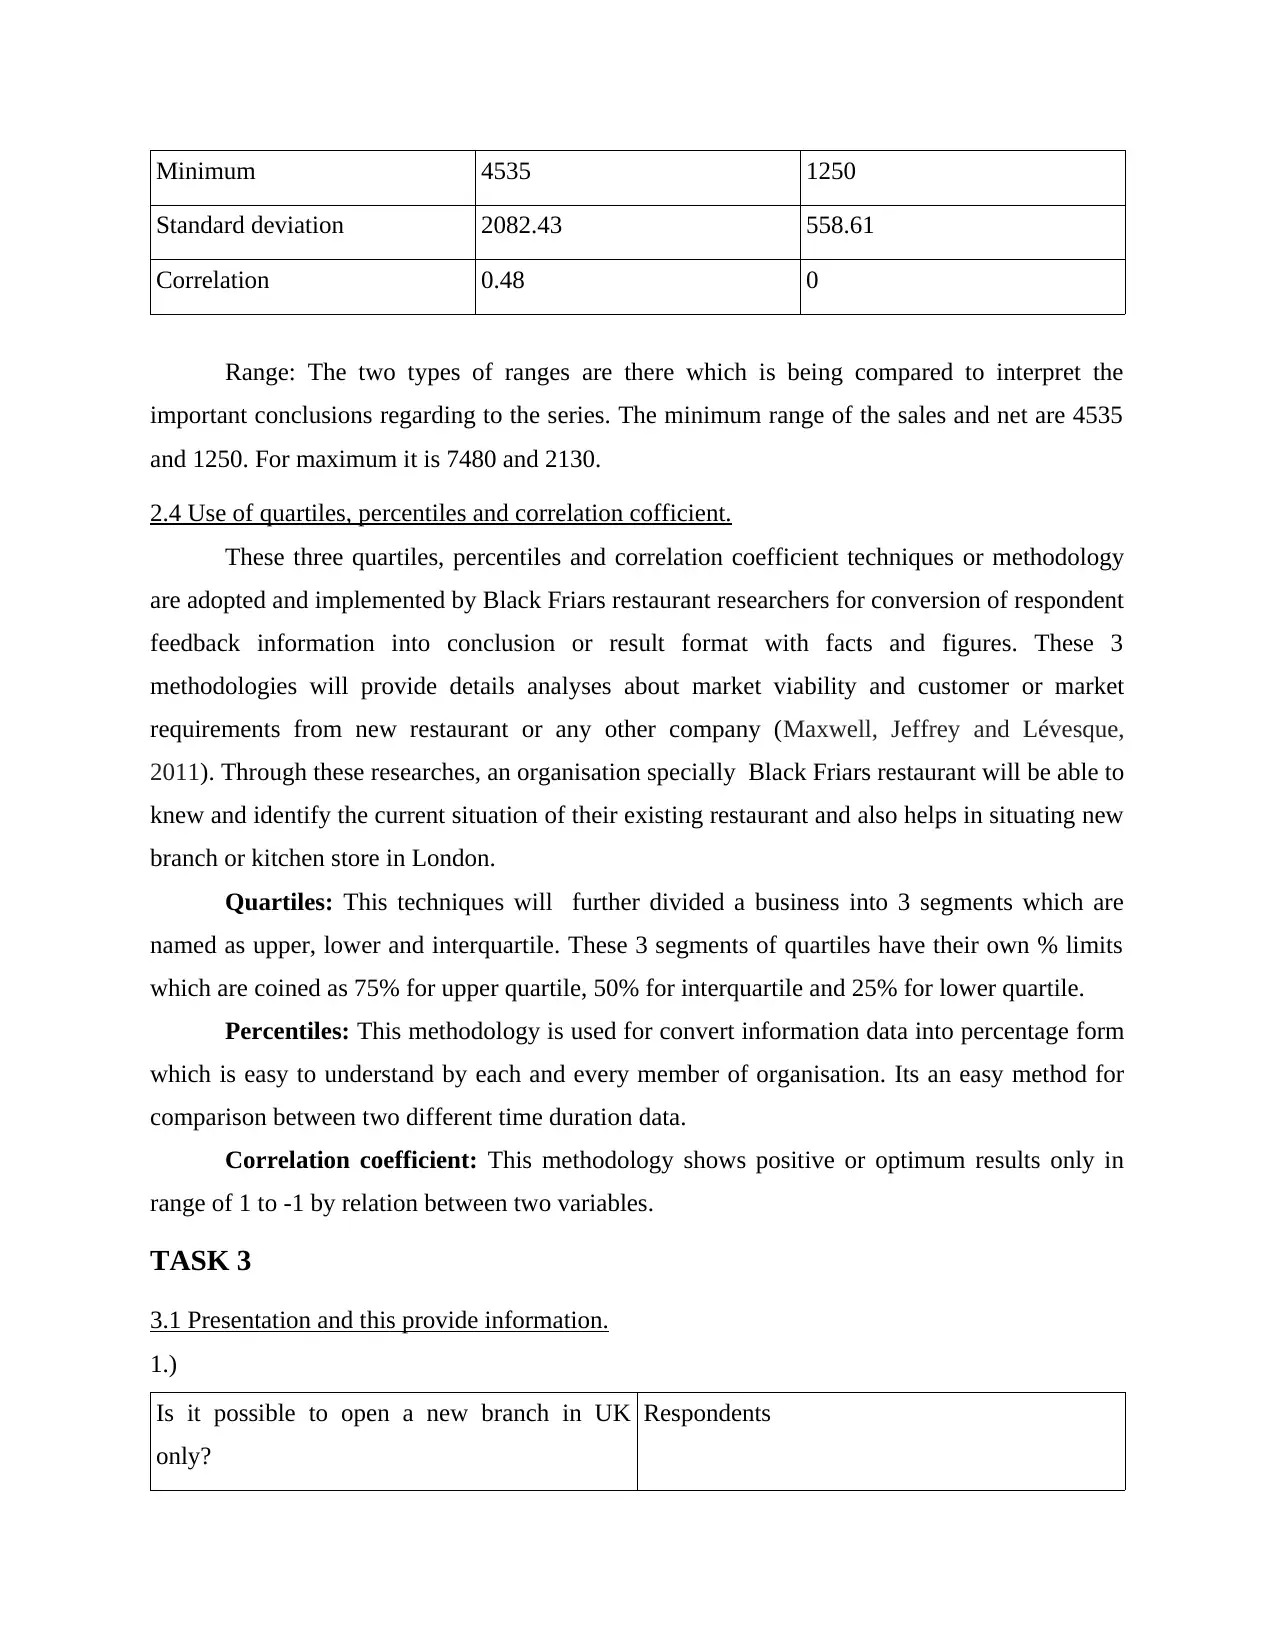
Minimum 4535 1250
Standard deviation 2082.43 558.61
Correlation 0.48 0
Range: The two types of ranges are there which is being compared to interpret the
important conclusions regarding to the series. The minimum range of the sales and net are 4535
and 1250. For maximum it is 7480 and 2130.
2.4 Use of quartiles, percentiles and correlation cofficient.
These three quartiles, percentiles and correlation coefficient techniques or methodology
are adopted and implemented by Black Friars restaurant researchers for conversion of respondent
feedback information into conclusion or result format with facts and figures. These 3
methodologies will provide details analyses about market viability and customer or market
requirements from new restaurant or any other company (Maxwell, Jeffrey and Lévesque,
2011). Through these researches, an organisation specially Black Friars restaurant will be able to
knew and identify the current situation of their existing restaurant and also helps in situating new
branch or kitchen store in London.
Quartiles: This techniques will further divided a business into 3 segments which are
named as upper, lower and interquartile. These 3 segments of quartiles have their own % limits
which are coined as 75% for upper quartile, 50% for interquartile and 25% for lower quartile.
Percentiles: This methodology is used for convert information data into percentage form
which is easy to understand by each and every member of organisation. Its an easy method for
comparison between two different time duration data.
Correlation coefficient: This methodology shows positive or optimum results only in
range of 1 to -1 by relation between two variables.
TASK 3
3.1 Presentation and this provide information.
1.)
Is it possible to open a new branch in UK
only?
Respondents
⊘ This is a preview!⊘
Do you want full access?
Subscribe today to unlock all pages.
Trusted by 1+ million students worldwide
1 out of 21
Related Documents


Your All-in-One AI-Powered Toolkit for Academic Success.
+13062052269
info@desklib.com
Available 24*7 on WhatsApp / Email
![[object Object]](/_next/static/media/star-bottom.7253800d.svg)
Unlock your academic potential
Copyright © 2020–2026 A2Z Services. All Rights Reserved. Developed and managed by ZUCOL.