Business Decision Making Report: Food for Friends, London Expansion
VerifiedAdded on 2020/07/22
|20
|5009
|38
Report
AI Summary
This report analyzes the business decision-making processes for Food for Friends, a family restaurant, focusing on its potential expansion. The report details the collection of primary and secondary data, including survey methodologies and questionnaire design to gather customer insights. Data analysis techniques such as mean, median, mode, and standard deviation are employed to derive valid conclusions from the survey responses. The report also covers the use of graphs, trend lines, and business presentations to communicate findings and recommendations. Furthermore, it explores information processing tools, critical path management, and financial tools to support decision-making. The ultimate goal is to provide Food for Friends with actionable insights to support its growth plans, particularly regarding a potential new restaurant in London.
BUSINESS
DECISION MAKING
DECISION MAKING
Paraphrase This Document
Need a fresh take? Get an instant paraphrase of this document with our AI Paraphraser
Table of Contents
INTRODUCTION...........................................................................................................................1
TASK 1............................................................................................................................................1
AC 1.1 Collection of primary and secondary data plan for Food for Friends............................1
AC 1.2 Using Survey methodologies and sampling frame for collecting primary and
secondary data.............................................................................................................................2
AC 1.3 Questionnaire for opening second restaurant of Food for Friends in London................3
AC 2.1 Information for decision-making by summarising data from questionnaire .................5
AC 2.2 Analysis of results through mean, median and mode to draw a valid conclusion for
Food for Friends..........................................................................................................................5
AC 2.3 Dara analysis through measurement of dispersion on the basis of standard deviation. .6
AC 2.4 Uses of quartiles, percentiles and correlation coefficient for valid conclusions............7
TASK 2...........................................................................................................................................9
AC 3.1 Graphs presentation for valid conclusions on the basis of questionnaire.......................9
AC 3.2 Creation of trend lines in future forecasting.................................................................11
AC 3.3 Business presentation...................................................................................................11
AC 3.4 Formation of formal business report to senior authority..............................................12
TASK 3..........................................................................................................................................12
AC 4.1 Information processing tools advantages to benefit decision-making..........................12
AC 4.2 Formation of critical path management........................................................................13
AC 4.3 Benefits of financial tools in relation to make decisions .............................................14
CONCLUSION..............................................................................................................................15
REFERENCES..............................................................................................................................17
INTRODUCTION
In every business, people can only get success through big decisions (Albright, Winston
and Zappe, 2010). Making good decisions is not simple task, to make better decisions for
business, it is necessary to discuss with employees who is going to affect by decision making
process. Their views will be useful to find better alternatives to make a balance between success
of a company and employees satisfaction. A good decisions always gives success to a firm. The
present value of return on investments, expected rate of return from funds invested and effects on
growth of business are some of the criteria which have to be considered while taking any useful
decision for a company.
Food for Friends is a family restaurant that was established in 1995 at Chicago. Its main
aim is to provide organic food to each person. In this report, various tools like mean, median and
mode have been used. Critical path evaluation is used to measure estimated time to accomplish
this new project.
The main objective of this report is to find valid conclusion from data's like
questionnaire, to help Food for Friends restaurant in taking good decisions for companies
growth.
TASK 1
AC 1.1 Collection of primary and secondary data plan for Food for Friends
Primary and secondary sources are selected for collection of data for company. Below is
the plan which is described in steps for collecting valid data for firm:
Primary Data: This source is useful for collecting fresh and high value data, This
method is used to get more accurate results from research (Yager and Kacprzyk, 2012). Primary
data's is collected through number of ways, which is Surveys, Interviews and Observations.
For survey, Non-probability samples were considered for survey methodologies. In this
method, samples were collected through convenience and judgement sampling procedures. The
overall budget invested on primary data were £21,000.
⊘ This is a preview!⊘
Do you want full access?
Subscribe today to unlock all pages.
Trusted by 1+ million students worldwide
Secondary data: Collection of data from primary sources is not enough. Past data's also
sometimes useful to get a conclusion. Because techniques like trend analysis, regression methods
and least square method is not possible on primary data. Therefore past researches were include
in data collection through secondary sources. Some of methods which is used in collecting
secondary data are given below:
◦ Census and geographical informations has been collected from government
information centres. This method is categorized under collection of data's from
government sources.
◦ Press release news and reports related to rival companies future strategies, policies
and regulations is considered and converted into some estimated figures.
◦ Some paid research firms has been approached to save time for Food for Friends.
£4,000 is invested on acquisition of secondary research reports and tools.
Secondary data is also good because it is cheaper than primary sources. As no extra cost
has to be paid on research teams, employees and department. But alone secondary research
couldn't give valid and feasible report. The mixture of both techniques and methods will give
excellent results.
AC 1.2 Using Survey methodologies and sampling frame for collecting primary and secondary
data
Survey methodologies are those tools and techniques which evaluates sample frame
collected from selected population (Barlett, 2016). This method uses questionnaire, interviews,
online surveys, etc. tools to collect live data from selected people.
Sampling frame is a procedure of deciding the alternatives from where data has to be
collected. Here in the case of Food for Friends, focus will be on lists of all customers who
regularly visits restaurants, there informations will be gathered through bills, credit card and
debit card payments details. Customers of Little French Restaurant and Little Persia Restaurant
will be targetted to collect samples.
In Survey methodology, non-probability samples will be considered and randomly
selection of samples will be done. In this method, chances of occurrence of any event is avoided.
Below are some of the ways through which Non-probability samples will be collected:
Convenience Sampling: In this sampling method, customers who were regularly visited
to Food for Friends, Little French Restaurant and Little Persia Restaurants were stopped
Paraphrase This Document
Need a fresh take? Get an instant paraphrase of this document with our AI Paraphraser
and asked to fill up the questionnaire form. As this survey was carried on Saturday, so
people who prefers to visit Saturday and Sunday were also included in sample.
Judgement Sampling: In this method, the subject matter specialists which is cooks, chefs and
stewards were asked to frame a questions for questionnaire, to get valuable responses from
selected samples (Wu and Pagell, 2011). They were also asked to give their response on
customers behaviour and preferences on the basis of their judgement, as they are the only
persons who regularly interacts with them.
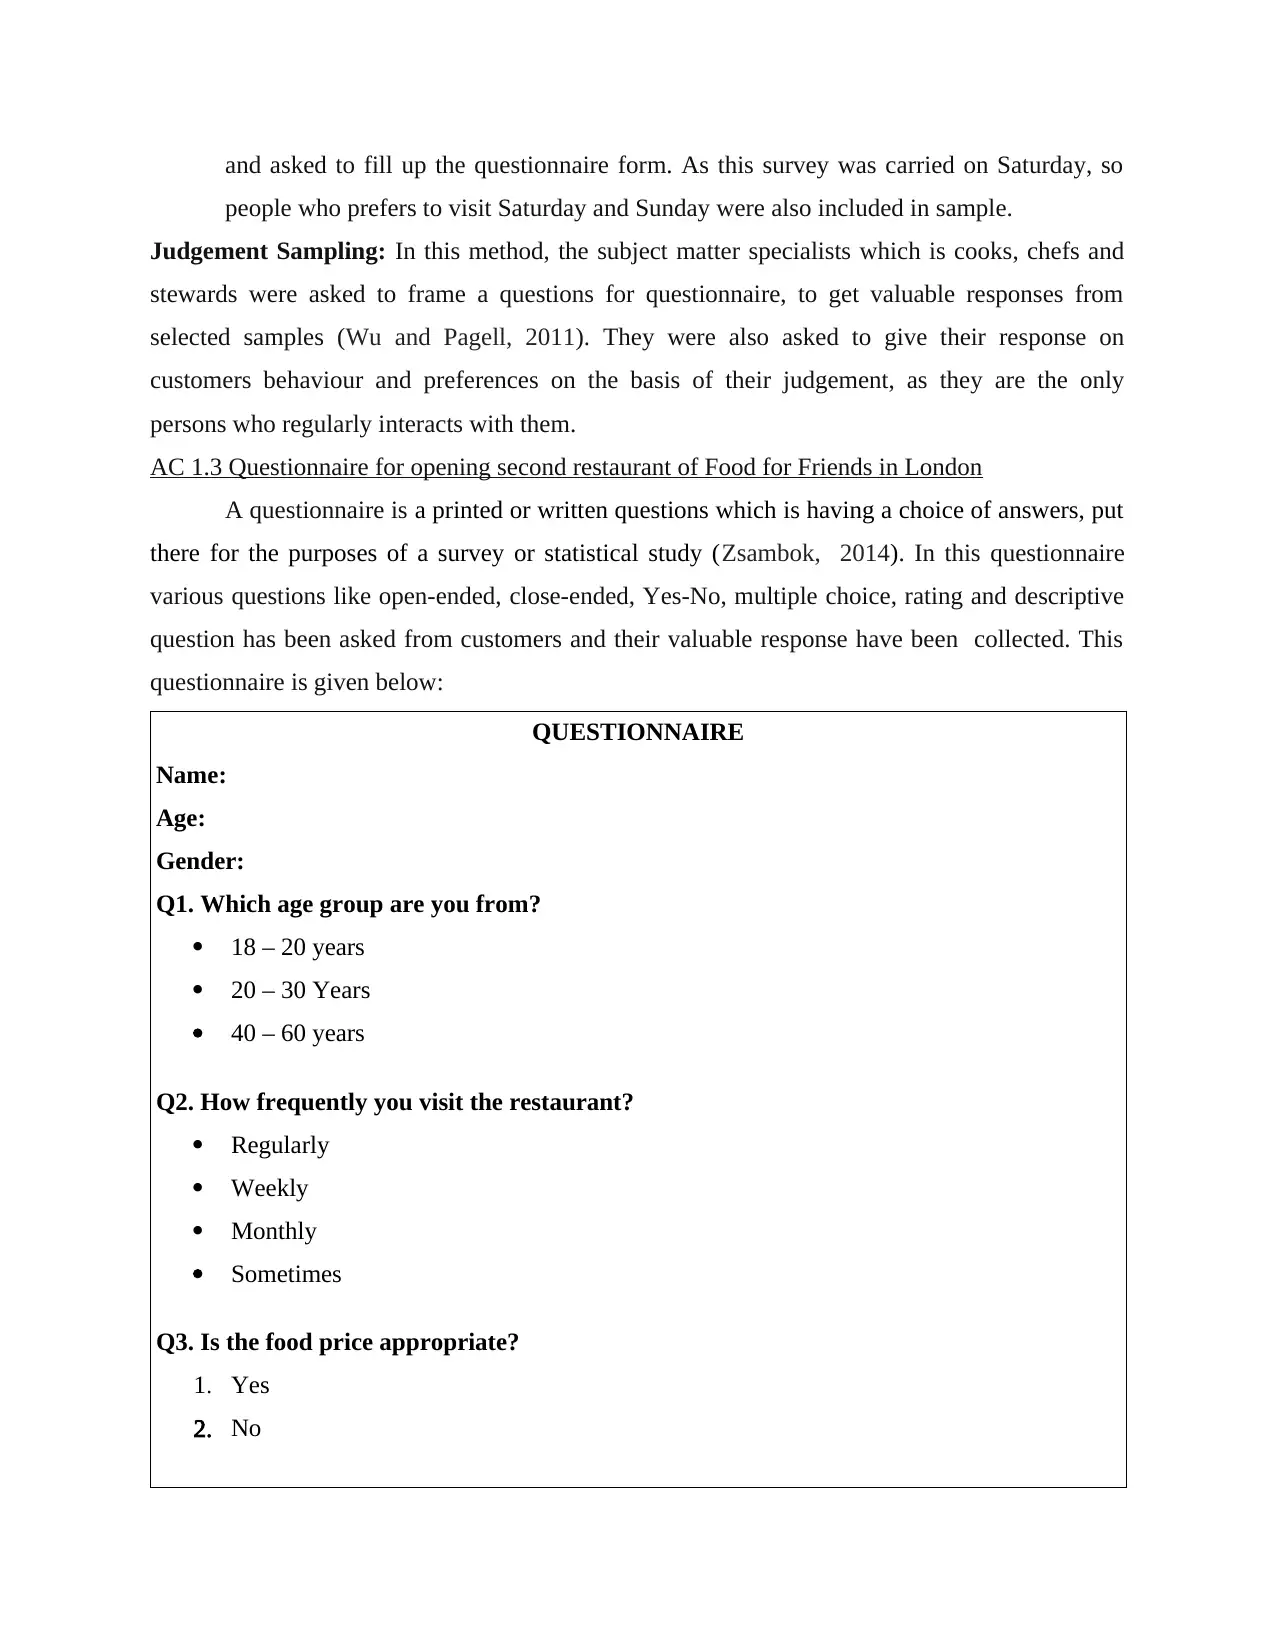
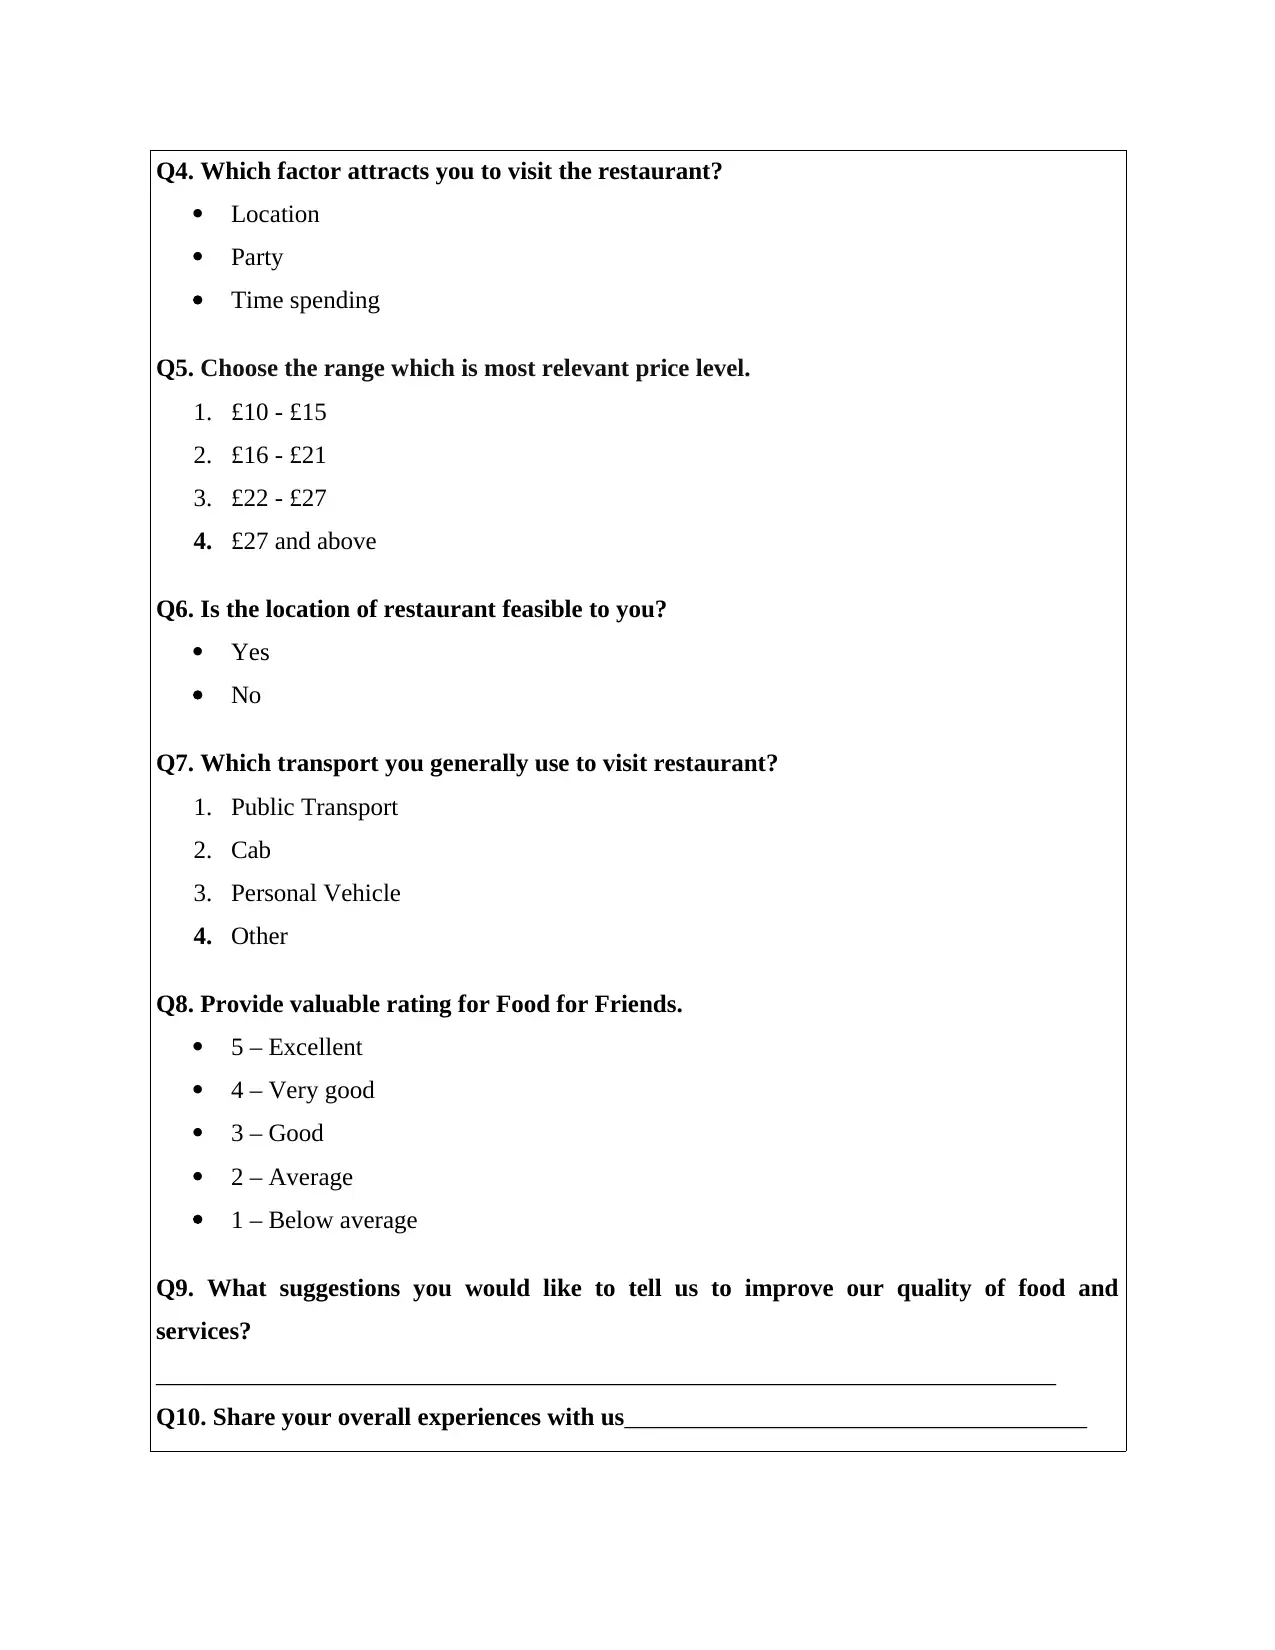
AC 1.3 Questionnaire for opening second restaurant of Food for Friends in London
A questionnaire is a printed or written questions which is having a choice of answers, put
there for the purposes of a survey or statistical study (Zsambok, 2014). In this questionnaire
various questions like open-ended, close-ended, Yes-No, multiple choice, rating and descriptive
question has been asked from customers and their valuable response have been collected. This
questionnaire is given below:
QUESTIONNAIRE
Name:
Age:
Gender:
Q1. Which age group are you from?
18 – 20 years
20 – 30 Years
40 – 60 years
Q2. How frequently you visit the restaurant?
Regularly
Weekly
Monthly
Sometimes
Q3. Is the food price appropriate?
1. Yes
2. No
people who prefers to visit Saturday and Sunday were also included in sample.
Judgement Sampling: In this method, the subject matter specialists which is cooks, chefs and
stewards were asked to frame a questions for questionnaire, to get valuable responses from
selected samples (Wu and Pagell, 2011). They were also asked to give their response on
customers behaviour and preferences on the basis of their judgement, as they are the only
persons who regularly interacts with them.
AC 1.3 Questionnaire for opening second restaurant of Food for Friends in London
A questionnaire is a printed or written questions which is having a choice of answers, put
there for the purposes of a survey or statistical study (Zsambok, 2014). In this questionnaire
various questions like open-ended, close-ended, Yes-No, multiple choice, rating and descriptive
question has been asked from customers and their valuable response have been collected. This
questionnaire is given below:
QUESTIONNAIRE
Name:
Age:
Gender:
Q1. Which age group are you from?
18 – 20 years
20 – 30 Years
40 – 60 years
Q2. How frequently you visit the restaurant?
Regularly
Weekly
Monthly
Sometimes
Q3. Is the food price appropriate?
1. Yes
2. No
Q4. Which factor attracts you to visit the restaurant?
Location
Party
Time spending
Q5. Choose the range which is most relevant price level.
1. £10 - £15
2. £16 - £21
3. £22 - £27
4. £27 and above
Q6. Is the location of restaurant feasible to you?
Yes
No
Q7. Which transport you generally use to visit restaurant?
1. Public Transport
2. Cab
3. Personal Vehicle
4. Other
Q8. Provide valuable rating for Food for Friends.
5 – Excellent
4 – Very good
3 – Good
2 – Average
1 – Below average
Q9. What suggestions you would like to tell us to improve our quality of food and
services?
________________________________________________________________________
Q10. Share your overall experiences with us_____________________________________
⊘ This is a preview!⊘
Do you want full access?
Subscribe today to unlock all pages.
Trusted by 1+ million students worldwide
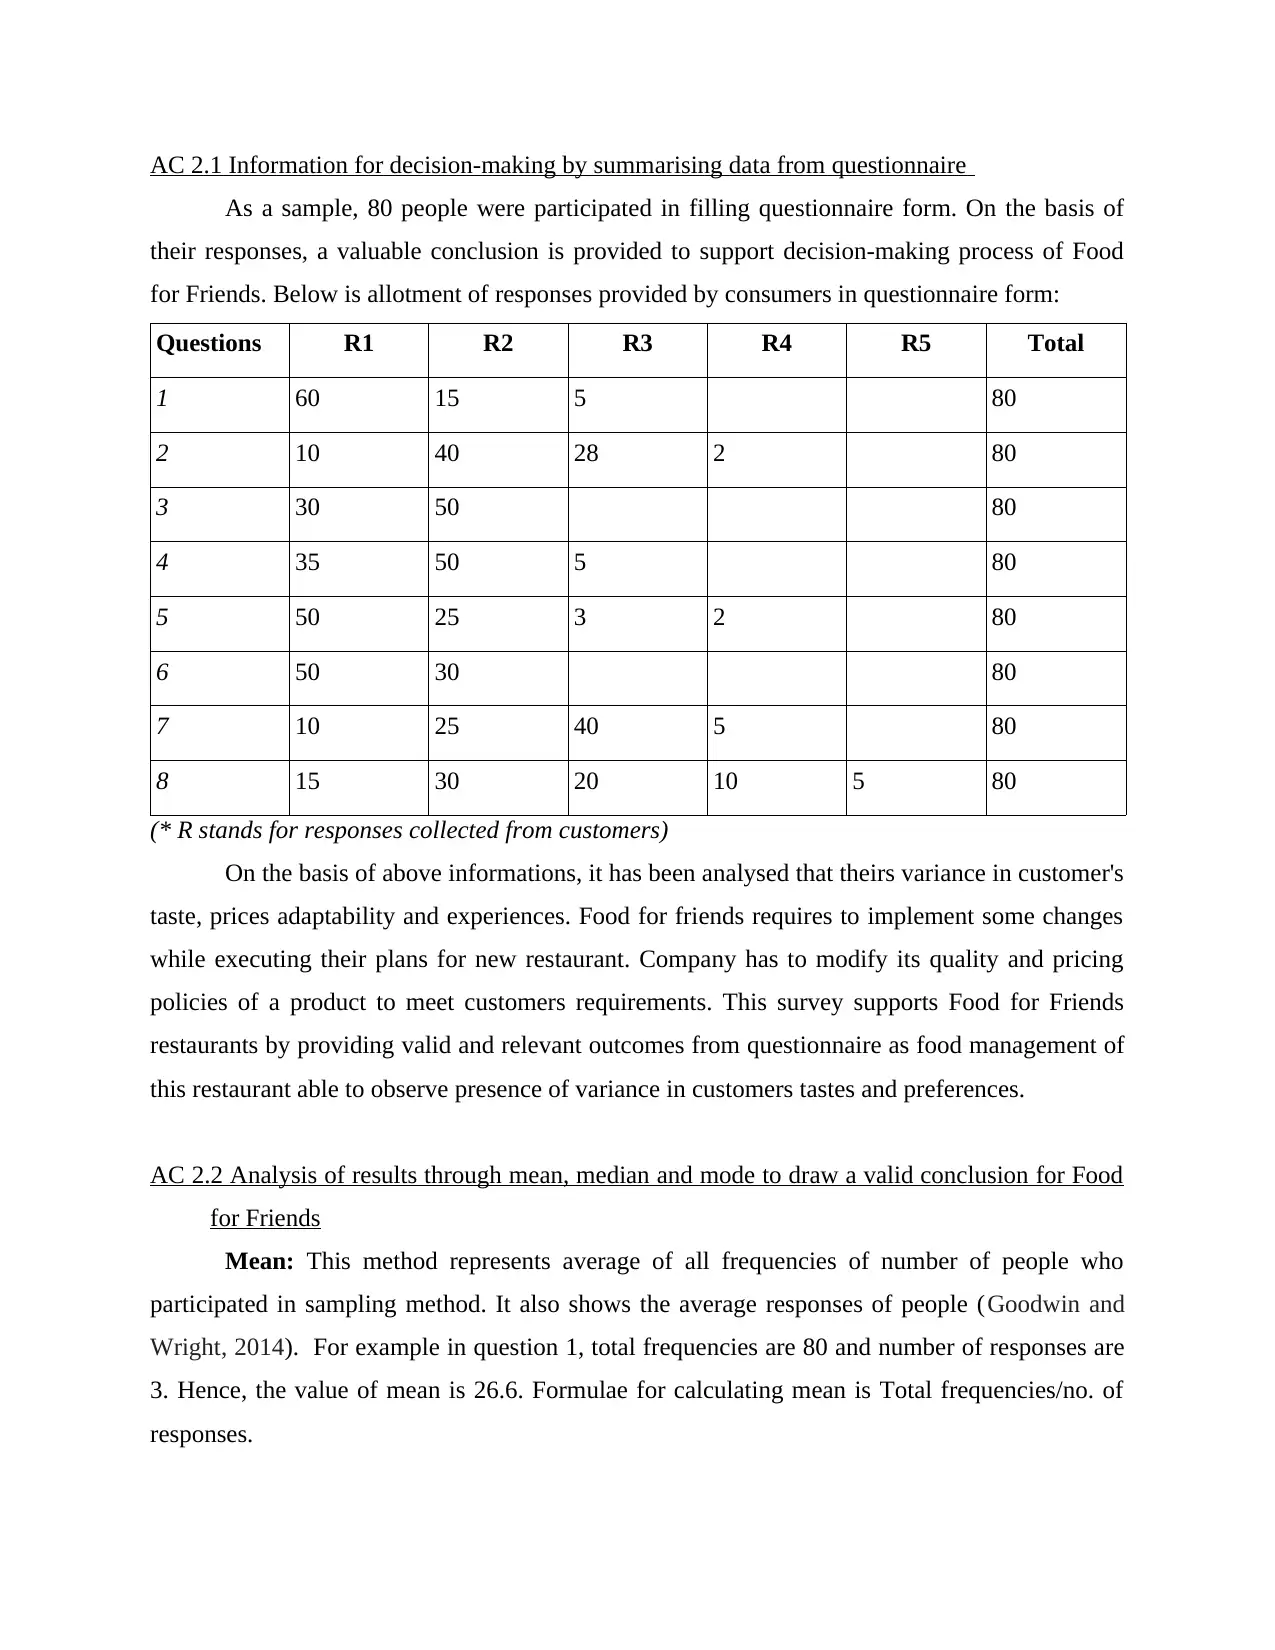
AC 2.1 Information for decision-making by summarising data from questionnaire
As a sample, 80 people were participated in filling questionnaire form. On the basis of
their responses, a valuable conclusion is provided to support decision-making process of Food
for Friends. Below is allotment of responses provided by consumers in questionnaire form:
Questions R1 R2 R3 R4 R5 Total
1 60 15 5 80
2 10 40 28 2 80
3 30 50 80
4 35 50 5 80
5 50 25 3 2 80
6 50 30 80
7 10 25 40 5 80
8 15 30 20 10 5 80
(* R stands for responses collected from customers)
On the basis of above informations, it has been analysed that theirs variance in customer's
taste, prices adaptability and experiences. Food for friends requires to implement some changes
while executing their plans for new restaurant. Company has to modify its quality and pricing
policies of a product to meet customers requirements. This survey supports Food for Friends
restaurants by providing valid and relevant outcomes from questionnaire as food management of
this restaurant able to observe presence of variance in customers tastes and preferences.
AC 2.2 Analysis of results through mean, median and mode to draw a valid conclusion for Food
for Friends
Mean: This method represents average of all frequencies of number of people who
participated in sampling method. It also shows the average responses of people (Goodwin and
Wright, 2014). For example in question 1, total frequencies are 80 and number of responses are
3. Hence, the value of mean is 26.6. Formulae for calculating mean is Total frequencies/no. of
responses.
Paraphrase This Document
Need a fresh take? Get an instant paraphrase of this document with our AI Paraphraser
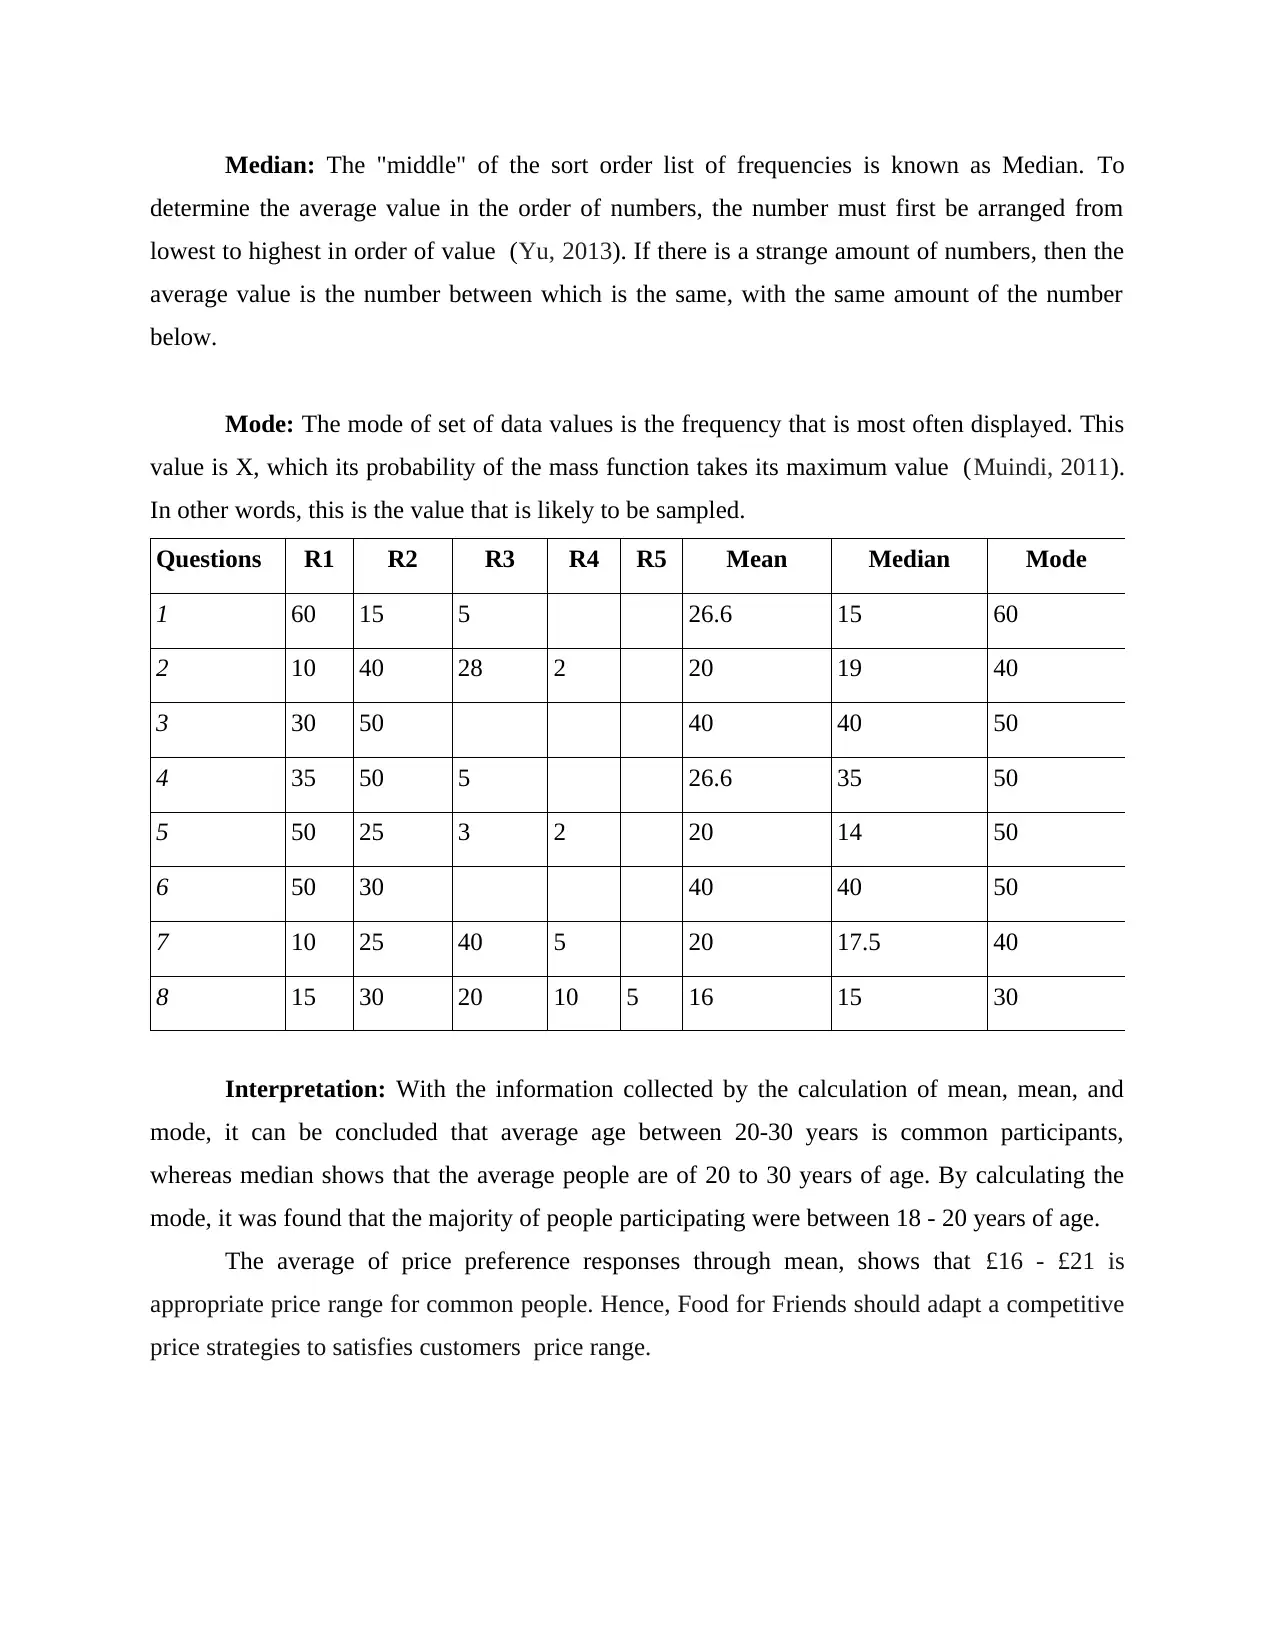
Median: The "middle" of the sort order list of frequencies is known as Median. To
determine the average value in the order of numbers, the number must first be arranged from
lowest to highest in order of value (Yu, 2013). If there is a strange amount of numbers, then the
average value is the number between which is the same, with the same amount of the number
below.
Mode: The mode of set of data values is the frequency that is most often displayed. This
value is X, which its probability of the mass function takes its maximum value (Muindi, 2011).
In other words, this is the value that is likely to be sampled.
Questions R1 R2 R3 R4 R5 Mean Median Mode
1 60 15 5 26.6 15 60
2 10 40 28 2 20 19 40
3 30 50 40 40 50
4 35 50 5 26.6 35 50
5 50 25 3 2 20 14 50
6 50 30 40 40 50
7 10 25 40 5 20 17.5 40
8 15 30 20 10 5 16 15 30
Interpretation: With the information collected by the calculation of mean, mean, and
mode, it can be concluded that average age between 20-30 years is common participants,
whereas median shows that the average people are of 20 to 30 years of age. By calculating the
mode, it was found that the majority of people participating were between 18 - 20 years of age.
The average of price preference responses through mean, shows that £16 - £21 is
appropriate price range for common people. Hence, Food for Friends should adapt a competitive
price strategies to satisfies customers price range.
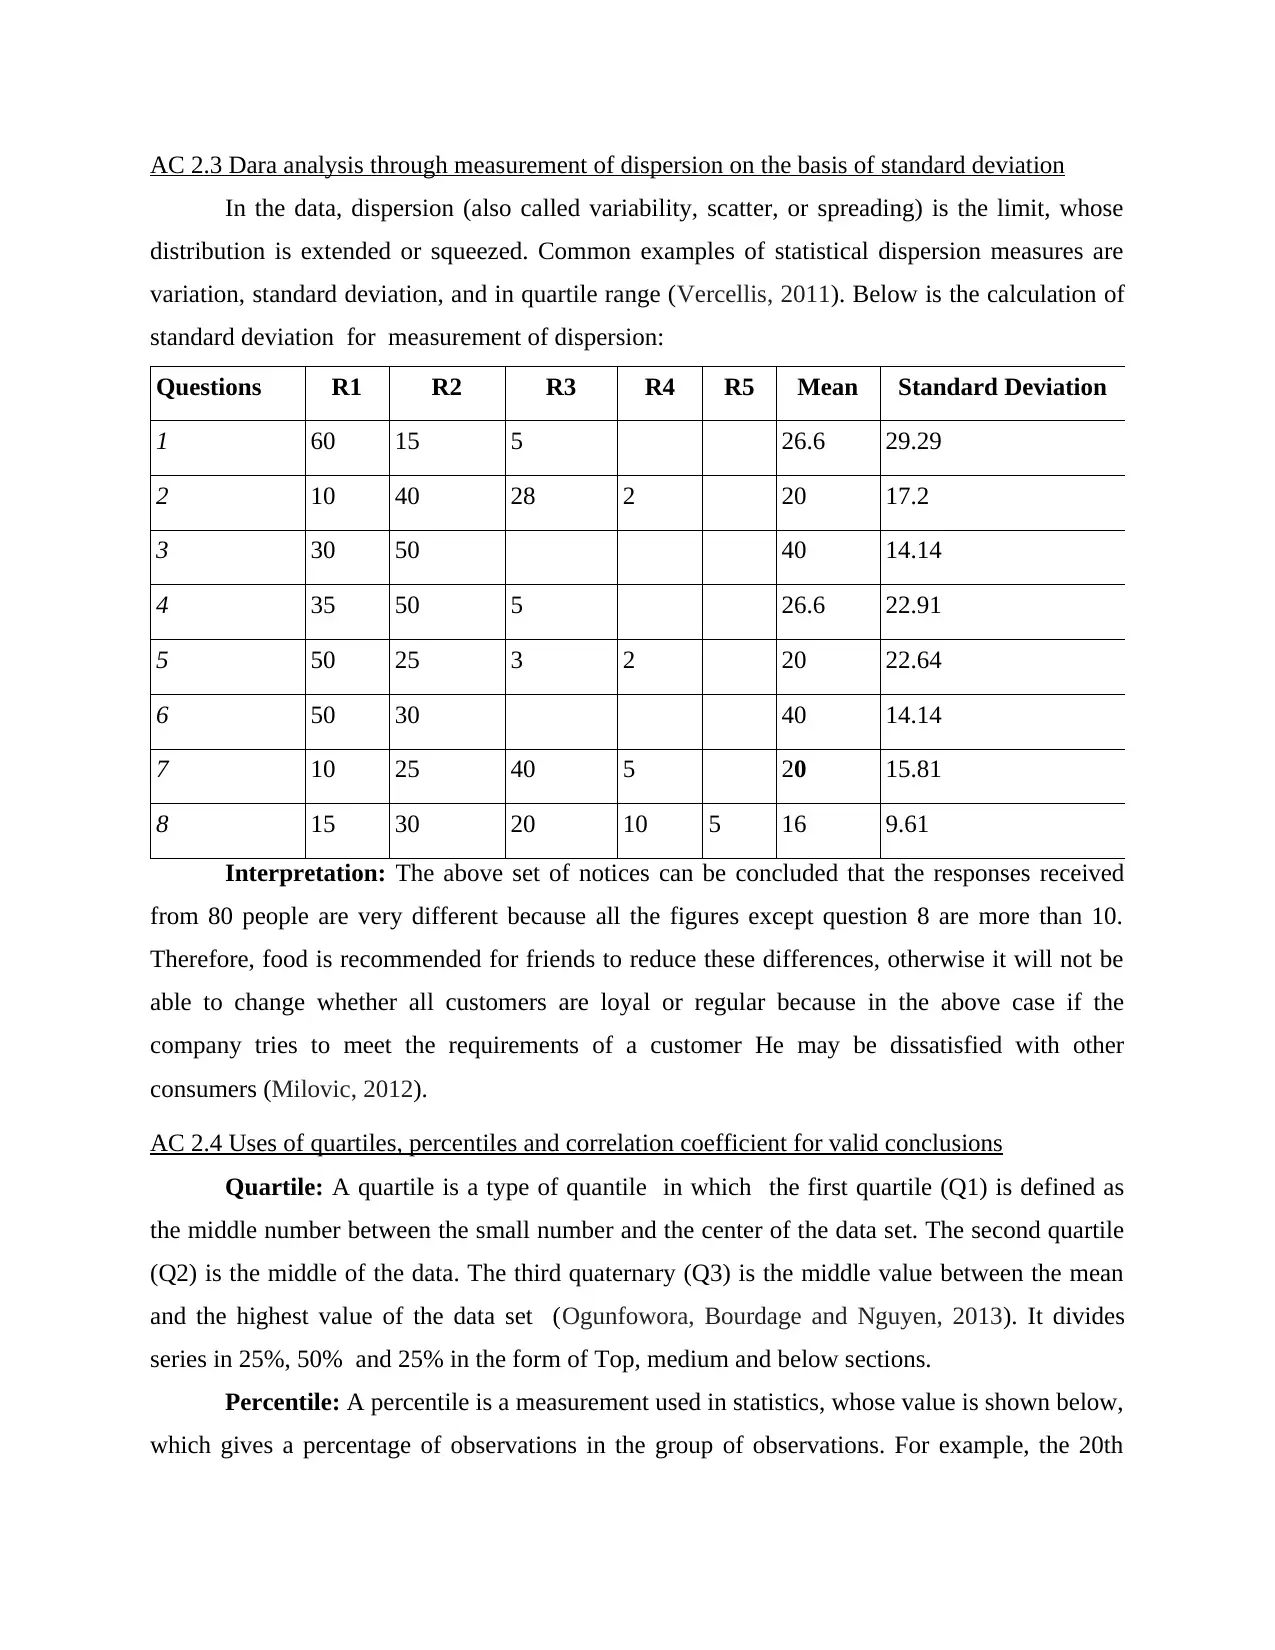
AC 2.3 Dara analysis through measurement of dispersion on the basis of standard deviation
In the data, dispersion (also called variability, scatter, or spreading) is the limit, whose
distribution is extended or squeezed. Common examples of statistical dispersion measures are
variation, standard deviation, and in quartile range (Vercellis, 2011). Below is the calculation of
standard deviation for measurement of dispersion:
Questions R1 R2 R3 R4 R5 Mean Standard Deviation
1 60 15 5 26.6 29.29
2 10 40 28 2 20 17.2
3 30 50 40 14.14
4 35 50 5 26.6 22.91
5 50 25 3 2 20 22.64
6 50 30 40 14.14
7 10 25 40 5 20 15.81
8 15 30 20 10 5 16 9.61
Interpretation: The above set of notices can be concluded that the responses received
from 80 people are very different because all the figures except question 8 are more than 10.
Therefore, food is recommended for friends to reduce these differences, otherwise it will not be
able to change whether all customers are loyal or regular because in the above case if the
company tries to meet the requirements of a customer He may be dissatisfied with other
consumers (Milovic, 2012).
AC 2.4 Uses of quartiles, percentiles and correlation coefficient for valid conclusions
Quartile: A quartile is a type of quantile in which the first quartile (Q1) is defined as
the middle number between the small number and the center of the data set. The second quartile
(Q2) is the middle of the data. The third quaternary (Q3) is the middle value between the mean
and the highest value of the data set (Ogunfowora, Bourdage and Nguyen, 2013). It divides
series in 25%, 50% and 25% in the form of Top, medium and below sections.
Percentile: A percentile is a measurement used in statistics, whose value is shown below,
which gives a percentage of observations in the group of observations. For example, the 20th
⊘ This is a preview!⊘
Do you want full access?
Subscribe today to unlock all pages.
Trusted by 1+ million students worldwide
counterfeit value (or score) is below, 20% of which can be observed (Kline, 2010). It allots rank
to a series of frequencies, percentile more than 75% means that particular response has low
occurrence while frequencies having percentile below 15% considered to be having maximum
occurrence.
Correlation Coefficient: Correlation coefficient is a measure that determines the degree
in which two variable 'movements are associated with the range of values for correlation
coefficients -1.0 to 1.0 (Griffin and Moorhead, 2011). If a calculated relationship is less than 1.0
or less than -1.0, then the mistake has been made. Correlation of -1.0 shows a full negative
relationship, while correlation of 1.0 indicates a positive positive relationship.
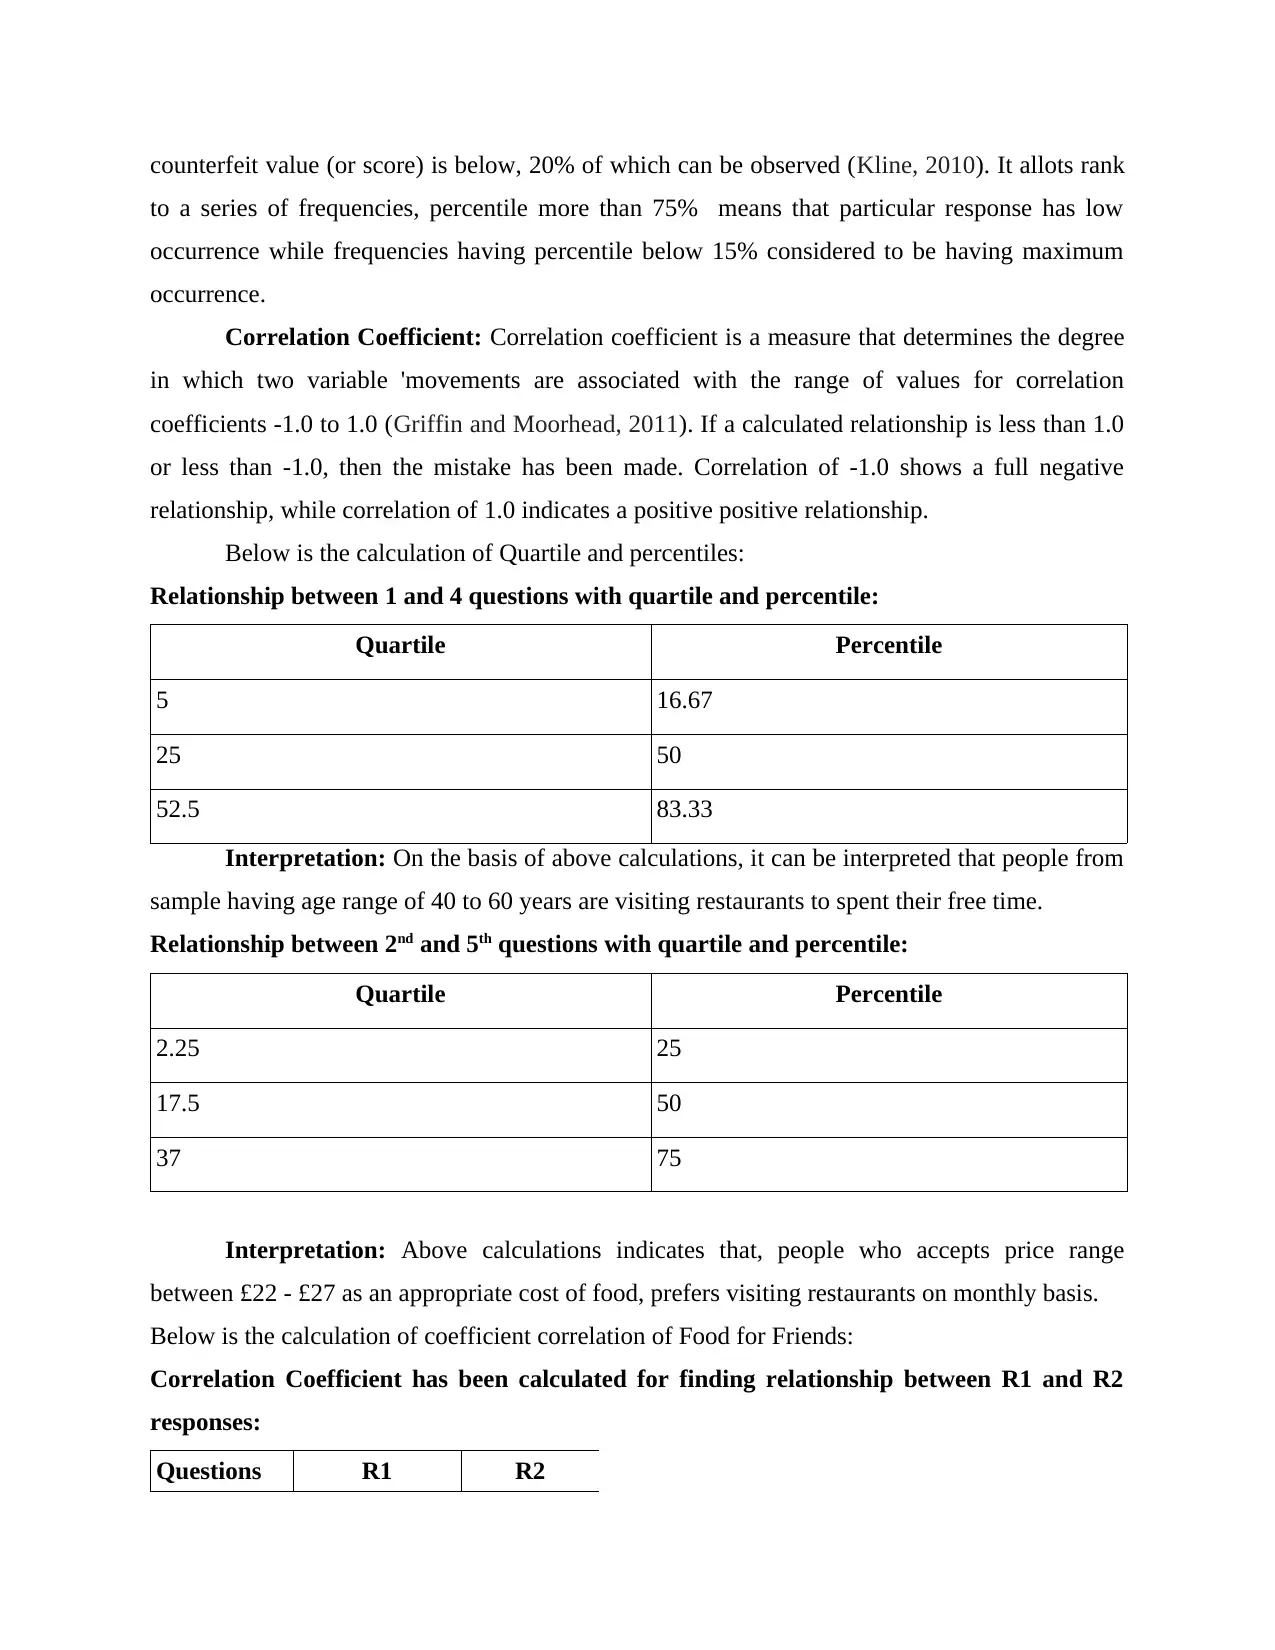
Below is the calculation of Quartile and percentiles:
Relationship between 1 and 4 questions with quartile and percentile:
Quartile Percentile
5 16.67
25 50
52.5 83.33
Interpretation: On the basis of above calculations, it can be interpreted that people from
sample having age range of 40 to 60 years are visiting restaurants to spent their free time.
Relationship between 2nd and 5th questions with quartile and percentile:
Quartile Percentile
2.25 25
17.5 50
37 75
Interpretation: Above calculations indicates that, people who accepts price range
between £22 - £27 as an appropriate cost of food, prefers visiting restaurants on monthly basis.
Below is the calculation of coefficient correlation of Food for Friends:
Correlation Coefficient has been calculated for finding relationship between R1 and R2
responses:
Questions R1 R2
to a series of frequencies, percentile more than 75% means that particular response has low
occurrence while frequencies having percentile below 15% considered to be having maximum
occurrence.
Correlation Coefficient: Correlation coefficient is a measure that determines the degree
in which two variable 'movements are associated with the range of values for correlation
coefficients -1.0 to 1.0 (Griffin and Moorhead, 2011). If a calculated relationship is less than 1.0
or less than -1.0, then the mistake has been made. Correlation of -1.0 shows a full negative
relationship, while correlation of 1.0 indicates a positive positive relationship.
Below is the calculation of Quartile and percentiles:
Relationship between 1 and 4 questions with quartile and percentile:
Quartile Percentile
5 16.67
25 50
52.5 83.33
Interpretation: On the basis of above calculations, it can be interpreted that people from
sample having age range of 40 to 60 years are visiting restaurants to spent their free time.
Relationship between 2nd and 5th questions with quartile and percentile:
Quartile Percentile
2.25 25
17.5 50
37 75
Interpretation: Above calculations indicates that, people who accepts price range
between £22 - £27 as an appropriate cost of food, prefers visiting restaurants on monthly basis.
Below is the calculation of coefficient correlation of Food for Friends:
Correlation Coefficient has been calculated for finding relationship between R1 and R2
responses:
Questions R1 R2
Paraphrase This Document
Need a fresh take? Get an instant paraphrase of this document with our AI Paraphraser
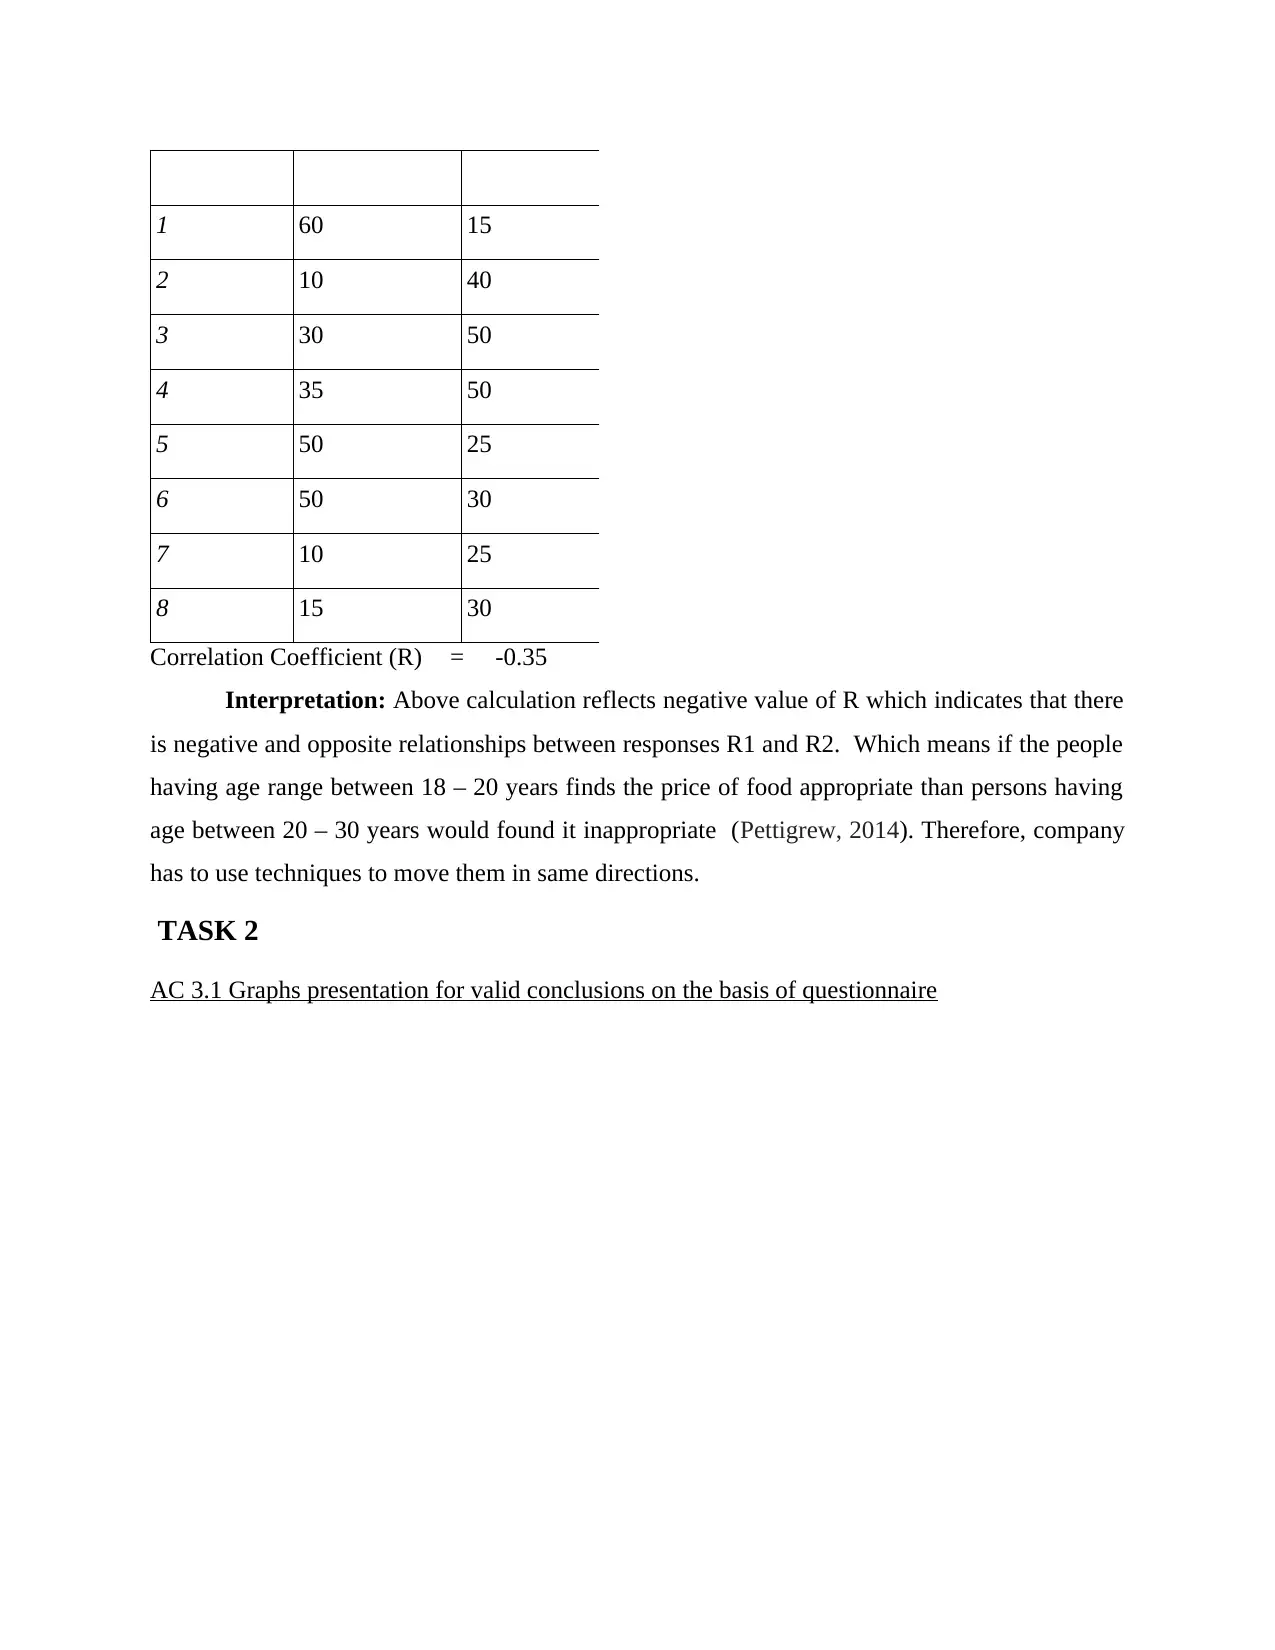
1 60 15
2 10 40
3 30 50
4 35 50
5 50 25
6 50 30
7 10 25
8 15 30
Correlation Coefficient (R) = -0.35
Interpretation: Above calculation reflects negative value of R which indicates that there
is negative and opposite relationships between responses R1 and R2. Which means if the people
having age range between 18 – 20 years finds the price of food appropriate than persons having
age between 20 – 30 years would found it inappropriate (Pettigrew, 2014). Therefore, company
has to use techniques to move them in same directions.
TASK 2
AC 3.1 Graphs presentation for valid conclusions on the basis of questionnaire
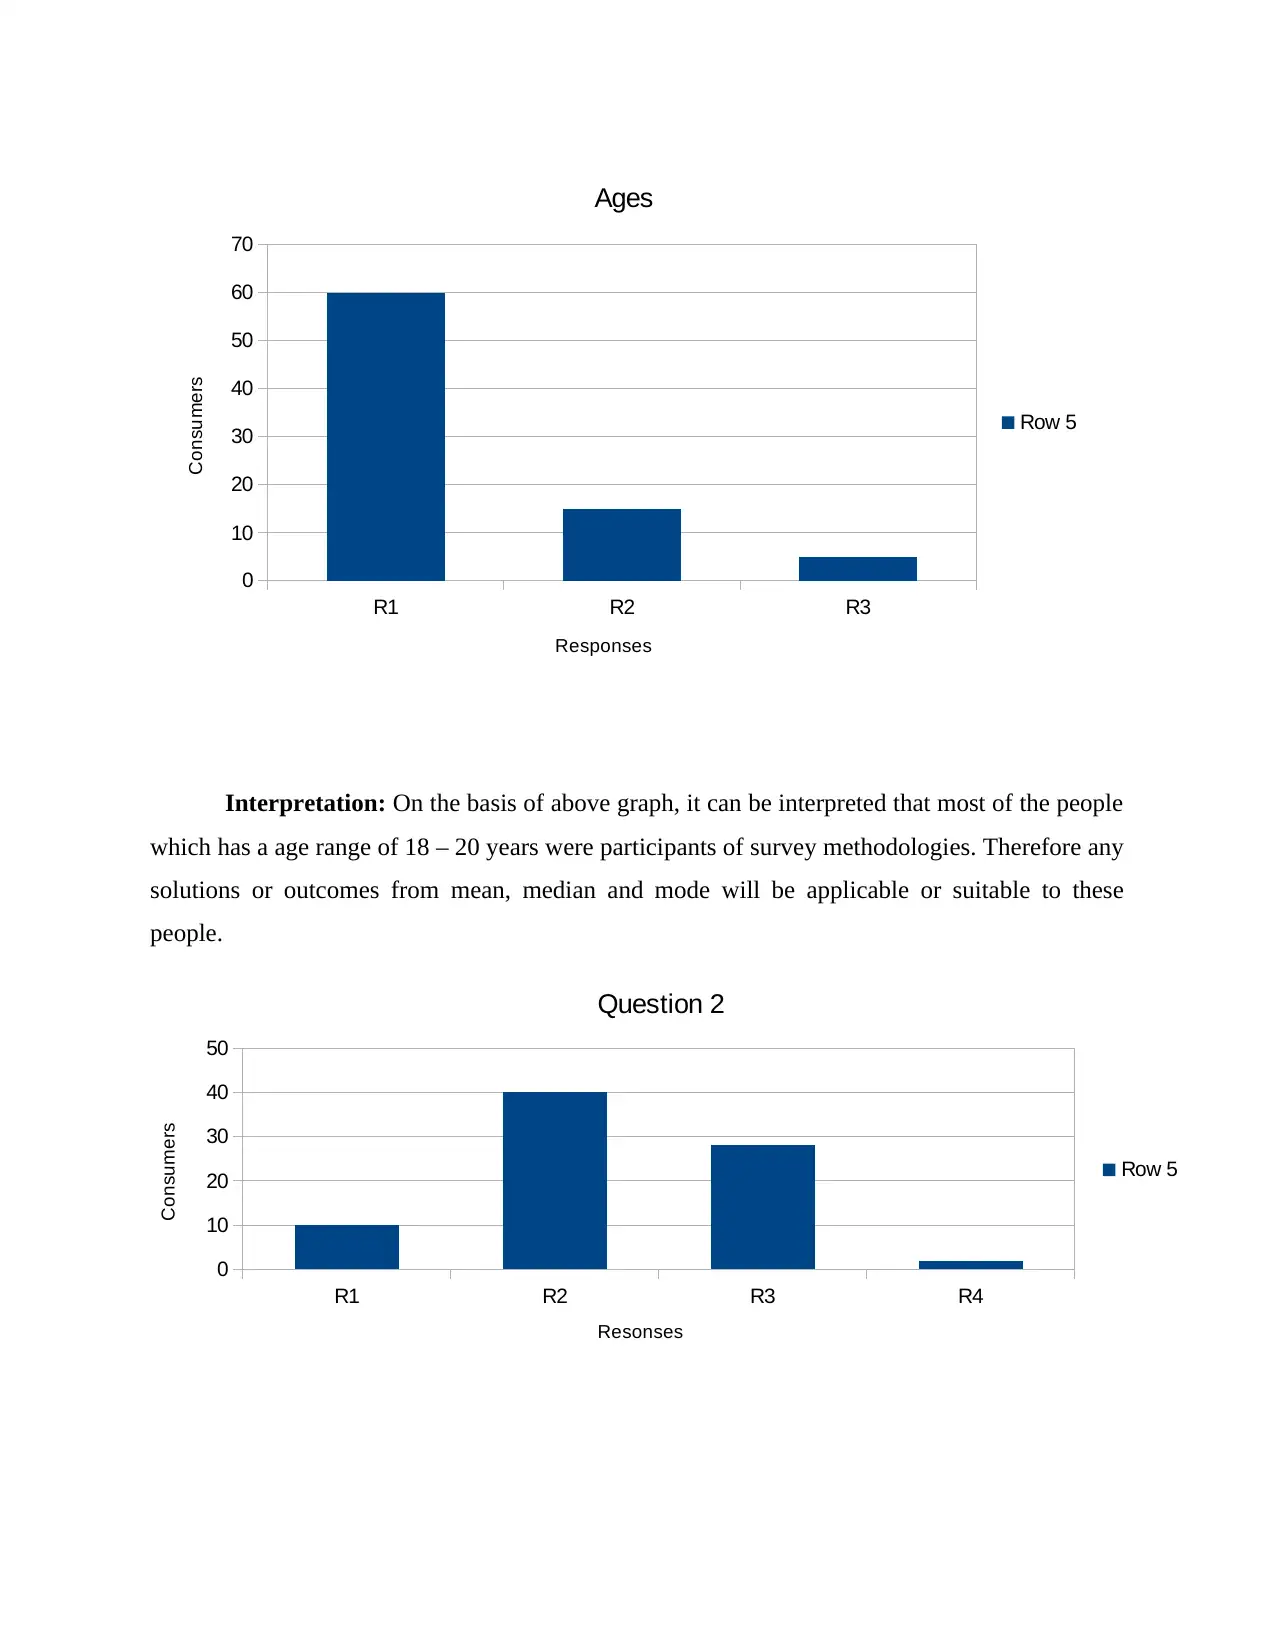
Interpretation: On the basis of above graph, it can be interpreted that most of the people
which has a age range of 18 – 20 years were participants of survey methodologies. Therefore any
solutions or outcomes from mean, median and mode will be applicable or suitable to these
people.
R1 R2 R3 R4
0
10
20
30
40
50
Question 2
Row 5
Resonses
Consumers
R1 R2 R3
0
10
20
30
40
50
60
70
Ages
Row 5
Responses
Consumers
⊘ This is a preview!⊘
Do you want full access?
Subscribe today to unlock all pages.
Trusted by 1+ million students worldwide
1 out of 20
Related Documents


Your All-in-One AI-Powered Toolkit for Academic Success.
+13062052269
info@desklib.com
Available 24*7 on WhatsApp / Email
![[object Object]](/_next/static/media/star-bottom.7253800d.svg)
Unlock your academic potential
Copyright © 2020–2026 A2Z Services. All Rights Reserved. Developed and managed by ZUCOL.