Report on Business Decision-Making for Food for Friends in London
VerifiedAdded on 2020/06/04
|23
|4711
|385
Report
AI Summary
This report details the business decision-making process for Food for Friends, a Chicago-based restaurant, planning to launch in London. It outlines the collection of primary and secondary data, including surveys, interviews, and competitor analysis. The report covers survey methodology, questionnaire design, and data analysis using mean, median, mode, standard deviation, quartiles, percentiles, and correlation coefficients. The findings reveal insights into customer preferences regarding age, frequency of visits, price sensitivity, location, and transportation, aiding in informed decision-making for the restaurant's London venture. The analysis highlights key factors influencing customer choices and provides recommendations for optimizing the restaurant's strategy, including pricing, location, and marketing approaches.

BUSINESS
DECISION-MAKING
DECISION-MAKING
Paraphrase This Document
Need a fresh take? Get an instant paraphrase of this document with our AI Paraphraser

INTRODUCTION
Business decision-making is a process by which every company passes to choose best
alternatives from various sources available (Bhattacharya, 2015). It is a vital component of
success of small business. As good decision means smart company. Hence, it includes step-by-
step business-making procedures that can help a company in making more deliberate, reasonable
and logical decisions by managing relevant informations.
Food for friends is a Chicago-based Christian Ministry that provides food and falls under
restaurant sectors. It was established in 1995 at Harold Washington College, Chicago.
Company's vision is to provide clothing and shelter to local communities. It's punch line is “No
longer go hungry”. This restaurant is usually crowded on Sunday's and Saturday's between 12pm
to 3pm.
In this report, principles and techniques of business-making to carry out planned data
collection through questionnaires and data analysis through mean, median and mode techniques
have been done. According to the given scenario, Food for friends is looking to launch its new
business in London.
The purpose of this report is to produce a report through using variety of sources through
collection of data. Report includes range of techniques to analyse the data and to produce
informations in appropriate formats for decision-making in choosing best alternatives.
TASK 1
AC 1.1 Create a plan for the collection of primary and secondary data for Food for Friends
Below is the plan for collection of primary and secondary data: Primary Data: Primary data's are those data's which are fresh and collected from the
market through survey and questionnaires (Franks, 2013). Primary data will be collected
in following ways given below:
◦ Surveys: In this method, same questions will be asked to several people of London by
email, phone and twitter.
◦ Interviews: In this method, a questionnaire will be distributed among 20-50 people at
different malls. In this questionnaire, interviewee will be given choice to answer in
Yes or No.
1
⊘ This is a preview!⊘
Do you want full access?
Subscribe today to unlock all pages.
Trusted by 1+ million students worldwide
◦ Observations: In this method, researcher will be appointed who will observe people
at different restaurants. There observations will be based on eating habits, preferences
and timings of customers at these restaurants.
The cost estimated on collecting primary data is £30,000. Secondary research: Secondary data's are those opinions or findings which are based on
other's research. Generally it is collected from primary research (Gaillard, 2014).
Secondary research will be conducted in following ways given below:
◦ Government sources: UK Government contains all data's of small and big companies.
Hence, open data such as census and geographic informations along with white
papers and reports will be avail from here.
◦ Competitors: Press releases and reports on competitors research based on restaurant
sectors will be collected from their websites, newspapers and magazines.
◦ Commercial market research organisations: Paid research will be done to get proper
result in short time. So, Mintel tool will be used for secondary research.
The cost estimated for secondary research is £3,000. Because here data will be
collected from others findings and researches which is cheaper than primary research.
AC 1.2 Survey methodology and sampling frame used in collecting primary and secondary data
Survey methodology are the process of studying sampling collected from individual units
from population (Goetsch and Davis, 2014). It is associated with survey data collection
techniques such as questionnaire making. Before deciding survey methodologies it is necessary
to select particular sampling frame. A sampling frame is a listing of all elements within a
population like University's database of all students is considered as sampling frame. Below are
the sampling frame for conducting survey:
Upscale and middle scale consumers: Data's of upscale and middle scale consumers
will be collected either through survey or government open data's.
Sector: Restaurant sector will be considered for collecting consumers data's.
Survey methodology is done through considering non-probability samples which means
probability of occurrence is not considered (Griffin and Moorhead, 2011). There are two types of
non-probability samples:
Convenience sampling: In this type of sampling, customers will be pulled out of the
population which is consumers who are visiting restaurants regularly (Hartman, 2014). In
2
Paraphrase This Document
Need a fresh take? Get an instant paraphrase of this document with our AI Paraphraser
this sampling method, first 100 customers who are visiting to a particular restaurant on
Sunday morning will be considered.
Judgement sampling: In this type of methodology, sample will be chosen by Chef of
Food for friends to find out customers preferences and requirements. Here, questionnaire
will be made on the basis of questions suggests by these Chef's.
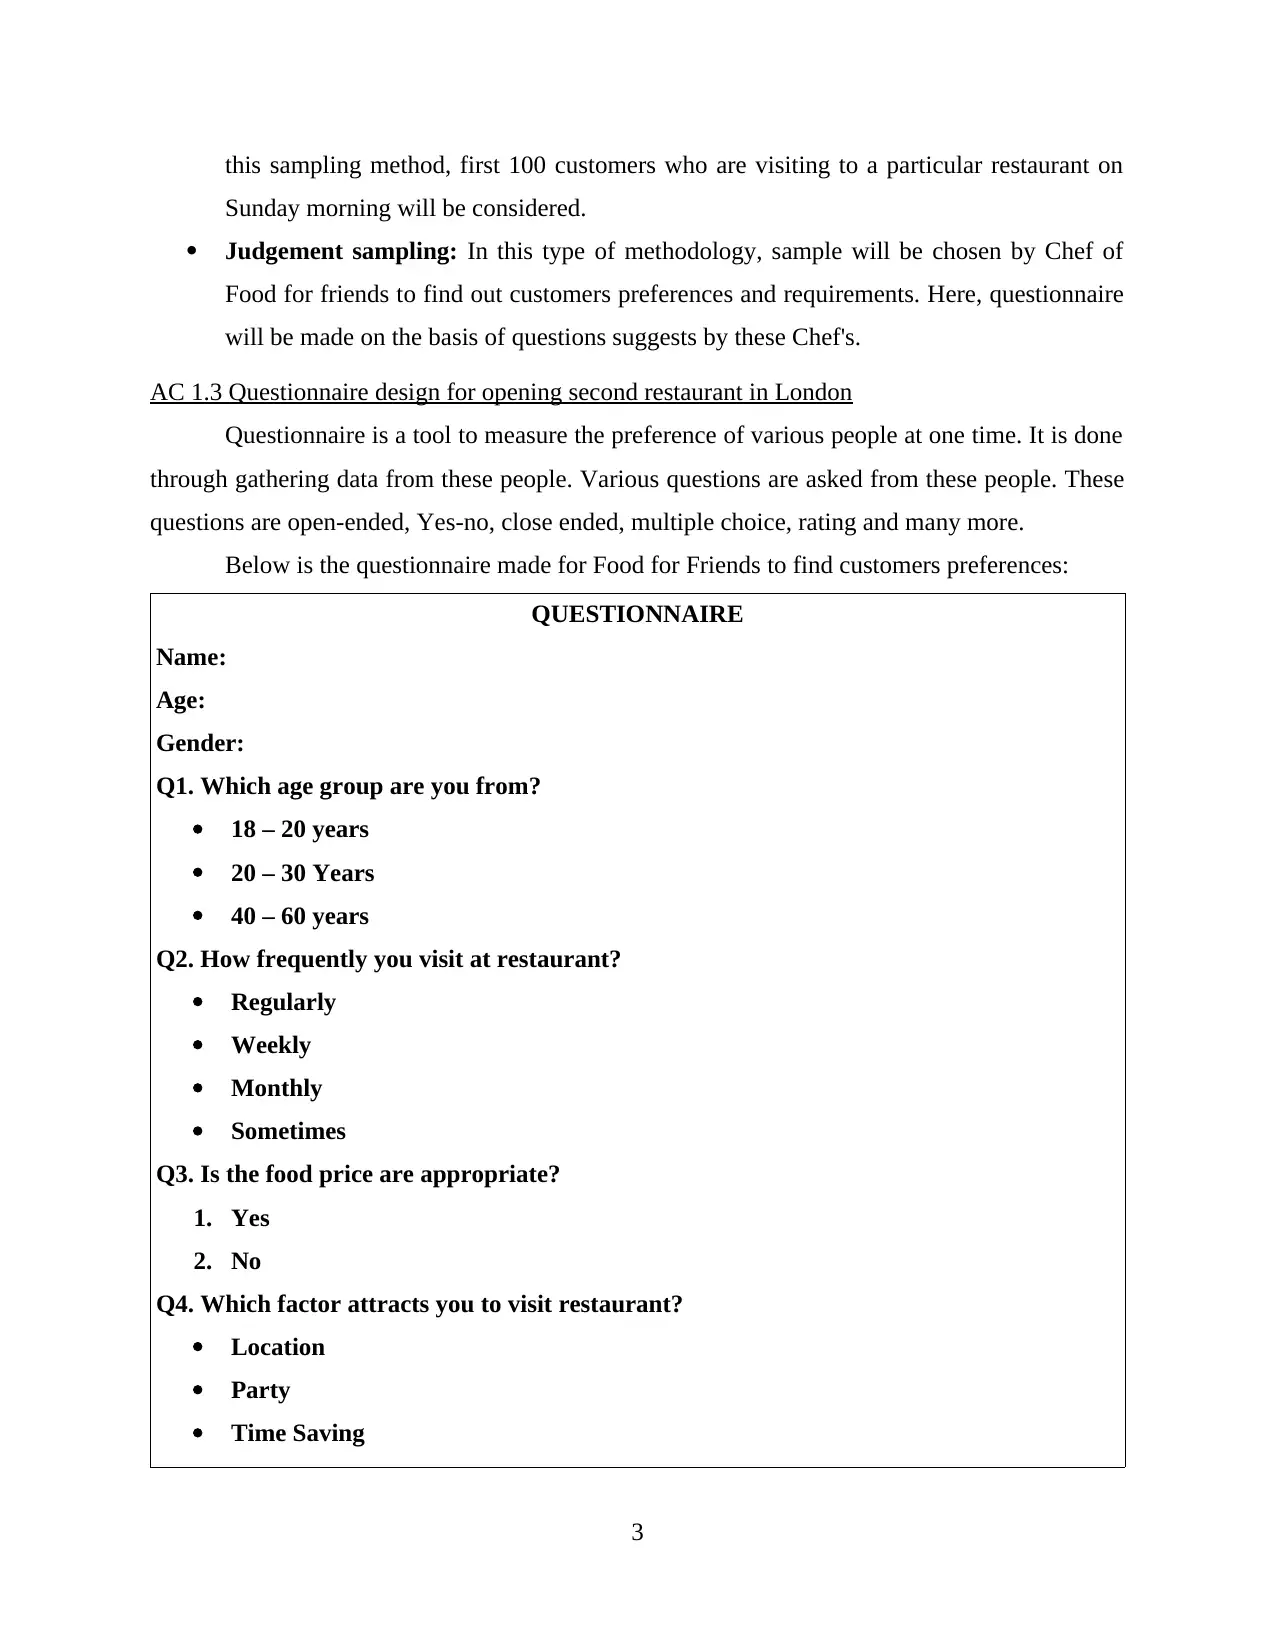
AC 1.3 Questionnaire design for opening second restaurant in London
Questionnaire is a tool to measure the preference of various people at one time. It is done
through gathering data from these people. Various questions are asked from these people. These
questions are open-ended, Yes-no, close ended, multiple choice, rating and many more.
Below is the questionnaire made for Food for Friends to find customers preferences:
QUESTIONNAIRE
Name:
Age:
Gender:
Q1. Which age group are you from?
18 – 20 years
20 – 30 Years
40 – 60 years
Q2. How frequently you visit at restaurant?
Regularly
Weekly
Monthly
Sometimes
Q3. Is the food price are appropriate?
1. Yes
2. No
Q4. Which factor attracts you to visit restaurant?
Location
Party
Time Saving
3
Sunday morning will be considered.
Judgement sampling: In this type of methodology, sample will be chosen by Chef of
Food for friends to find out customers preferences and requirements. Here, questionnaire
will be made on the basis of questions suggests by these Chef's.
AC 1.3 Questionnaire design for opening second restaurant in London
Questionnaire is a tool to measure the preference of various people at one time. It is done
through gathering data from these people. Various questions are asked from these people. These
questions are open-ended, Yes-no, close ended, multiple choice, rating and many more.
Below is the questionnaire made for Food for Friends to find customers preferences:
QUESTIONNAIRE
Name:
Age:
Gender:
Q1. Which age group are you from?
18 – 20 years
20 – 30 Years
40 – 60 years
Q2. How frequently you visit at restaurant?
Regularly
Weekly
Monthly
Sometimes
Q3. Is the food price are appropriate?
1. Yes
2. No
Q4. Which factor attracts you to visit restaurant?
Location
Party
Time Saving
3
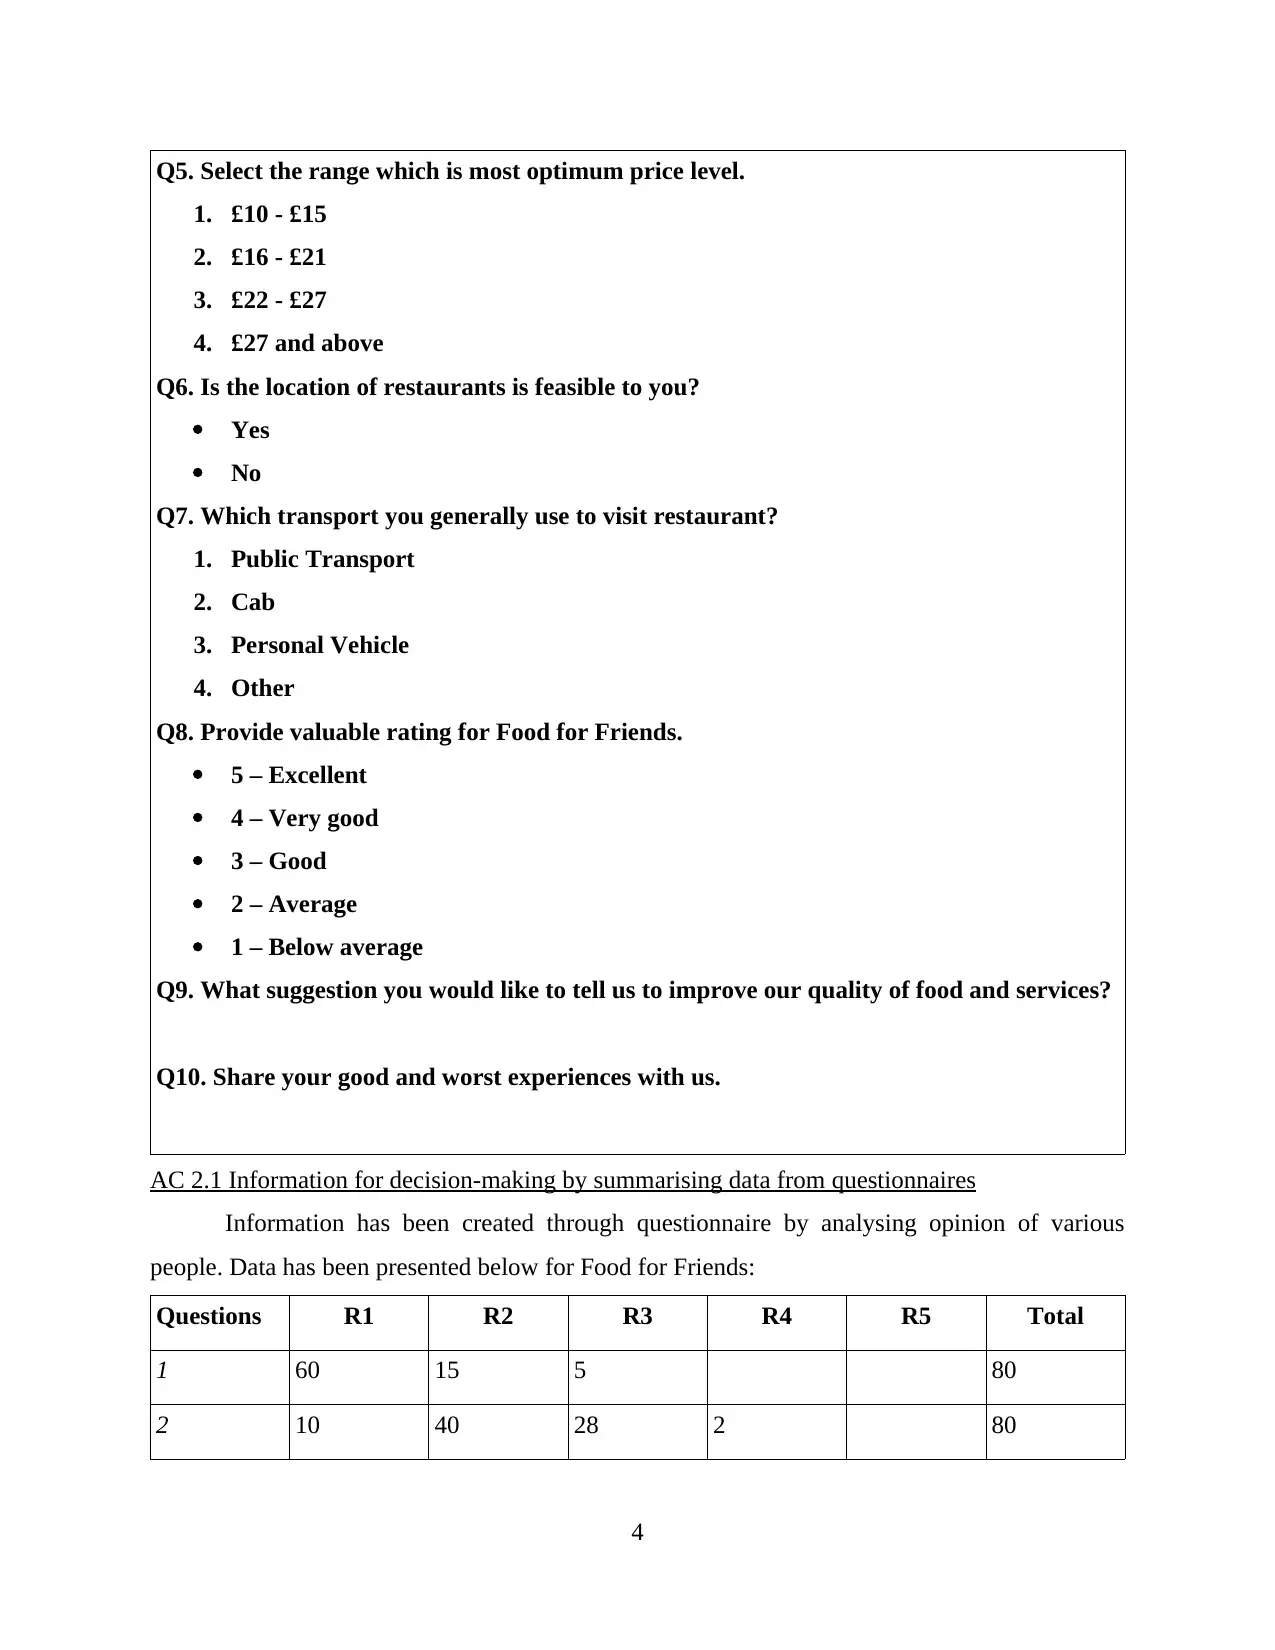
Q5. Select the range which is most optimum price level.
1. £10 - £15
2. £16 - £21
3. £22 - £27
4. £27 and above
Q6. Is the location of restaurants is feasible to you?
Yes
No
Q7. Which transport you generally use to visit restaurant?
1. Public Transport
2. Cab
3. Personal Vehicle
4. Other
Q8. Provide valuable rating for Food for Friends.
5 – Excellent
4 – Very good
3 – Good
2 – Average
1 – Below average
Q9. What suggestion you would like to tell us to improve our quality of food and services?
Q10. Share your good and worst experiences with us.
AC 2.1 Information for decision-making by summarising data from questionnaires
Information has been created through questionnaire by analysing opinion of various
people. Data has been presented below for Food for Friends:
Questions R1 R2 R3 R4 R5 Total
1 60 15 5 80
2 10 40 28 2 80
4
⊘ This is a preview!⊘
Do you want full access?
Subscribe today to unlock all pages.
Trusted by 1+ million students worldwide
3 30 50 80
4 35 50 5 80
5 50 25 3 2 80
6 50 30 80
7 10 25 40 5 80
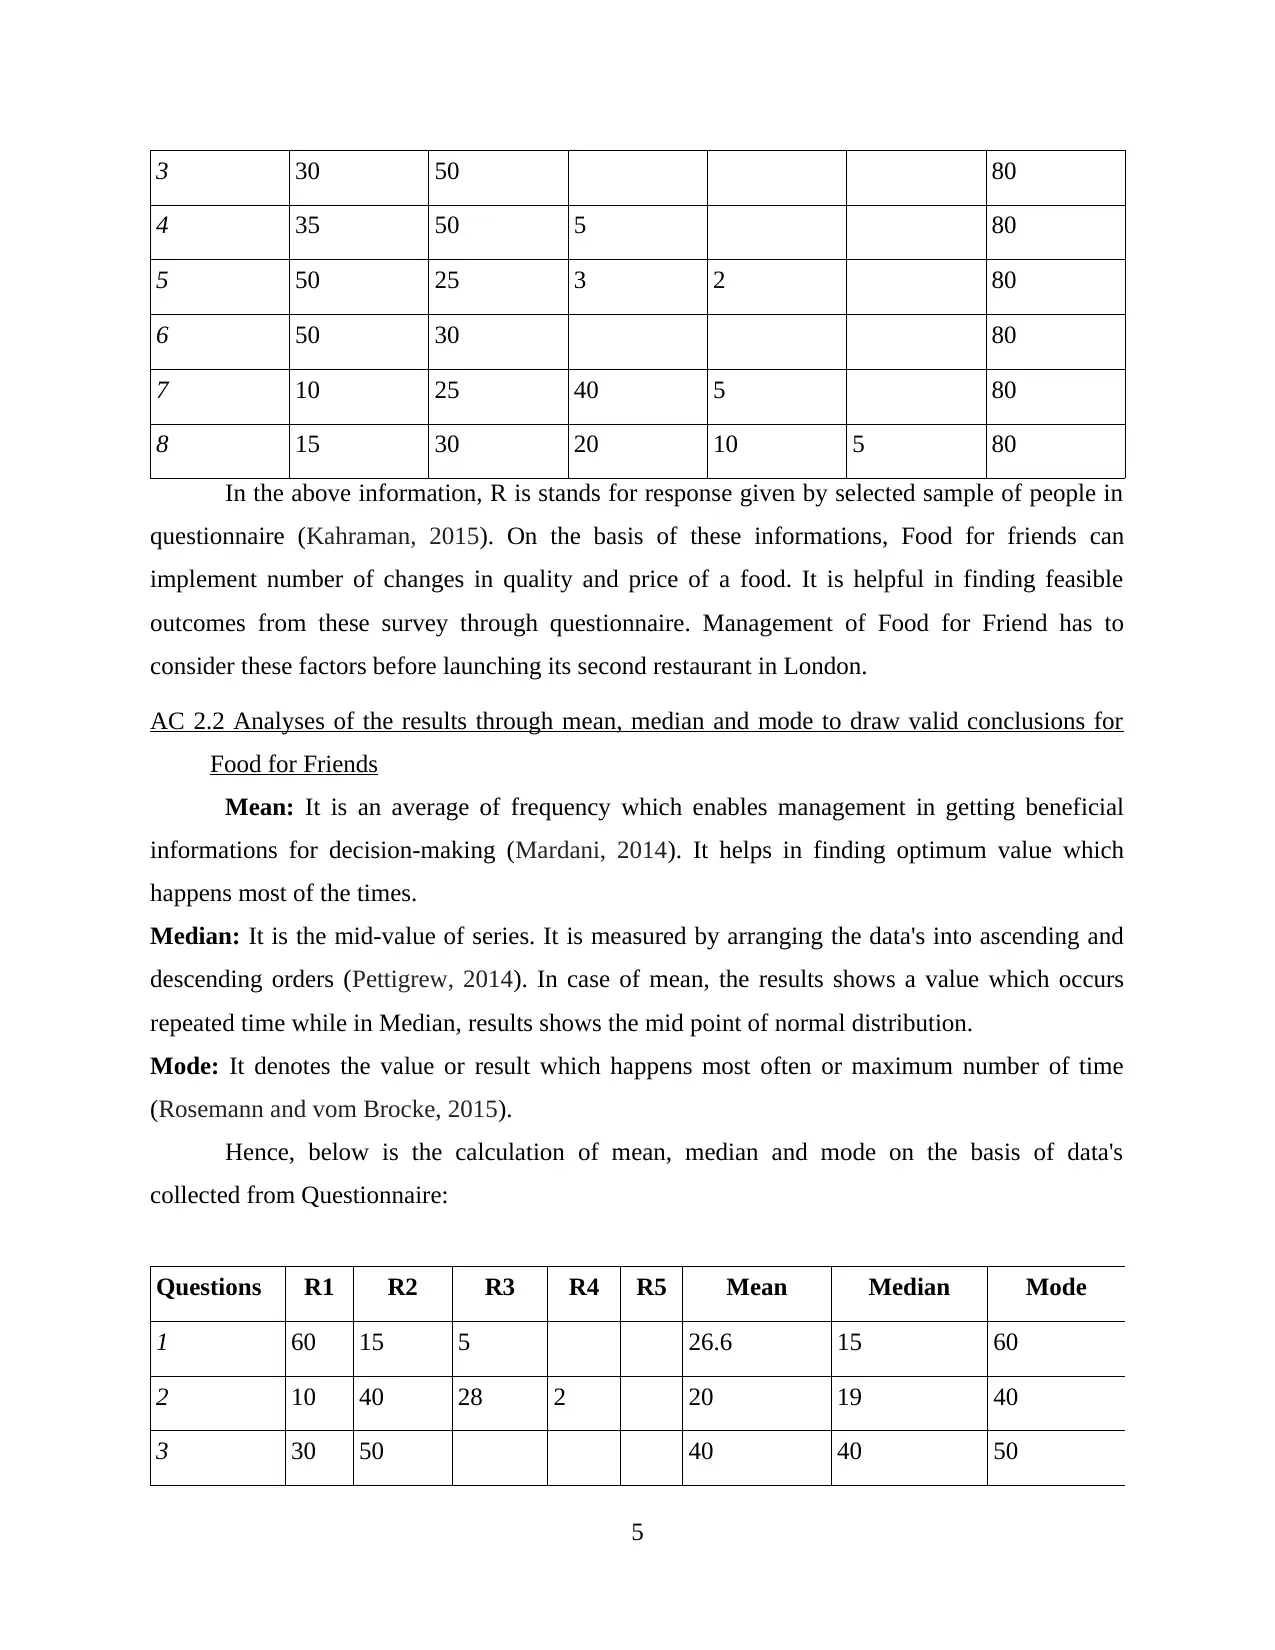
8 15 30 20 10 5 80
In the above information, R is stands for response given by selected sample of people in
questionnaire (Kahraman, 2015). On the basis of these informations, Food for friends can
implement number of changes in quality and price of a food. It is helpful in finding feasible
outcomes from these survey through questionnaire. Management of Food for Friend has to
consider these factors before launching its second restaurant in London.
AC 2.2 Analyses of the results through mean, median and mode to draw valid conclusions for
Food for Friends
Mean: It is an average of frequency which enables management in getting beneficial
informations for decision-making (Mardani, 2014). It helps in finding optimum value which
happens most of the times.
Median: It is the mid-value of series. It is measured by arranging the data's into ascending and
descending orders (Pettigrew, 2014). In case of mean, the results shows a value which occurs
repeated time while in Median, results shows the mid point of normal distribution.
Mode: It denotes the value or result which happens most often or maximum number of time
(Rosemann and vom Brocke, 2015).
Hence, below is the calculation of mean, median and mode on the basis of data's
collected from Questionnaire:
Questions R1 R2 R3 R4 R5 Mean Median Mode
1 60 15 5 26.6 15 60
2 10 40 28 2 20 19 40
3 30 50 40 40 50
5
4 35 50 5 80
5 50 25 3 2 80
6 50 30 80
7 10 25 40 5 80
8 15 30 20 10 5 80
In the above information, R is stands for response given by selected sample of people in
questionnaire (Kahraman, 2015). On the basis of these informations, Food for friends can
implement number of changes in quality and price of a food. It is helpful in finding feasible
outcomes from these survey through questionnaire. Management of Food for Friend has to
consider these factors before launching its second restaurant in London.
AC 2.2 Analyses of the results through mean, median and mode to draw valid conclusions for
Food for Friends
Mean: It is an average of frequency which enables management in getting beneficial
informations for decision-making (Mardani, 2014). It helps in finding optimum value which
happens most of the times.
Median: It is the mid-value of series. It is measured by arranging the data's into ascending and
descending orders (Pettigrew, 2014). In case of mean, the results shows a value which occurs
repeated time while in Median, results shows the mid point of normal distribution.
Mode: It denotes the value or result which happens most often or maximum number of time
(Rosemann and vom Brocke, 2015).
Hence, below is the calculation of mean, median and mode on the basis of data's
collected from Questionnaire:
Questions R1 R2 R3 R4 R5 Mean Median Mode
1 60 15 5 26.6 15 60
2 10 40 28 2 20 19 40
3 30 50 40 40 50
5
Paraphrase This Document
Need a fresh take? Get an instant paraphrase of this document with our AI Paraphraser
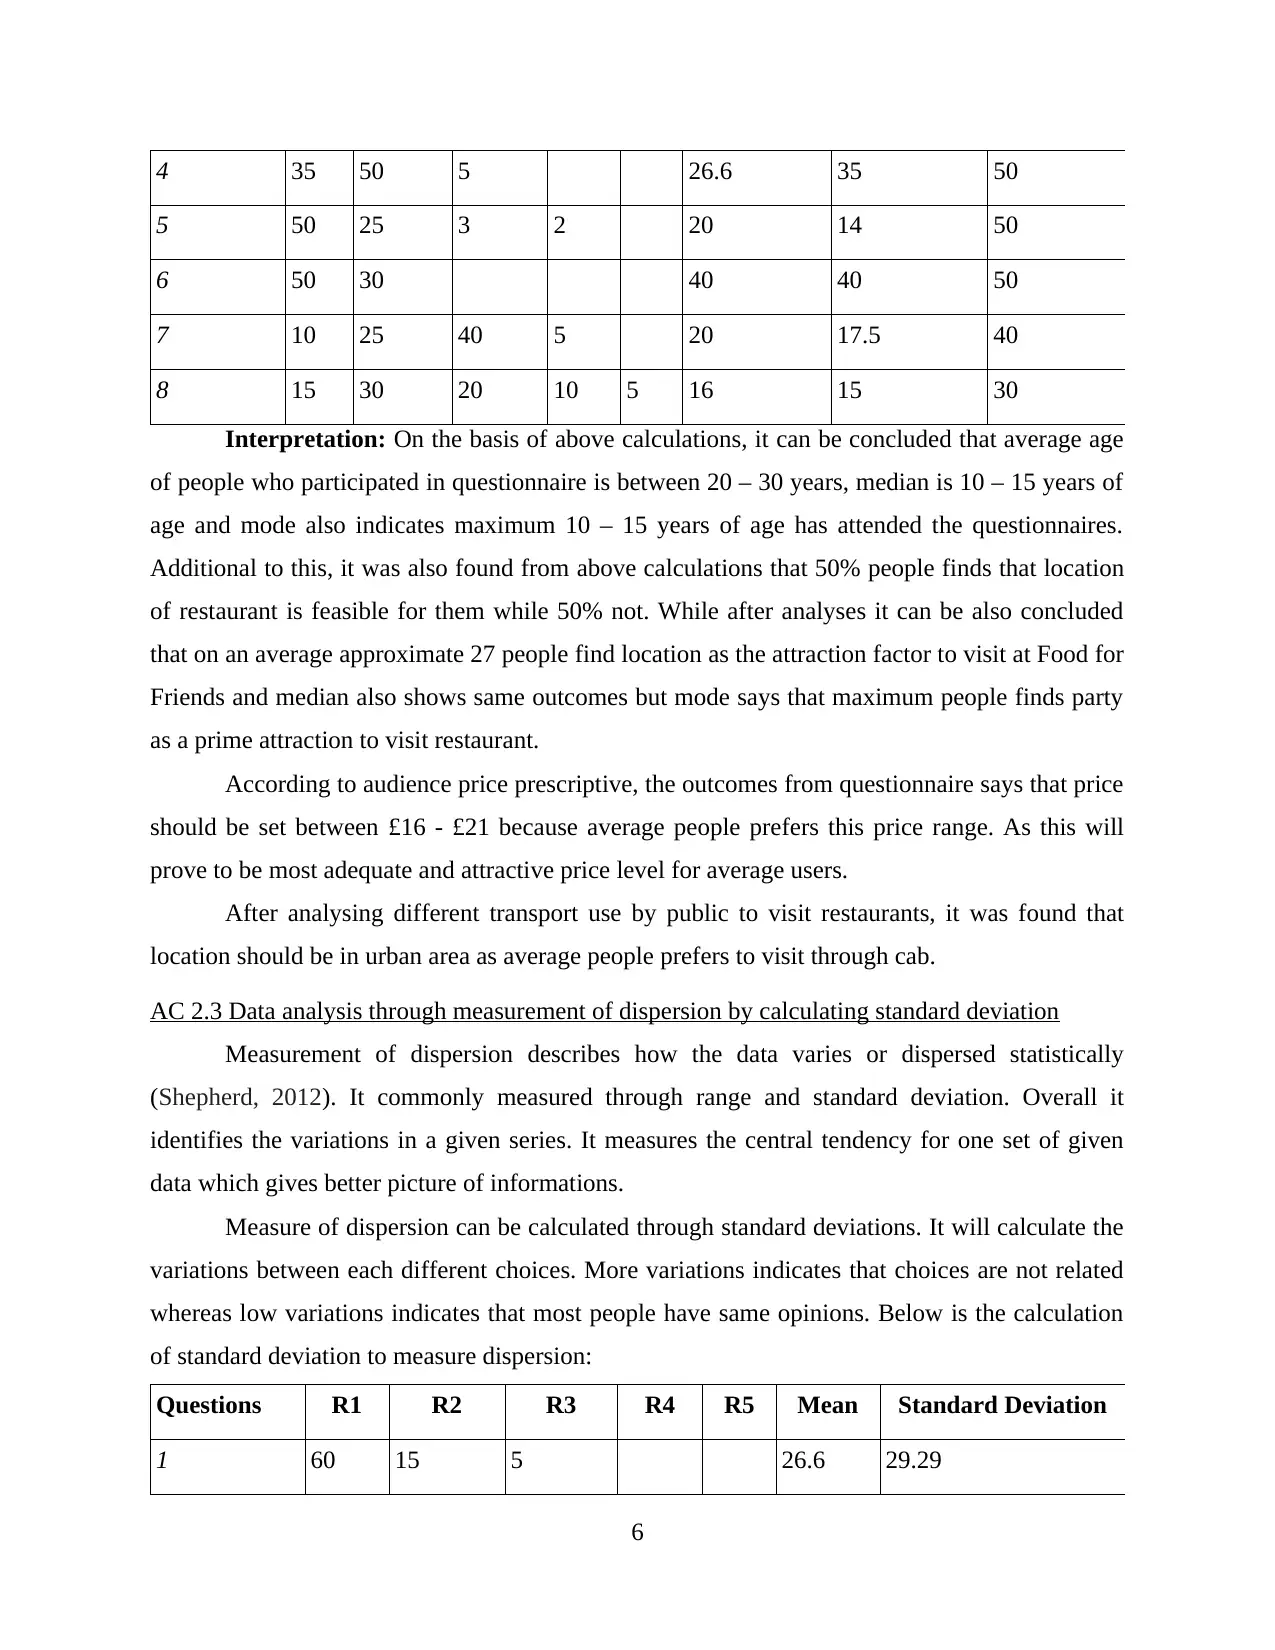
4 35 50 5 26.6 35 50
5 50 25 3 2 20 14 50
6 50 30 40 40 50
7 10 25 40 5 20 17.5 40
8 15 30 20 10 5 16 15 30
Interpretation: On the basis of above calculations, it can be concluded that average age
of people who participated in questionnaire is between 20 – 30 years, median is 10 – 15 years of
age and mode also indicates maximum 10 – 15 years of age has attended the questionnaires.
Additional to this, it was also found from above calculations that 50% people finds that location
of restaurant is feasible for them while 50% not. While after analyses it can be also concluded
that on an average approximate 27 people find location as the attraction factor to visit at Food for
Friends and median also shows same outcomes but mode says that maximum people finds party
as a prime attraction to visit restaurant.
According to audience price prescriptive, the outcomes from questionnaire says that price
should be set between £16 - £21 because average people prefers this price range. As this will
prove to be most adequate and attractive price level for average users.
After analysing different transport use by public to visit restaurants, it was found that
location should be in urban area as average people prefers to visit through cab.
AC 2.3 Data analysis through measurement of dispersion by calculating standard deviation
Measurement of dispersion describes how the data varies or dispersed statistically
(Shepherd, 2012). It commonly measured through range and standard deviation. Overall it
identifies the variations in a given series. It measures the central tendency for one set of given
data which gives better picture of informations.
Measure of dispersion can be calculated through standard deviations. It will calculate the
variations between each different choices. More variations indicates that choices are not related
whereas low variations indicates that most people have same opinions. Below is the calculation
of standard deviation to measure dispersion:
Questions R1 R2 R3 R4 R5 Mean Standard Deviation
1 60 15 5 26.6 29.29
6
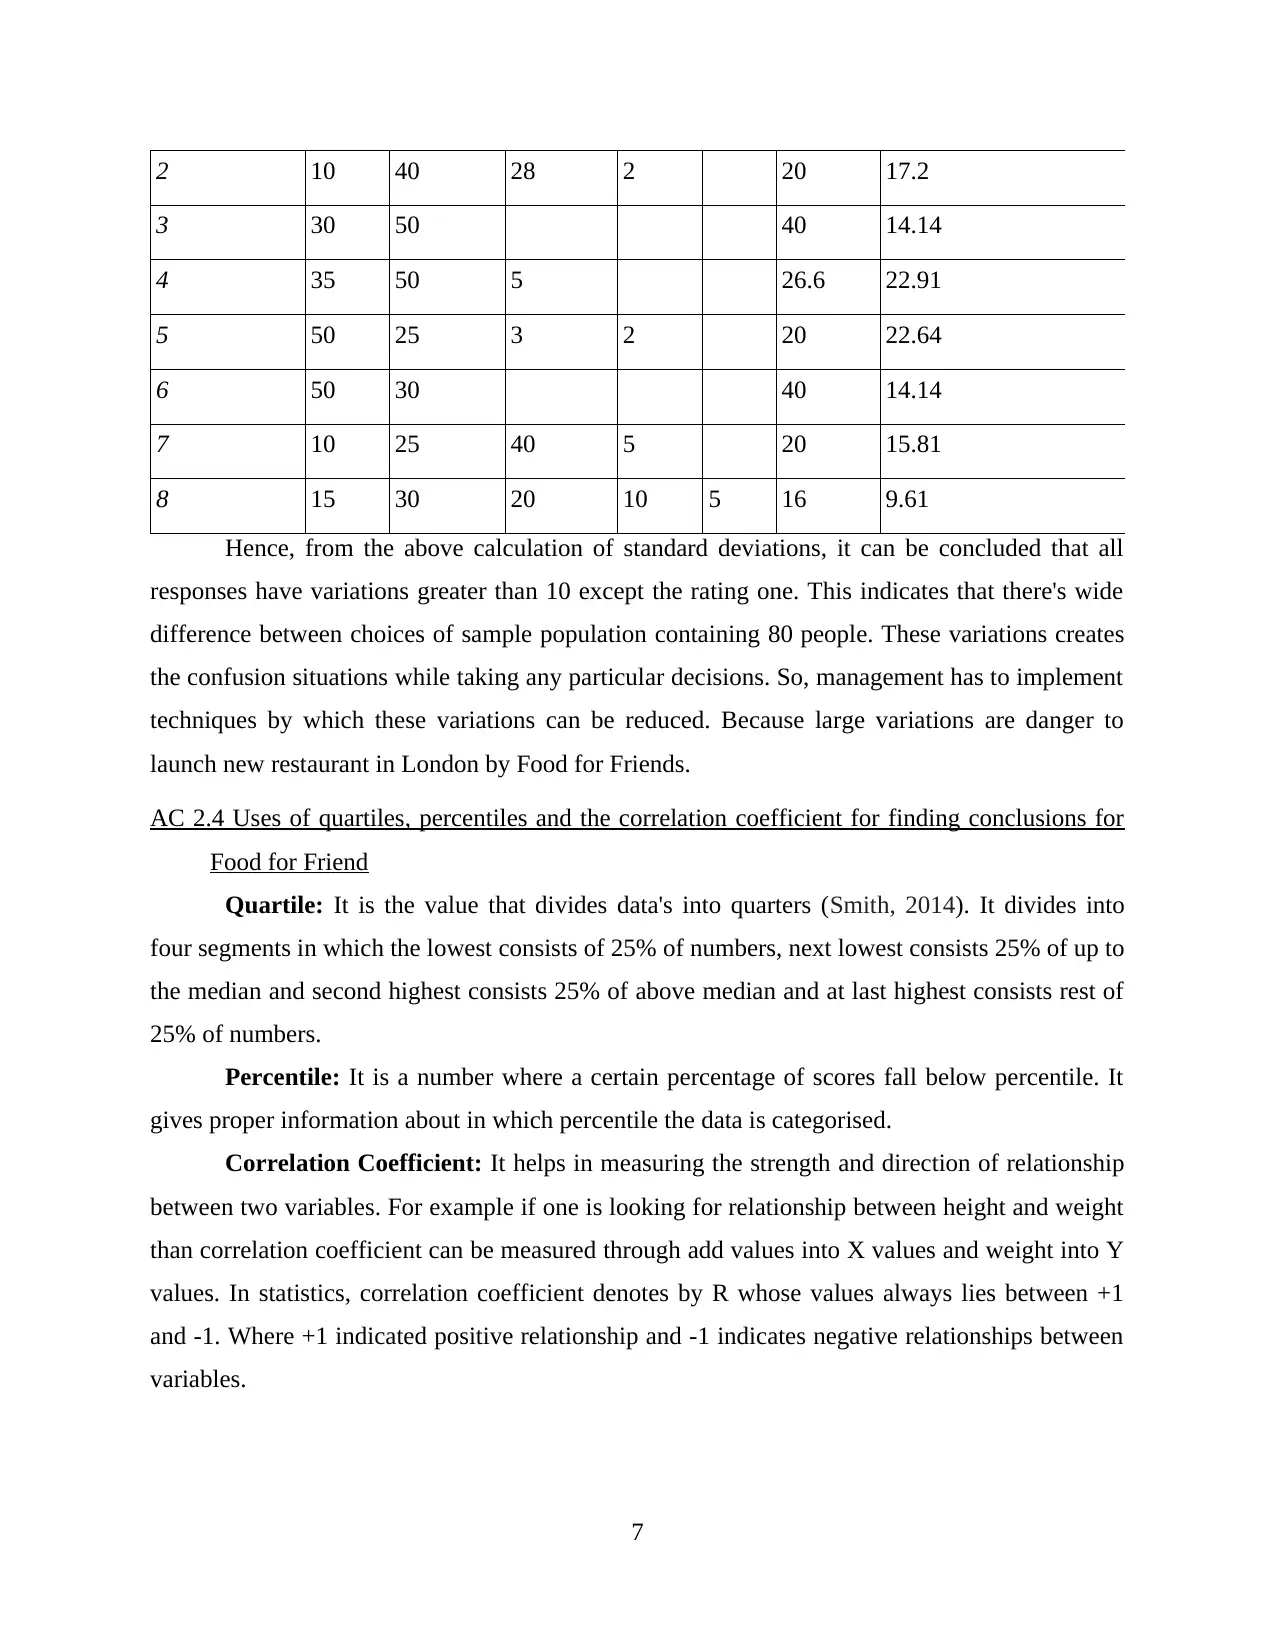
2 10 40 28 2 20 17.2
3 30 50 40 14.14
4 35 50 5 26.6 22.91
5 50 25 3 2 20 22.64
6 50 30 40 14.14
7 10 25 40 5 20 15.81
8 15 30 20 10 5 16 9.61
Hence, from the above calculation of standard deviations, it can be concluded that all
responses have variations greater than 10 except the rating one. This indicates that there's wide
difference between choices of sample population containing 80 people. These variations creates
the confusion situations while taking any particular decisions. So, management has to implement
techniques by which these variations can be reduced. Because large variations are danger to
launch new restaurant in London by Food for Friends.
AC 2.4 Uses of quartiles, percentiles and the correlation coefficient for finding conclusions for
Food for Friend
Quartile: It is the value that divides data's into quarters (Smith, 2014). It divides into
four segments in which the lowest consists of 25% of numbers, next lowest consists 25% of up to
the median and second highest consists 25% of above median and at last highest consists rest of
25% of numbers.
Percentile: It is a number where a certain percentage of scores fall below percentile. It
gives proper information about in which percentile the data is categorised.
Correlation Coefficient: It helps in measuring the strength and direction of relationship
between two variables. For example if one is looking for relationship between height and weight
than correlation coefficient can be measured through add values into X values and weight into Y
values. In statistics, correlation coefficient denotes by R whose values always lies between +1
and -1. Where +1 indicated positive relationship and -1 indicates negative relationships between
variables.
7
⊘ This is a preview!⊘
Do you want full access?
Subscribe today to unlock all pages.
Trusted by 1+ million students worldwide
Food for friends has to taken into account these tools to take appropriate decision for
their future project which is opening second restaurant at London. It helps management in
making appropriate and meaningful conclusion from these tools.
Quartile, percentile and correlation coefficient has been calculated by considering age,
price, frequently visit and factors of attraction as a basis. Hence, calculations has been done by
taking questions 1st, 2nd, 4th and 5th as a base.
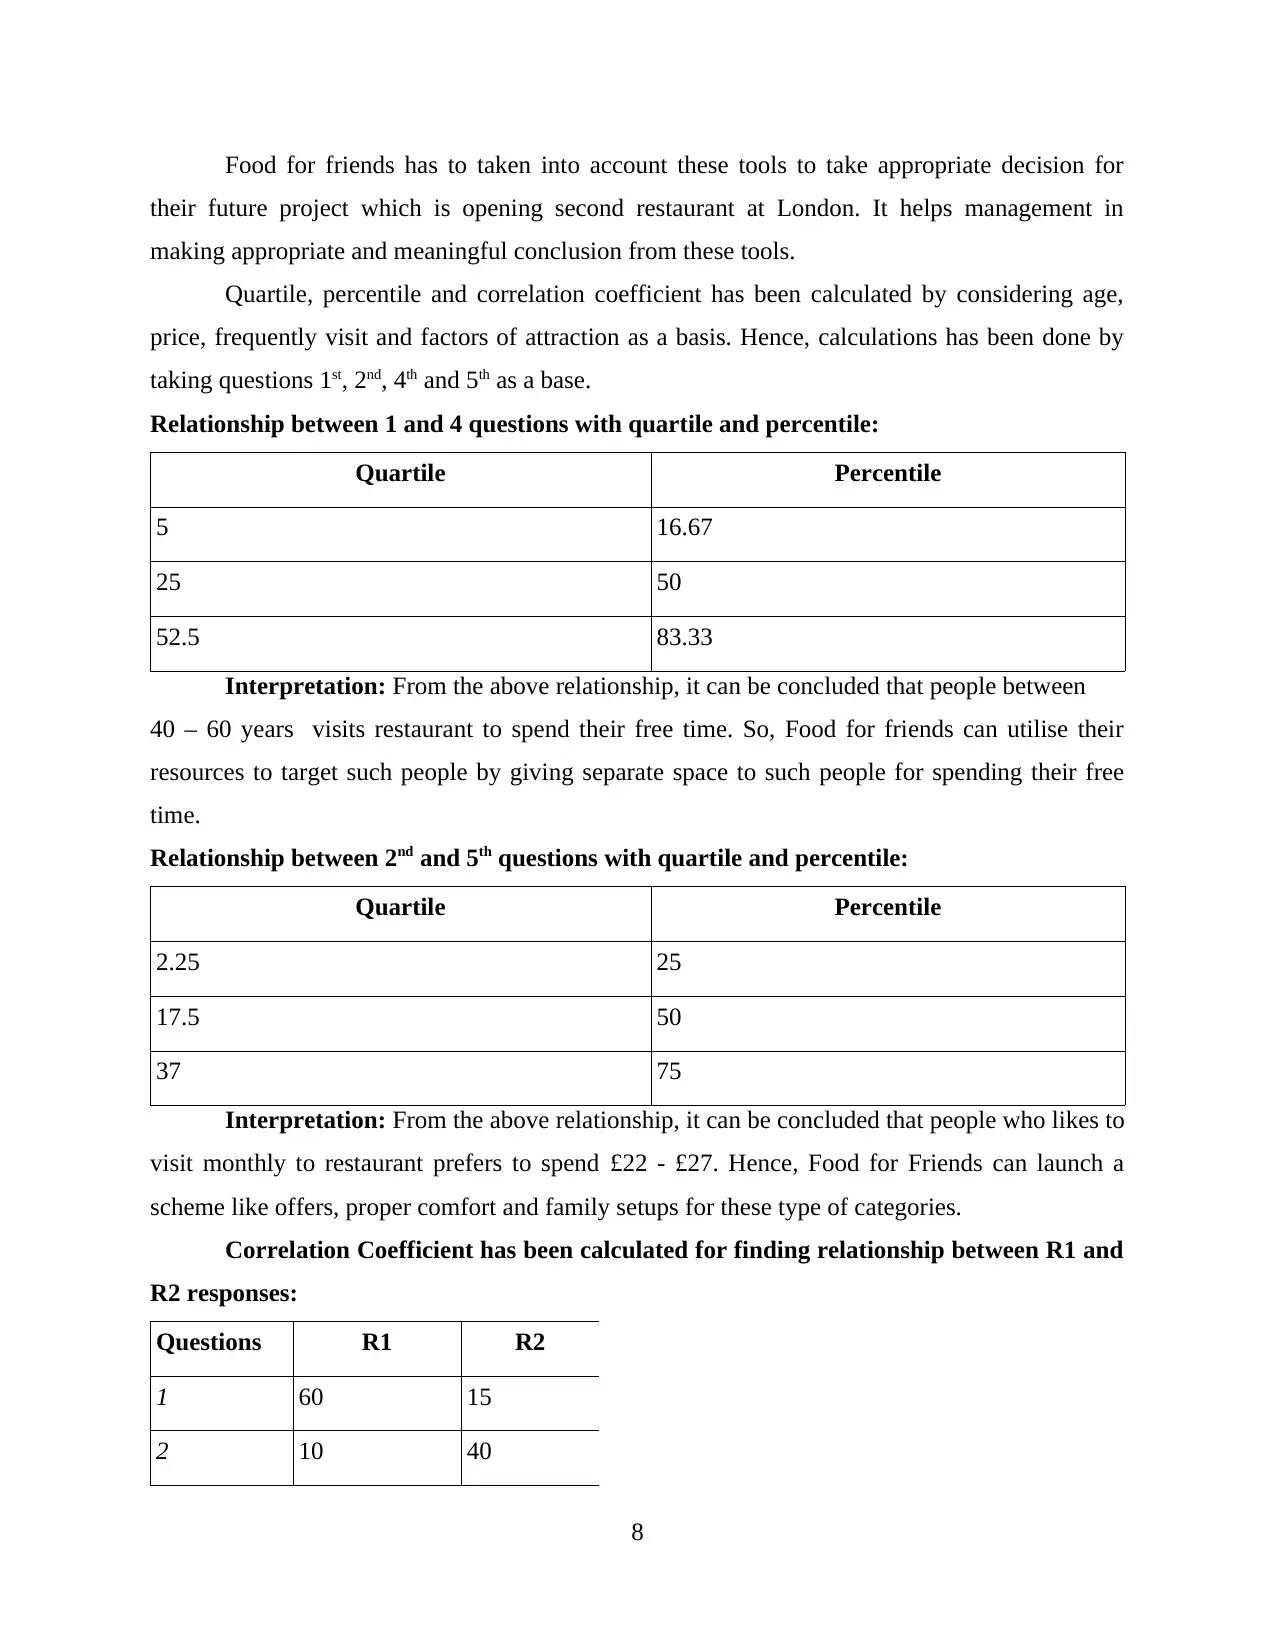
Relationship between 1 and 4 questions with quartile and percentile:
Quartile Percentile
5 16.67
25 50
52.5 83.33
Interpretation: From the above relationship, it can be concluded that people between
40 – 60 years visits restaurant to spend their free time. So, Food for friends can utilise their
resources to target such people by giving separate space to such people for spending their free
time.
Relationship between 2nd and 5th questions with quartile and percentile:
Quartile Percentile
2.25 25
17.5 50
37 75
Interpretation: From the above relationship, it can be concluded that people who likes to
visit monthly to restaurant prefers to spend £22 - £27. Hence, Food for Friends can launch a
scheme like offers, proper comfort and family setups for these type of categories.
Correlation Coefficient has been calculated for finding relationship between R1 and
R2 responses:
Questions R1 R2
1 60 15
2 10 40
8
their future project which is opening second restaurant at London. It helps management in
making appropriate and meaningful conclusion from these tools.
Quartile, percentile and correlation coefficient has been calculated by considering age,
price, frequently visit and factors of attraction as a basis. Hence, calculations has been done by
taking questions 1st, 2nd, 4th and 5th as a base.
Relationship between 1 and 4 questions with quartile and percentile:
Quartile Percentile
5 16.67
25 50
52.5 83.33
Interpretation: From the above relationship, it can be concluded that people between
40 – 60 years visits restaurant to spend their free time. So, Food for friends can utilise their
resources to target such people by giving separate space to such people for spending their free
time.
Relationship between 2nd and 5th questions with quartile and percentile:
Quartile Percentile
2.25 25
17.5 50
37 75
Interpretation: From the above relationship, it can be concluded that people who likes to
visit monthly to restaurant prefers to spend £22 - £27. Hence, Food for Friends can launch a
scheme like offers, proper comfort and family setups for these type of categories.
Correlation Coefficient has been calculated for finding relationship between R1 and
R2 responses:
Questions R1 R2
1 60 15
2 10 40
8
Paraphrase This Document
Need a fresh take? Get an instant paraphrase of this document with our AI Paraphraser
3 30 50
4 35 50
5 50 25
6 50 30
7 10 25
8 15 30
Correlation Coefficient(R) = -0.35
Interpretation: Hence, the value of r is -0.35 which is a negative value. This indicates
that there's negative relationship between response 1 and response 2. This also means that both
variables moves in opposite directions. If one variable increase other variable decreases. Both
people are opposite in their opinion. Therefore, Food for friends has to adapt certain methods to
move them in same directions to achieve success in their new business.
TASK 2
AC 3.1 Graphs presentation with conclusions based on questionnaire
9
R1 R2 R3
0
10
20
30
40
50
60
70
Ages
Row 5
Responses
Consumers
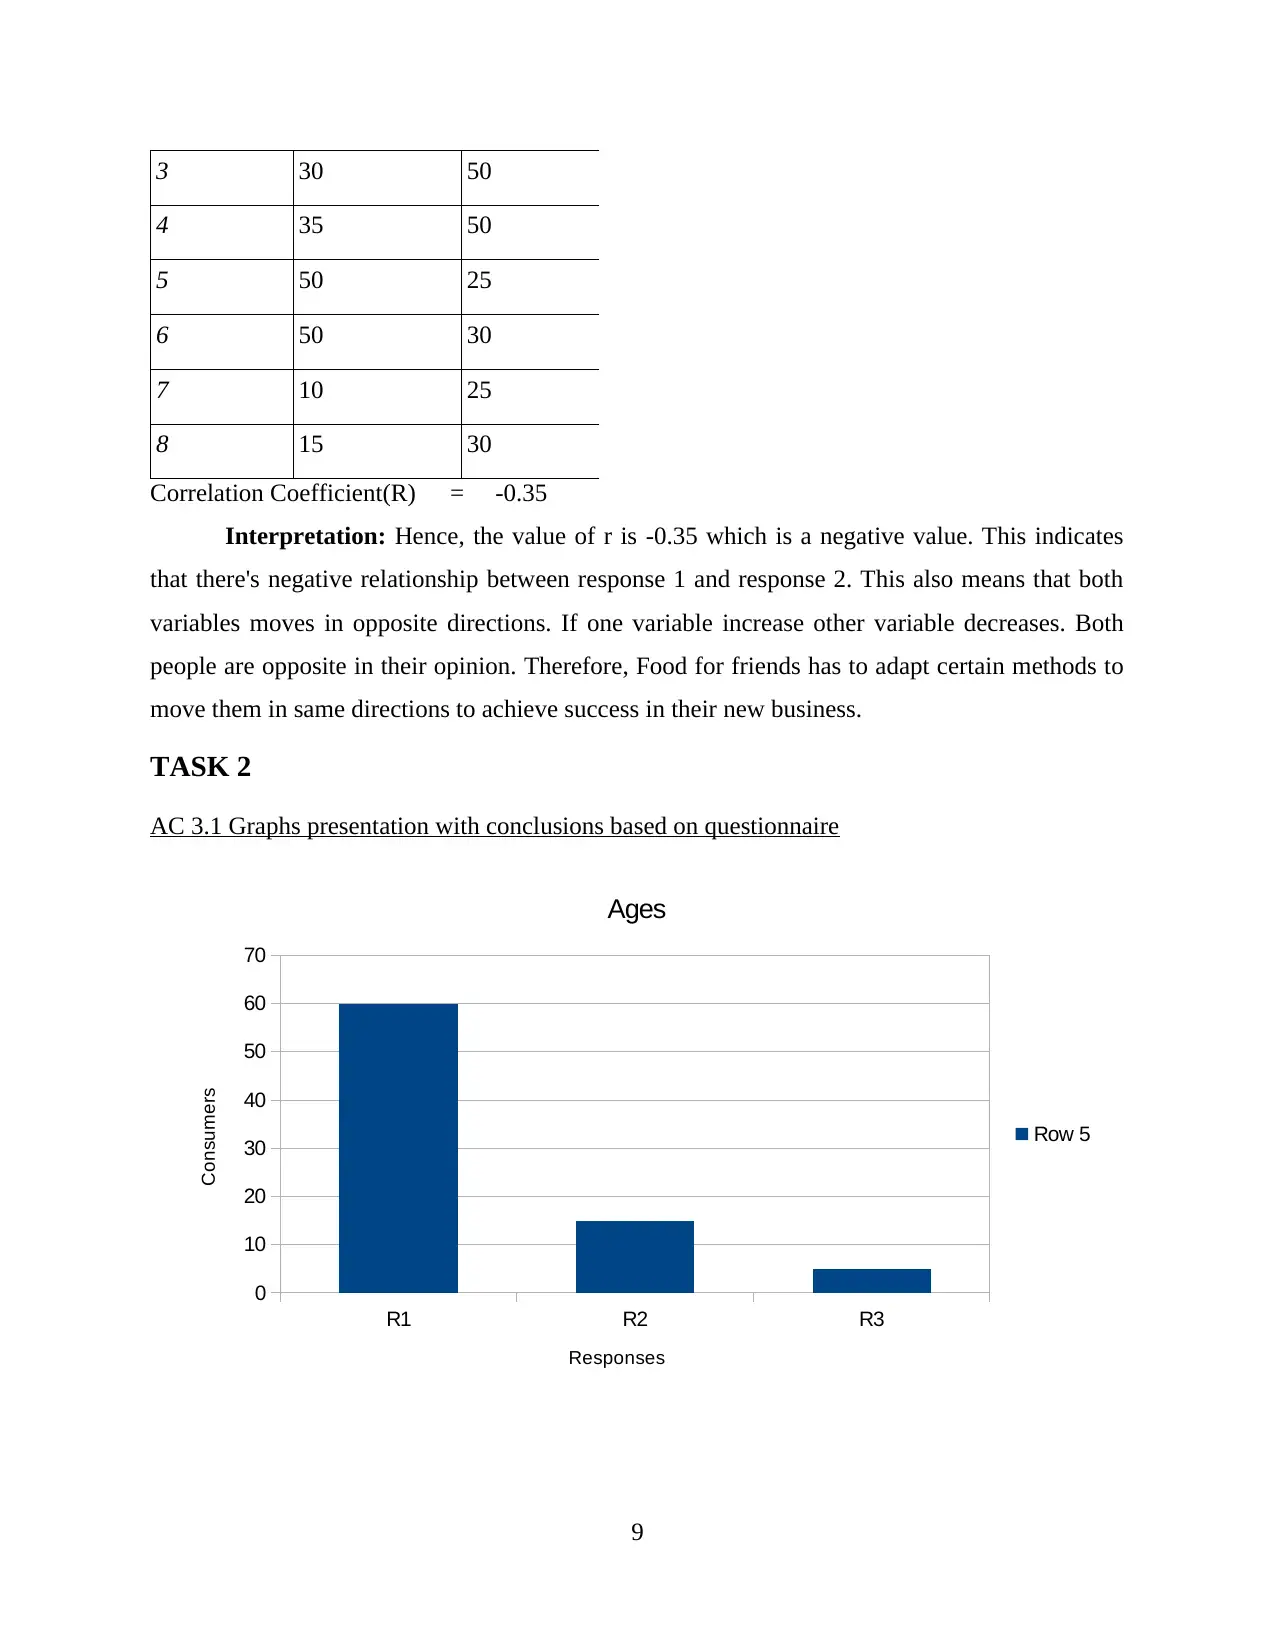
Interpretation: From the above graph it can be interpreted that maximum people were
having age between 18 – 20 years of age which were selected for sample survey. This signifies
that restaurant has to take care of their choices and preferences to make adoptable food and
services for such age groups.
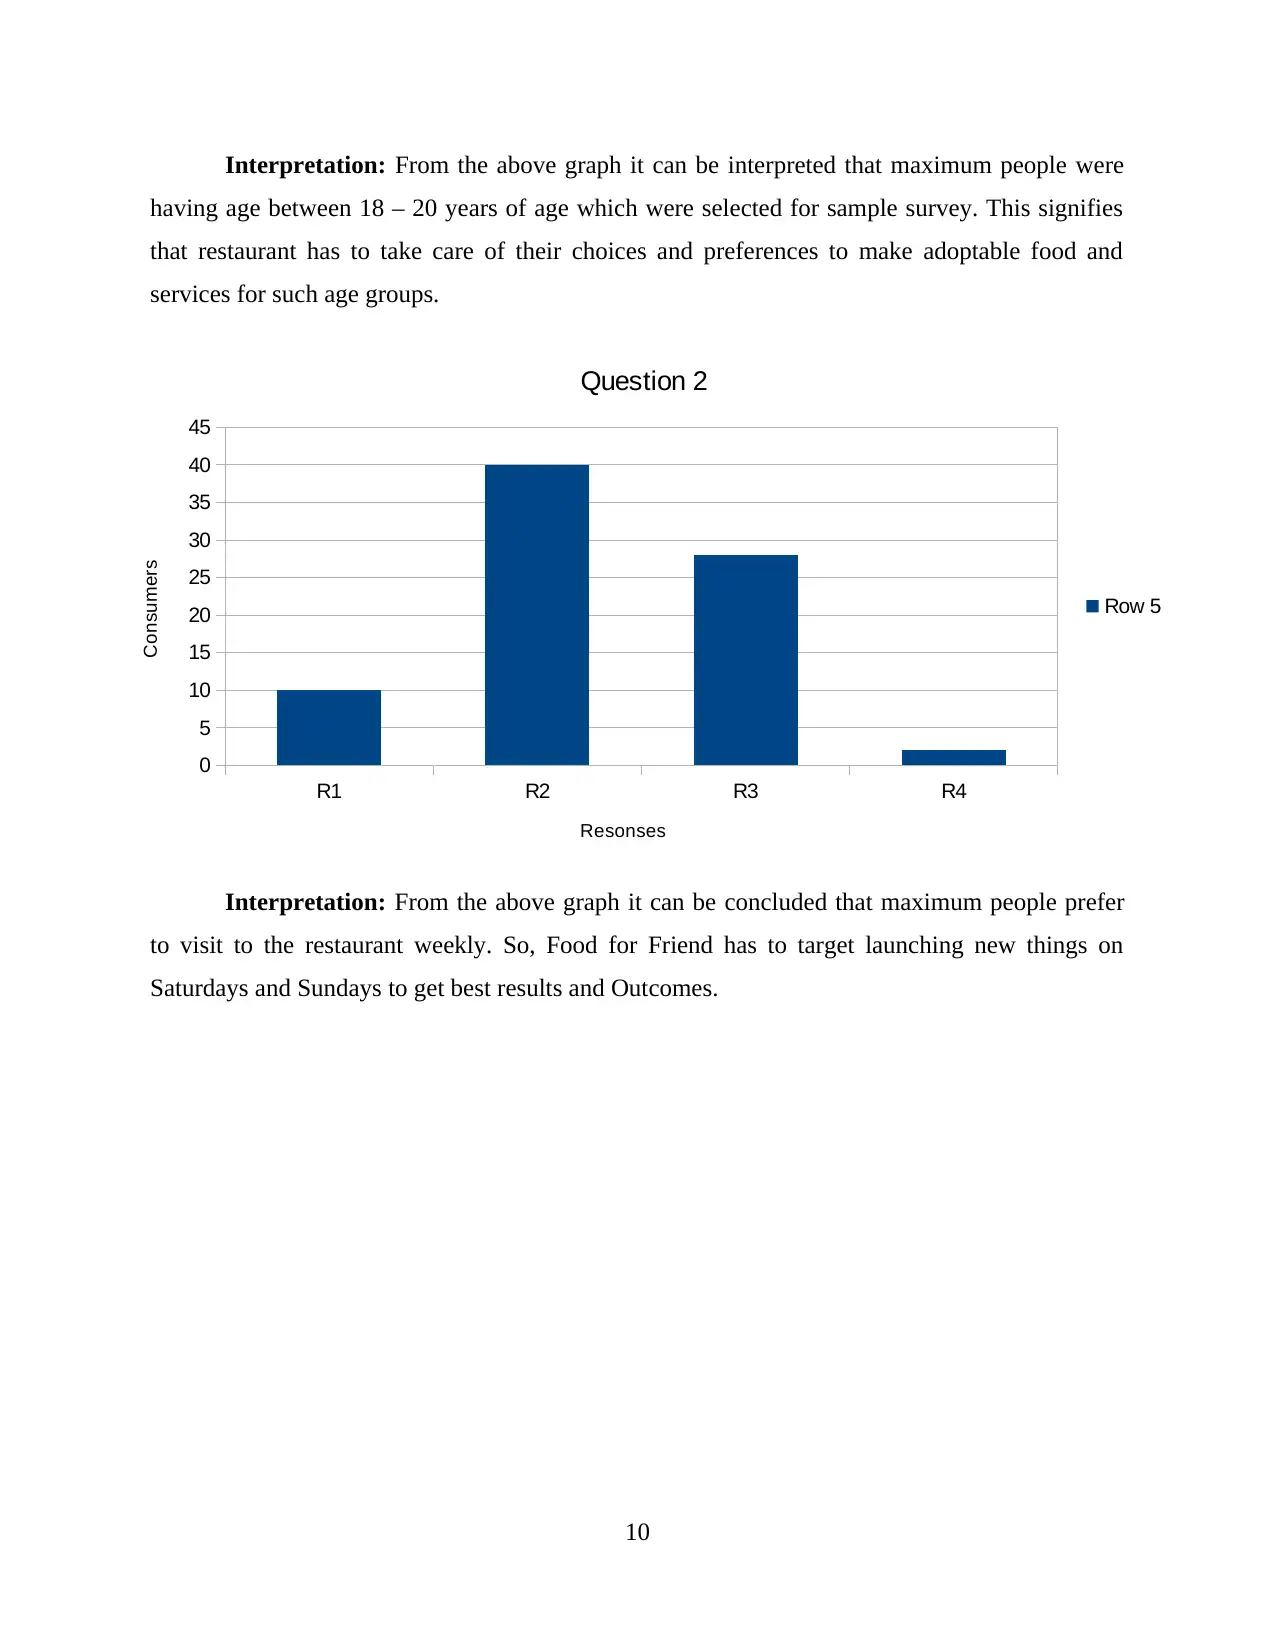
Interpretation: From the above graph it can be concluded that maximum people prefer
to visit to the restaurant weekly. So, Food for Friend has to target launching new things on
Saturdays and Sundays to get best results and Outcomes.
10
R1 R2 R3 R4
0
5
10
15
20
25
30
35
40
45
Question 2
Row 5
Resonses
Consumers
having age between 18 – 20 years of age which were selected for sample survey. This signifies
that restaurant has to take care of their choices and preferences to make adoptable food and
services for such age groups.
Interpretation: From the above graph it can be concluded that maximum people prefer
to visit to the restaurant weekly. So, Food for Friend has to target launching new things on
Saturdays and Sundays to get best results and Outcomes.
10
R1 R2 R3 R4
0
5
10
15
20
25
30
35
40
45
Question 2
Row 5
Resonses
Consumers
⊘ This is a preview!⊘
Do you want full access?
Subscribe today to unlock all pages.
Trusted by 1+ million students worldwide
1 out of 23
Related Documents


Your All-in-One AI-Powered Toolkit for Academic Success.
+13062052269
info@desklib.com
Available 24*7 on WhatsApp / Email
![[object Object]](/_next/static/media/star-bottom.7253800d.svg)
Unlock your academic potential
Copyright © 2020–2026 A2Z Services. All Rights Reserved. Developed and managed by ZUCOL.