University Food Production and Consumption Analysis Research Report

Verified

Added on  2021/06/17

|14
|2609
|40
Report
AI Summary
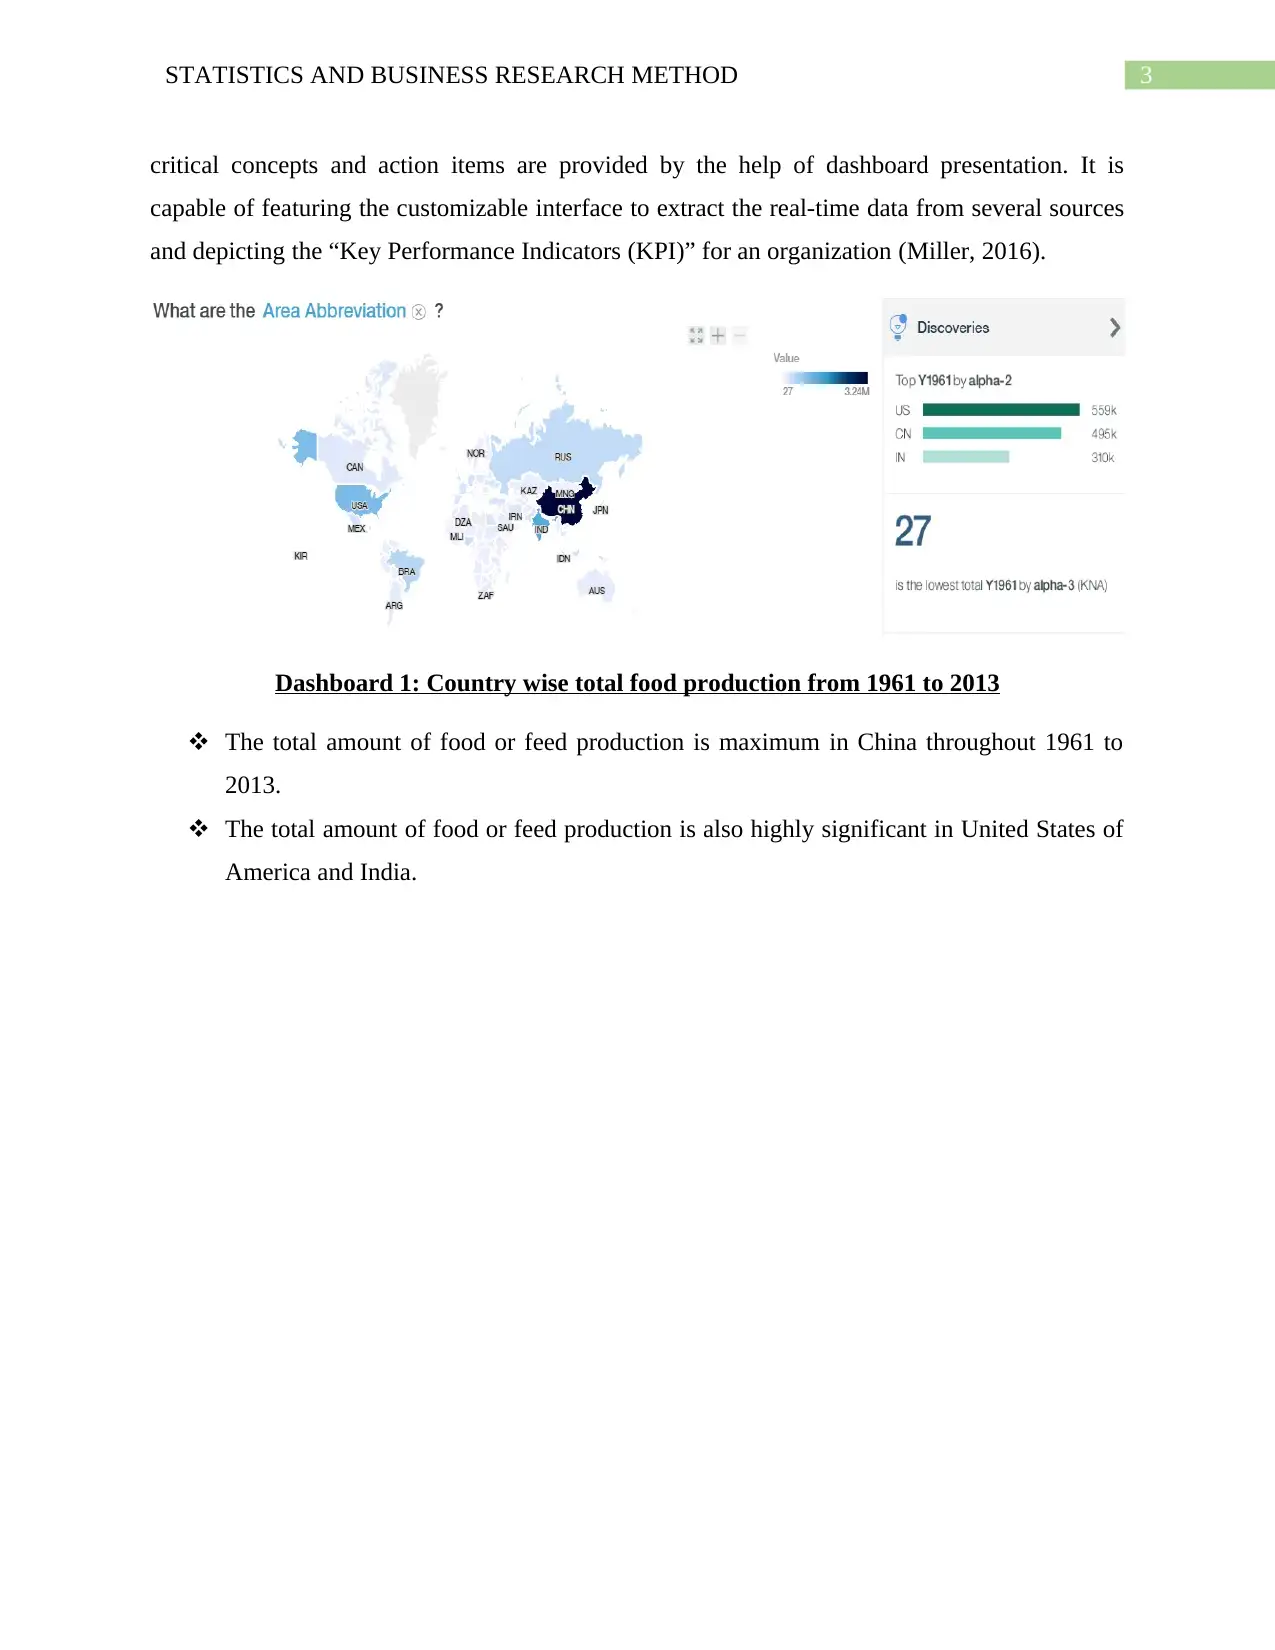
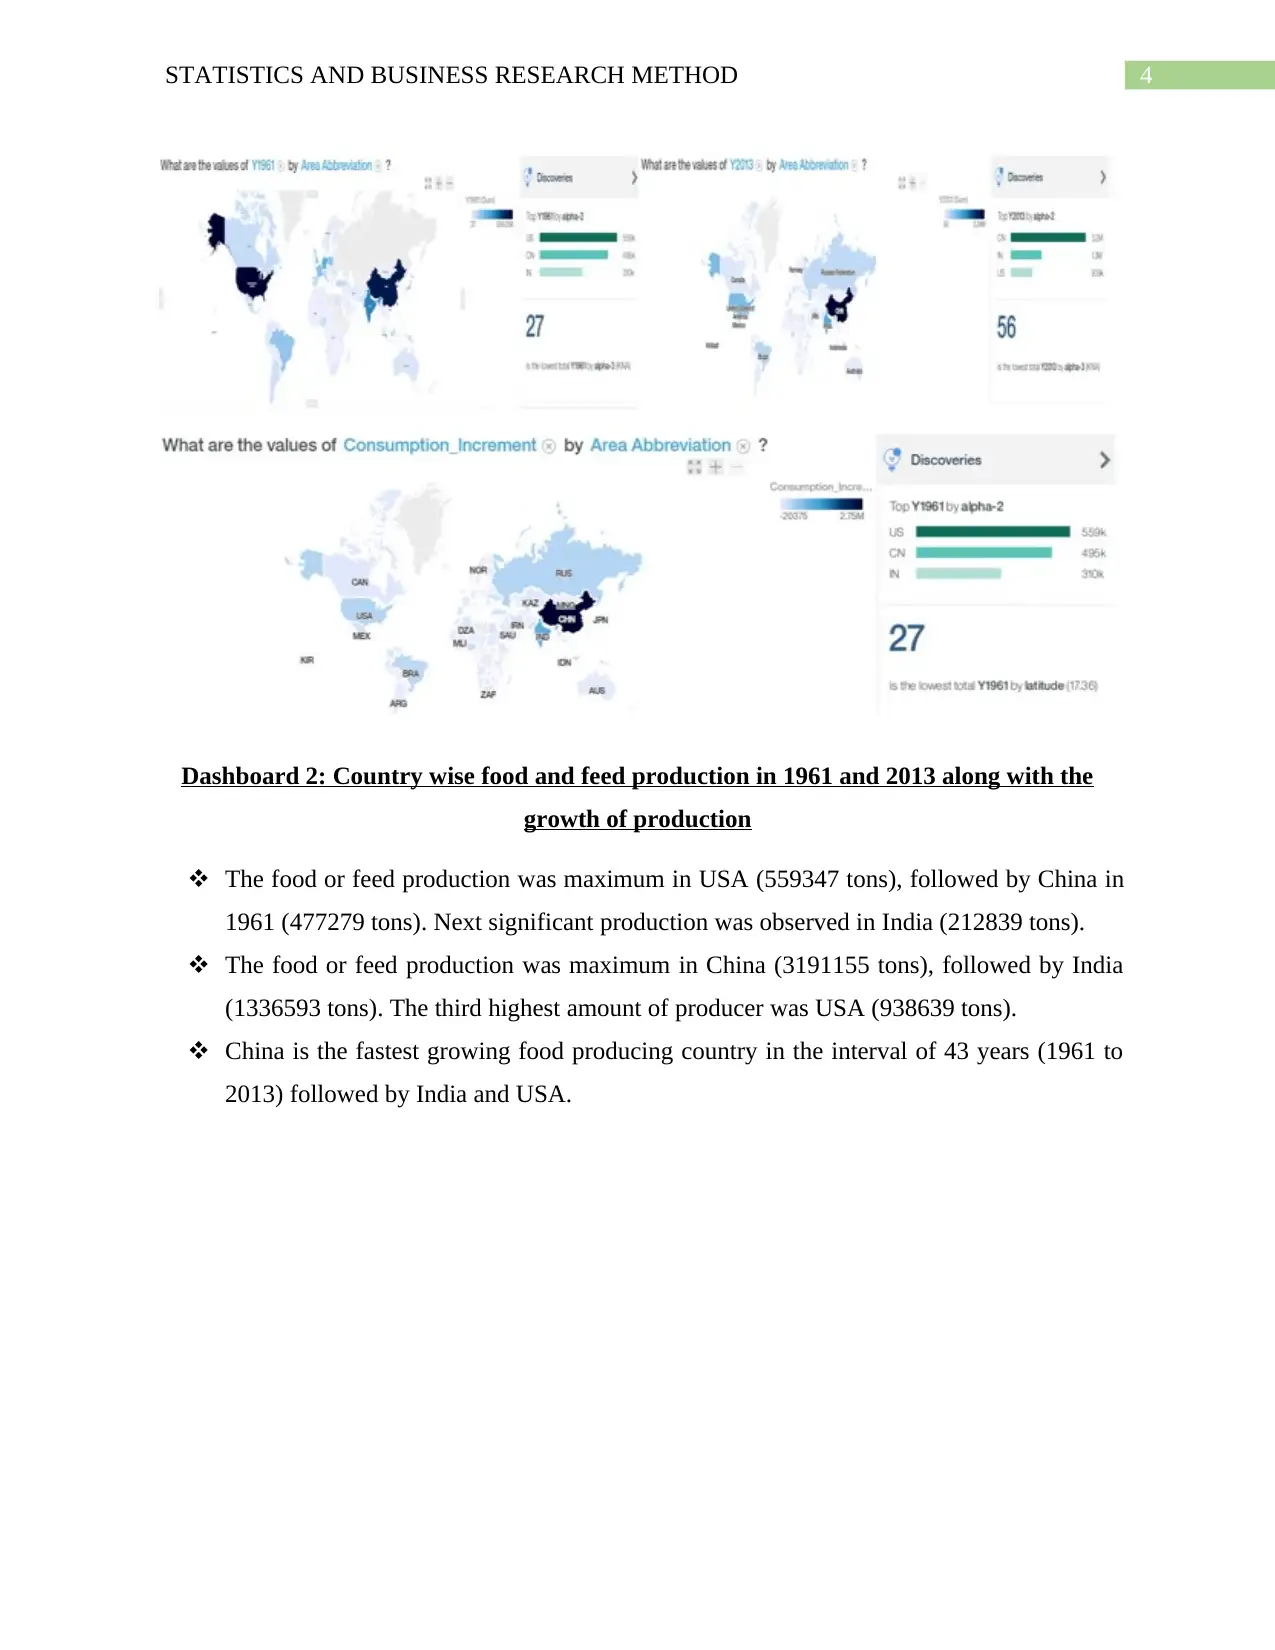
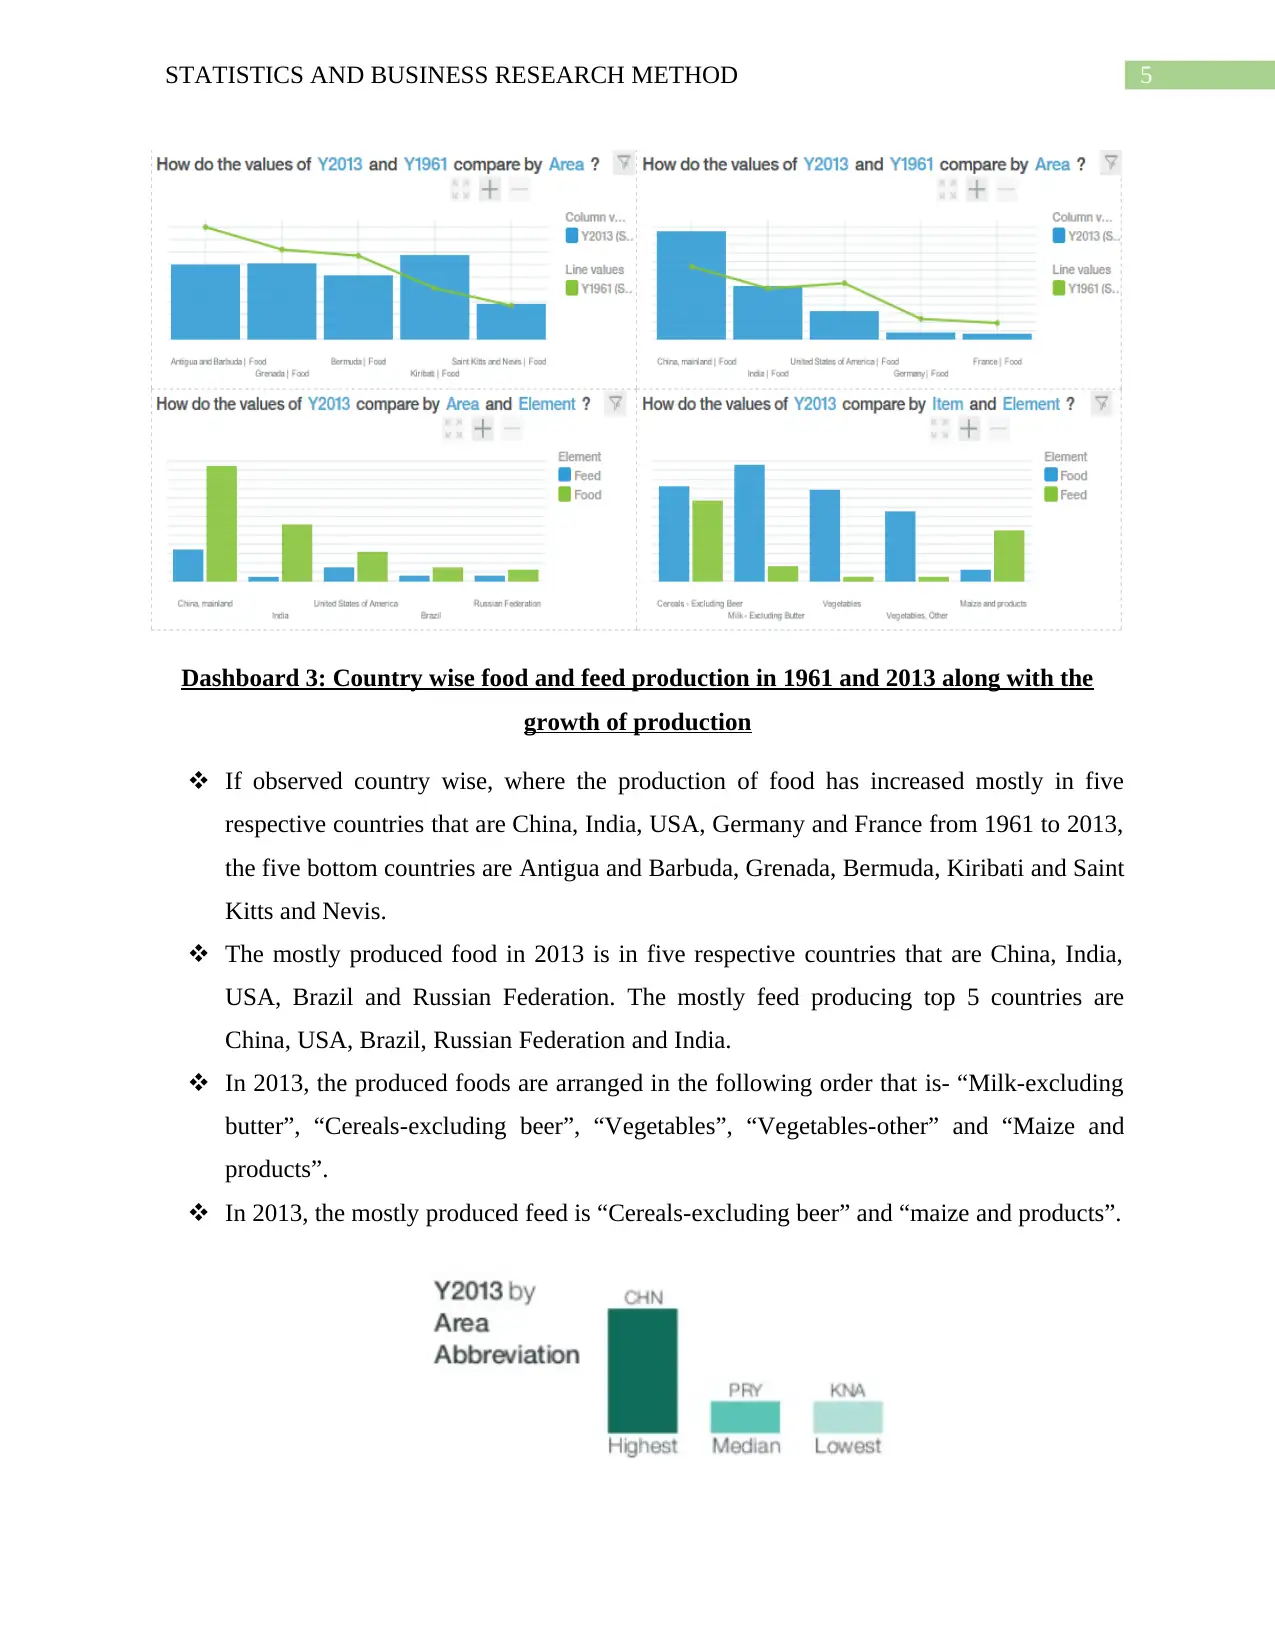
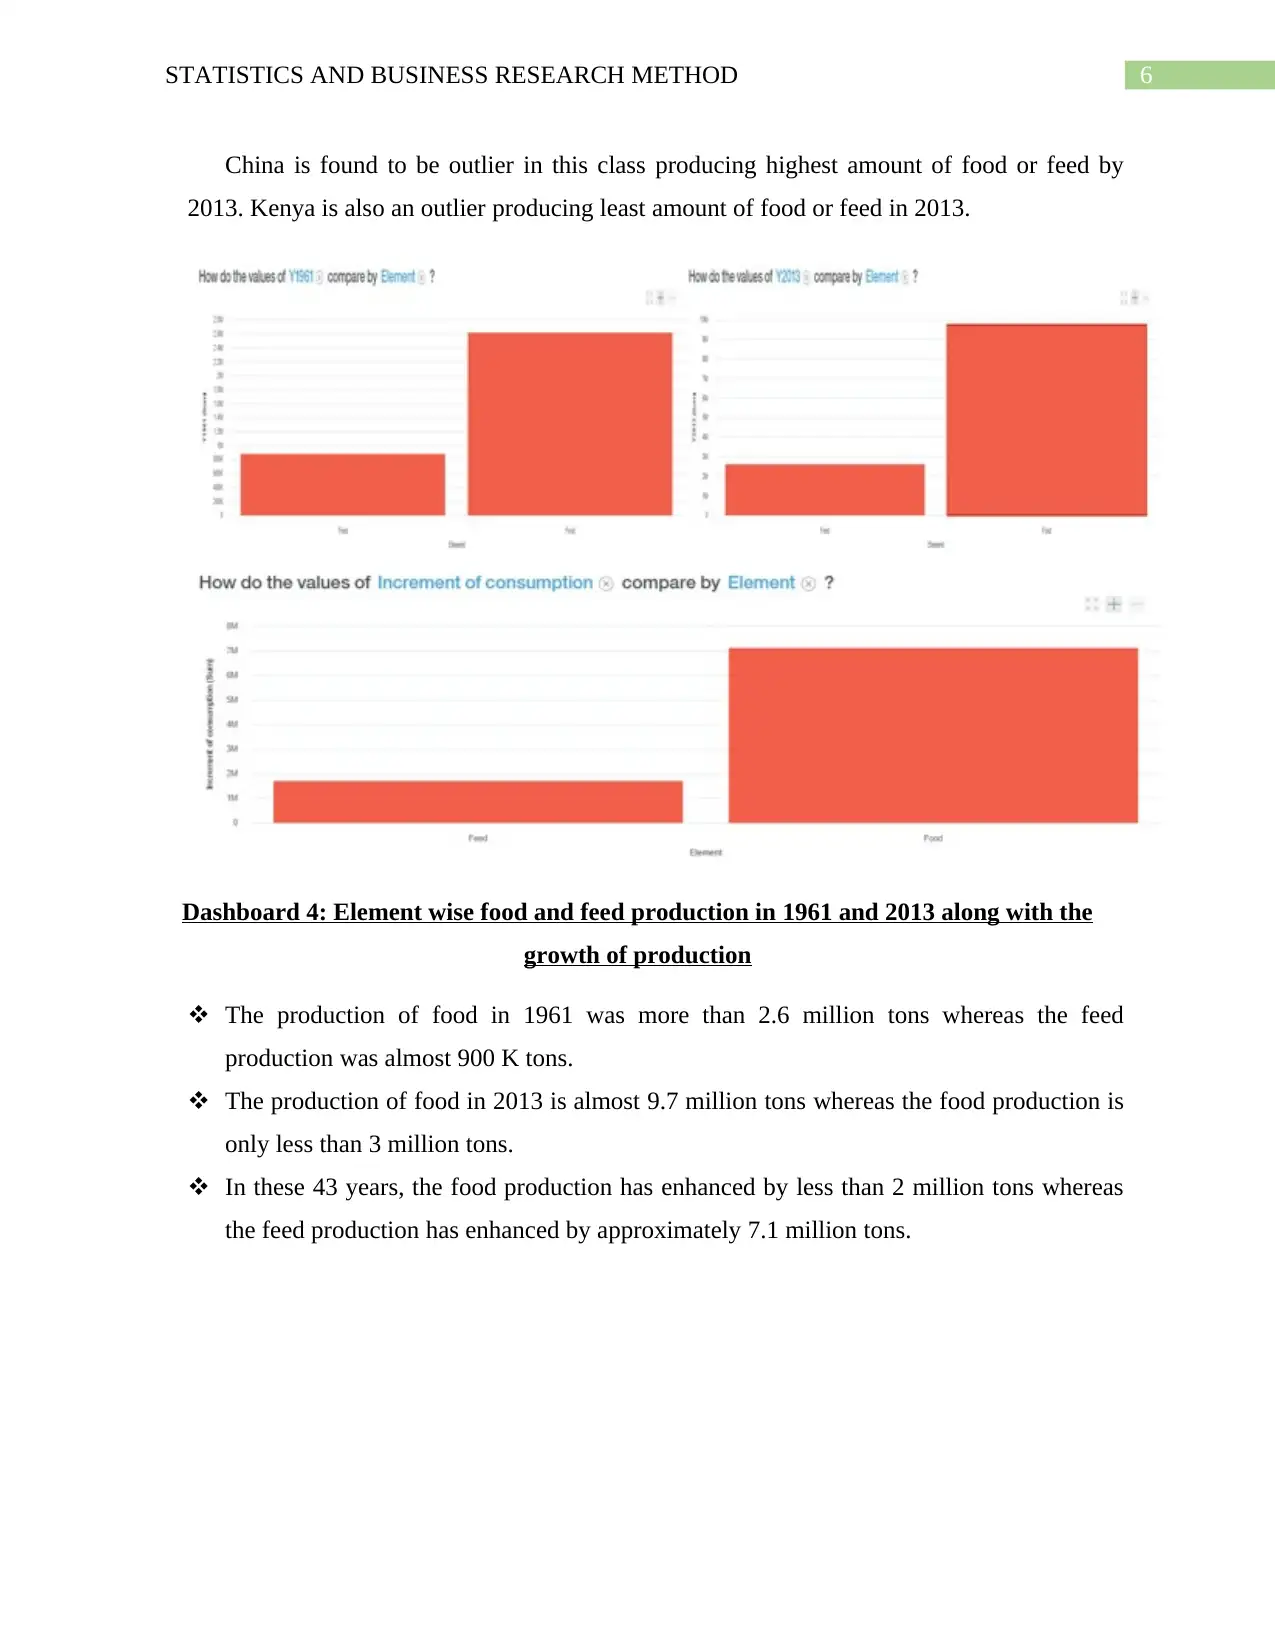
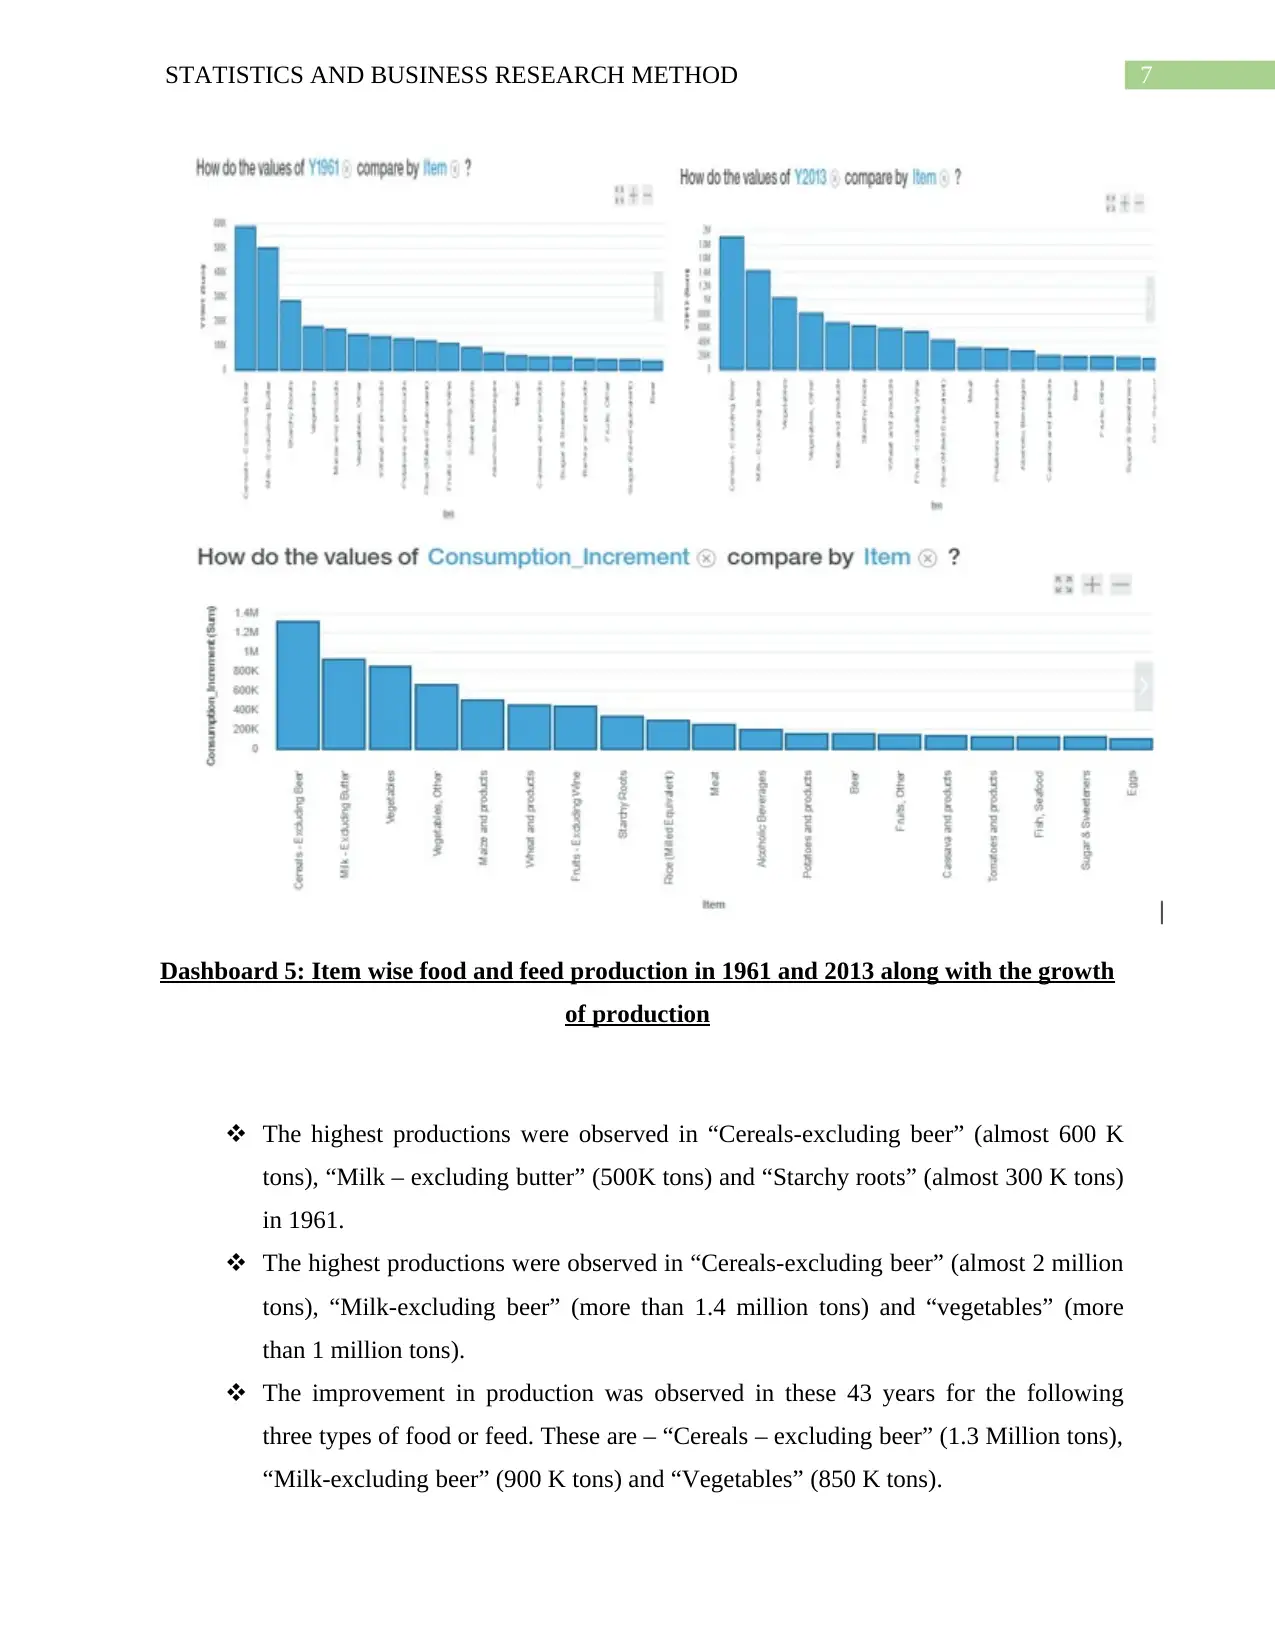
This report presents a comprehensive analysis of global food production and consumption patterns from 1961 to 2013, addressing the growing concern of food security in the face of increasing population. The study utilizes IBM Watson Analytics to examine various aspects, including country-wise food and feed production, element and item-wise production, and a comparative analysis of meat and aquatic meat supplies. The report highlights key trends, such as the significant growth in food and feed production, with China, USA, and India identified as major producers. The analysis includes detailed dashboards visualizing key performance indicators (KPIs) and provides recommendations for sustainable agricultural practices and population control to mitigate potential food crises. The report underscores the importance of modern agricultural techniques and policy interventions to ensure food availability, particularly in the face of potential malnutrition among socio-economic classes. The study emphasizes the need for innovation, support for cultivators, and access to agricultural instruments, fertilizers, and insecticides.
Document Page
Running head: STATISTICS AND BUSINESS RESEARCH METHOD
Statistics and Business research Method
Name of Student:
Name of University:
Course ID:
tabler-icon-diamond-filled.svg

Paraphrase This Document

Need a fresh take? Get an instant paraphrase of this document with our AI Paraphraser
Document Page
1STATISTICS AND BUSINESS RESEARCH METHOD
Table of Contents
1. Background:.............................................................................................................................2
2. Reporting of Dashboards:.........................................................................................................2
3. Research:................................................................................................................................10
4. Recommendations:.................................................................................................................10
5. Cover Letter:...........................................................................................................................11
6. References:.............................................................................................................................12
Document Page
2STATISTICS AND BUSINESS RESEARCH METHOD
1. Background:
The amount of food production is a vibrant topic these days as in comparison to the growth
of population (7.3 Billion to 9.7 Billion by 2050), the consumption of food is also going to be
vast. The research report highlights the global food crisis and verifies the sustainability of
agricultural activities across the continents and across the world. The world population is
estimated to be about 10 Billion by 2050. To find the solution of population explosion, different
countries are feeling the urge to yield high amount of food and agricultural products (Tilman et
al., 2011). The objective of the sustainable development of food is to fight-back the
“Overgrowing” population (Schneider et al., 2011). While the scenario indicates that a
significant amount of people are going to be hungry by 2015, then, entrepreneurs as well as
“Food and Agricultural” organizations are going to find the solution of almost doubled
population by 2050.
“Food and Agricultural Organization”, a unitary body of United Nation, would like undertake
a crucial dealing relationship with needy countries. It helps these countries to meet the demand
of food or feed with the intemperance knowledge in the field of “Agriculture”, “Horticulture”,
“Apiculture”, “Pisciculture”, “Viticulture” and “Moriculture” (Goodman, 2002). They would
like to fix their target of yielding these products by 2050 as the population is growing rapidly.
The various kinds of food “Items” and “Elements” (Food or Feed) are considered as the key
factors of the analysis. The “Global Food Consulting Firm” would like to provide a BI solution
featuring some key aspects-
A comparative study of food and feed production between 1961 and 2013.
The growth of food and feed production separately.
The agricultural demand of various countries and continents separately.
A comparative analysis of production of meat and aquatic meat supplies across the
world.
2. Reporting of Dashboards:
Different types of organizations along with entrepreneurs are involved to enhance food
production that have been recognized to visualize and interpret the requirement of the world an
effective BI solution is found to be imperative. The considerable aspects, key information,
Document Page
3STATISTICS AND BUSINESS RESEARCH METHOD
critical concepts and action items are provided by the help of dashboard presentation. It is
capable of featuring the customizable interface to extract the real-time data from several sources
and depicting the “Key Performance Indicators (KPI)” for an organization (Miller, 2016).
Dashboard 1: Country wise total food production from 1961 to 2013
The total amount of food or feed production is maximum in China throughout 1961 to
2013.
The total amount of food or feed production is also highly significant in United States of
America and India.
tabler-icon-diamond-filled.svg

Paraphrase This Document

Need a fresh take? Get an instant paraphrase of this document with our AI Paraphraser
Document Page
4STATISTICS AND BUSINESS RESEARCH METHOD
Dashboard 2: Country wise food and feed production in 1961 and 2013 along with the
growth of production
The food or feed production was maximum in USA (559347 tons), followed by China in
1961 (477279 tons). Next significant production was observed in India (212839 tons).
The food or feed production was maximum in China (3191155 tons), followed by India
(1336593 tons). The third highest amount of producer was USA (938639 tons).
China is the fastest growing food producing country in the interval of 43 years (1961 to
2013) followed by India and USA.
Document Page
5STATISTICS AND BUSINESS RESEARCH METHOD
Dashboard 3: Country wise food and feed production in 1961 and 2013 along with the
growth of production
If observed country wise, where the production of food has increased mostly in five
respective countries that are China, India, USA, Germany and France from 1961 to 2013,
the five bottom countries are Antigua and Barbuda, Grenada, Bermuda, Kiribati and Saint
Kitts and Nevis.
The mostly produced food in 2013 is in five respective countries that are China, India,
USA, Brazil and Russian Federation. The mostly feed producing top 5 countries are
China, USA, Brazil, Russian Federation and India.
In 2013, the produced foods are arranged in the following order that is- “Milk-excluding
butter”, “Cereals-excluding beer”, “Vegetables”, “Vegetables-other” and “Maize and
products”.
In 2013, the mostly produced feed is “Cereals-excluding beer” and “maize and products”.
Document Page
6STATISTICS AND BUSINESS RESEARCH METHOD
China is found to be outlier in this class producing highest amount of food or feed by
2013. Kenya is also an outlier producing least amount of food or feed in 2013.
Dashboard 4: Element wise food and feed production in 1961 and 2013 along with the
growth of production
The production of food in 1961 was more than 2.6 million tons whereas the feed
production was almost 900 K tons.
The production of food in 2013 is almost 9.7 million tons whereas the food production is
only less than 3 million tons.
In these 43 years, the food production has enhanced by less than 2 million tons whereas
the feed production has enhanced by approximately 7.1 million tons.
tabler-icon-diamond-filled.svg

Paraphrase This Document

Need a fresh take? Get an instant paraphrase of this document with our AI Paraphraser
Document Page
7STATISTICS AND BUSINESS RESEARCH METHOD
Dashboard 5: Item wise food and feed production in 1961 and 2013 along with the growth
of production
The highest productions were observed in “Cereals-excluding beer” (almost 600 K
tons), “Milk – excluding butter” (500K tons) and “Starchy roots” (almost 300 K tons)
in 1961.
The highest productions were observed in “Cereals-excluding beer” (almost 2 million
tons), “Milk-excluding beer” (more than 1.4 million tons) and “vegetables” (more
than 1 million tons).
The improvement in production was observed in these 43 years for the following
three types of food or feed. These are – “Cereals – excluding beer” (1.3 Million tons),
“Milk-excluding beer” (900 K tons) and “Vegetables” (850 K tons).
Document Page
8STATISTICS AND BUSINESS RESEARCH METHOD
Dashboard 6: Country wise “Meat and Aquatic meat” production in 2013
The overall growth of meat and aquatic meat production is not significantly high in any
country.
However, the growth is highest in three countries that are China, United States of
America and India.
In 2013, the highest production of “Bovine meat” (item 2731) is observed in USA
followed by China.
In 2013, the highest production of “Mutton and Goat meat” (item 2732) is observed in
China.
In 2013, the highest production of “Pig meat” (item 2733) is observed in China, followed
by United States of America.
The highest production of “Poultry meat” (item 2733) is observed in China, followed by
USA.
The production of other types of meat in 2013 is very insignificant in all the three chosen
countries.
Document Page
9STATISTICS AND BUSINESS RESEARCH METHOD
Dashboard 7: Overall “Meat and Aquatic meat” production in 2013
In 2013, the overall meat and aquatic meat production dashboard indicates that the
amount of “Pig meat” produced is maximum (Aiking, de Boer & Vereijken, 2006).
The amount of meats follows by “Poultry meat”, “Bovine meat”, “Mutton and goat
meat” and other types of meat.
In 2013, it is found that the production of “Bovine meat” is maximum in United
States of America. The amount is followed by Brazil, China, Russian Federation and
Argentina.
In 2013, “Poultry meat” is highest produced in China, followed by USA, Brazil,
Russian Federation and Mexico.
In 2013, “Pig meat” is produced in highest amount in China, followed by USA,
Germany, Russia and Vietnam.
tabler-icon-diamond-filled.svg

Paraphrase This Document

Need a fresh take? Get an instant paraphrase of this document with our AI Paraphraser
Document Page
10STATISTICS AND BUSINESS RESEARCH METHOD
In 2013, “Mutton and goat meat” is produced mostly in China, followed by India,
Nigeria, Pakistan and Sudan.
In 2013, other types of meat is highest produced in China, followed by USA, Russia,
Italy and France.
3. Research:
The researcher has analysed the food production and consumption data with the help of
“IBM Watson Analytics” which is an online analytical tool (Zhu et al., 2014). The analysis
focuses indicates that the production of food and feed has enhanced significantly from 1961 to
2013 across the world. In both 1961 and 2013, the amount of produced food is far greater than
feed. As the year progressed, the production of food and feed also has enhanced (Oosterveer,
2007). As a proof it could be said that the increment of food is more than 7 million tons in 43
years and feed is almost 1.5 million tons these 43 years.
China, USA and India are almost in all cases of foods and feeds are highest producer.
Asia is a continent which produces maximum amount of food followed by Europe or America.
The outlier in case of food production is “China”. The outlier with respect to increment of food
production is China as well as India.
Throughout all the 43 years, the production of “Cereals” and “Milk” is very high in all
the countries and continents. The meat and meat product consumption is highest for “Pig meat”.
The meat and meat product consumption is followed by “Poultry meat”, “Bovine meat”, “Mutton
and Goat meat” and other types of meat. China produces every types of meats in high amount.
4. Recommendations:
Population of all the countries have grown significantly these days. The population growth is
especially very high in Asian countries. The accomplished dashboards indicate that food
production also have grown significantly these days in the countries of “Asia” such as China and
India. The population growth is also significant in United States of America. Therefore, countries
like China and India, must innovate modern agricultural techniques and cultivating procedure to
increase the yield. The population control and limit of population growth are very much essential
Document Page
11STATISTICS AND BUSINESS RESEARCH METHOD
in those countries (Foster, Green & Bleda, 2007). The amount of food and feed production is
being critical with population overflow. People are occupying more lands these days. Hence,
near future, people especially below the socio-economic class might face mal-nutrition (Dyson,
1996). The proper policy making of the corresponding governances, support towards cultivators
along with proper technology for agriculture must be implemented. A sufficient amount of lone
could be helpful for farmers too. Agricultural instruments and necessary elements alike fertilizers
and insecticides should be available. The stakeholders and governance of countries like India,
Brazil or Indonesia should adopt similarly adopted agricultural techniques of China or USA
(Chadderton et al., 2017).
5. Cover Letter:
Respected Sir,
CEO of Food and Agricultural Organisation.
The analysis of food or feed sample data of all the countries and
continents reveals some hidden facts. The food and feed production of the
country and continents are showing the current trend. From 1961 to 2013,
the population has increased significantly as well as the production of food
and feed also has enhanced. Production of “Cereals” and “Milk” have
increased significantly. These food products and meats highly are produced
in China, India and USA. The production of food is very little in Caribbean
islands and some under-developed countries like Kenya. The production of
green vegetables and other “Olericulture” products is not much satisfactory.
As the population has mostly increased in “Asia”, the food crisis is mostly
going to affect this continent. The condition of production and consumption
ratio is better in Europe and Oceania. Although, the population of America
and Africa has enhanced in last 43 years, the food production also has
increased. As an overall situation, it could be recommended that the
population growth is a serious issue that should be tackled tactically and
plan fully.
chevron_up_icon
1 out of 14
circle_padding
hide_on_mobile
zoom_out_icon
[object Object]