Multiple Regression Analysis for Food Truck Case Study - SCMA 3300

Verified

Added on  2022/08/29

|9
|1106
|21
Homework Assignment
AI Summary
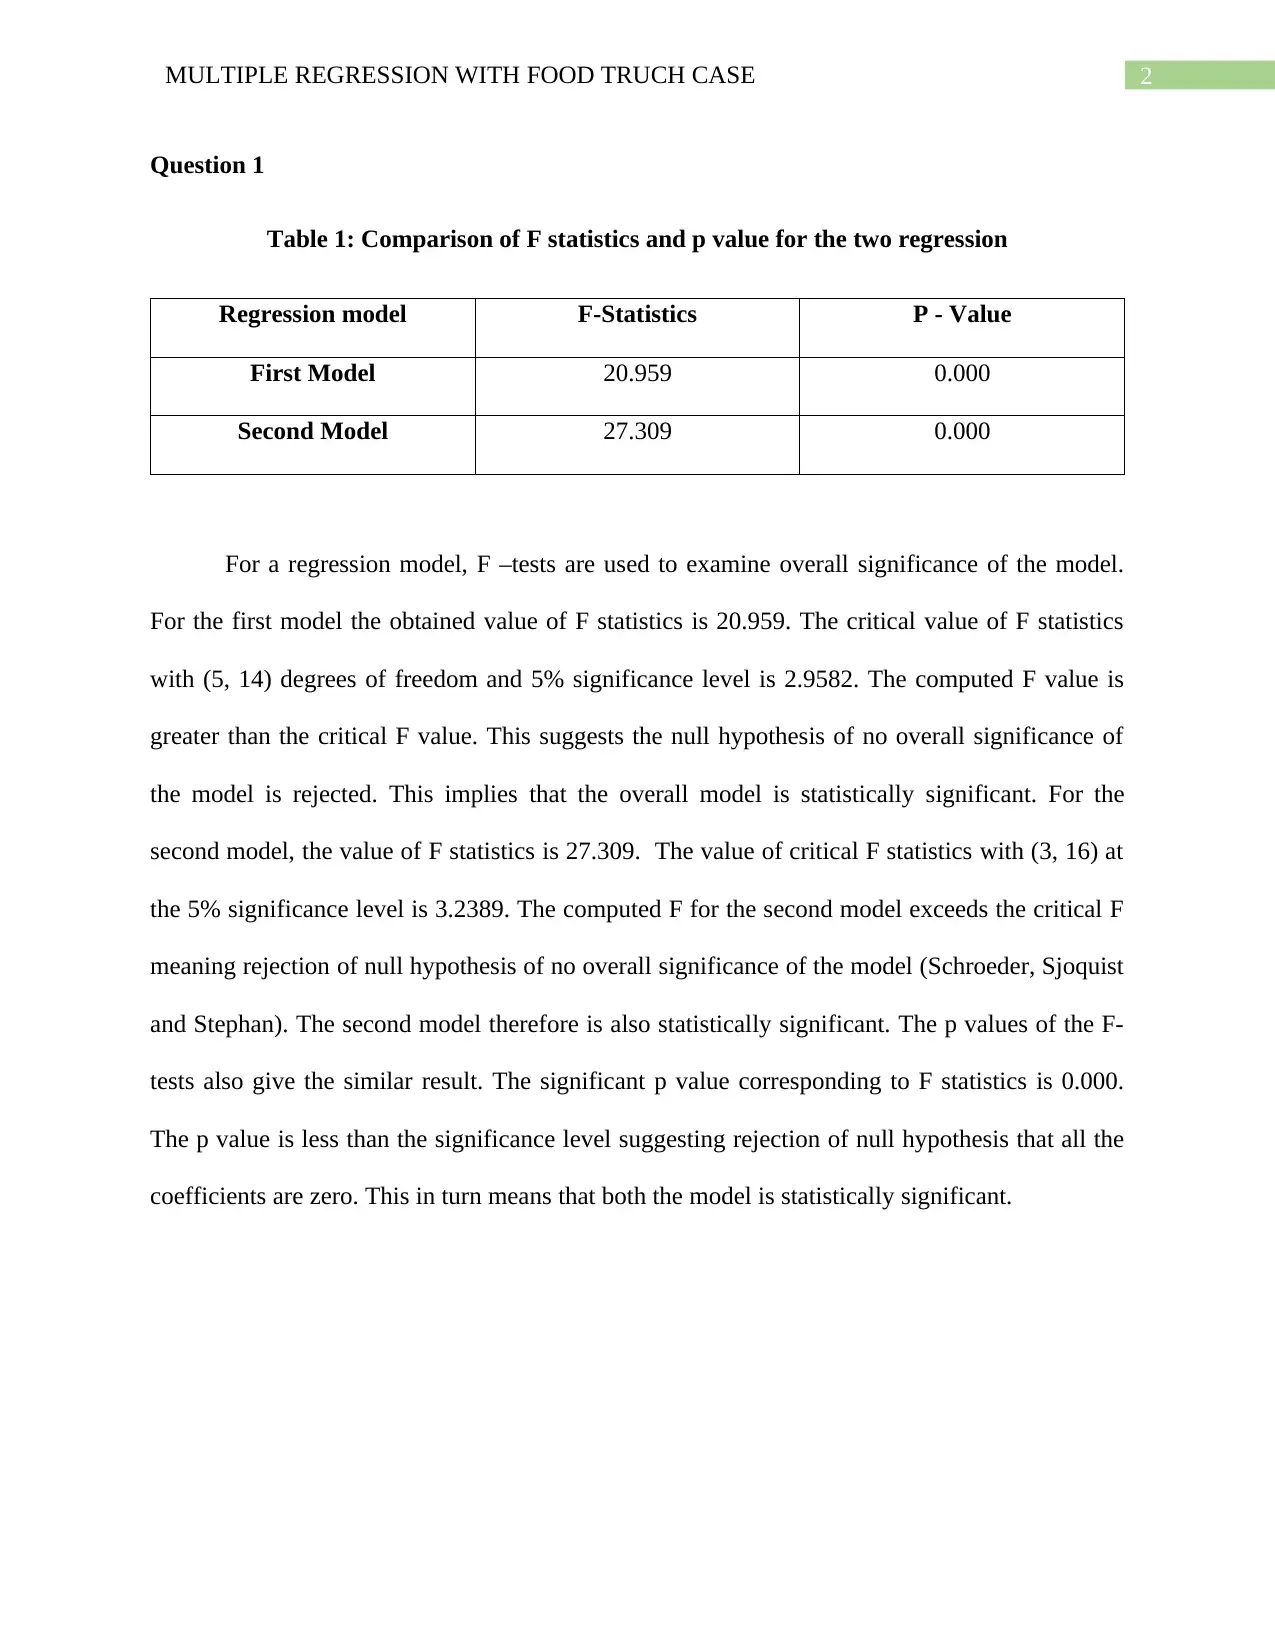
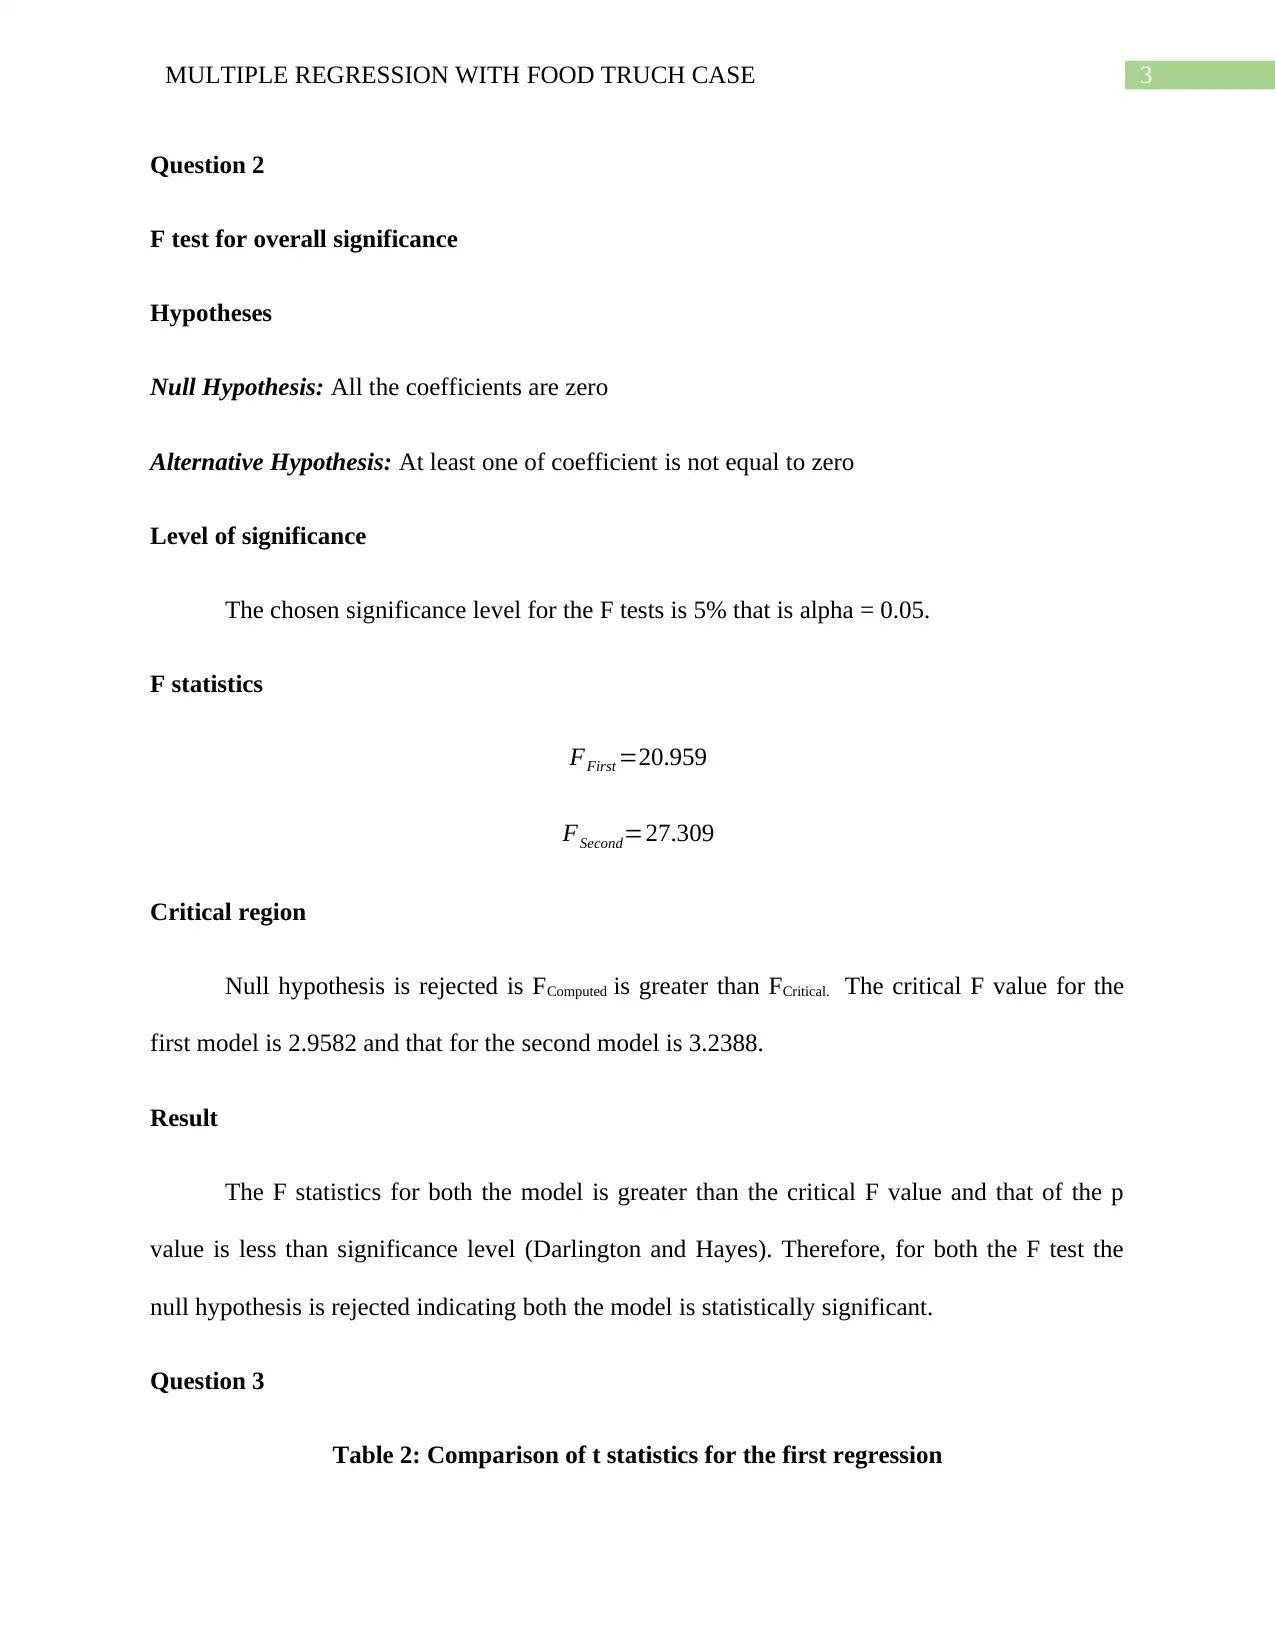
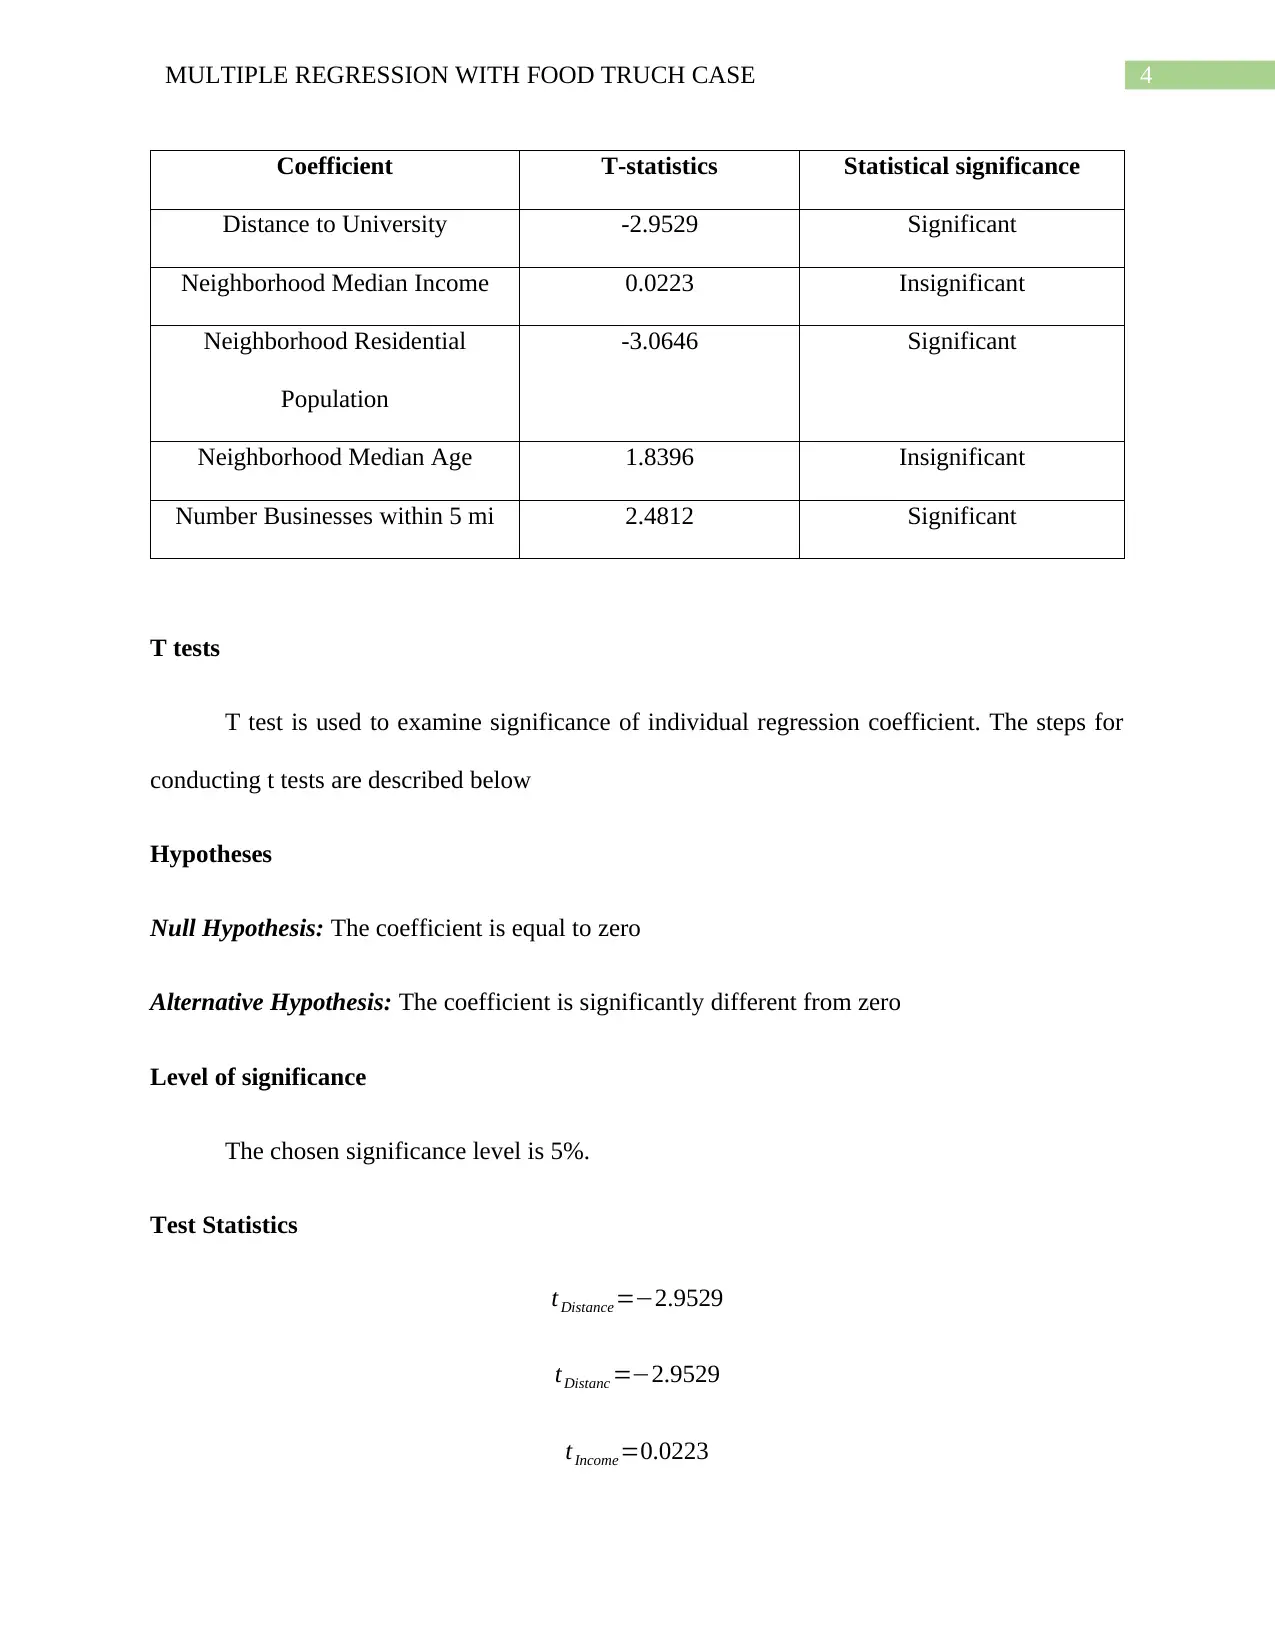
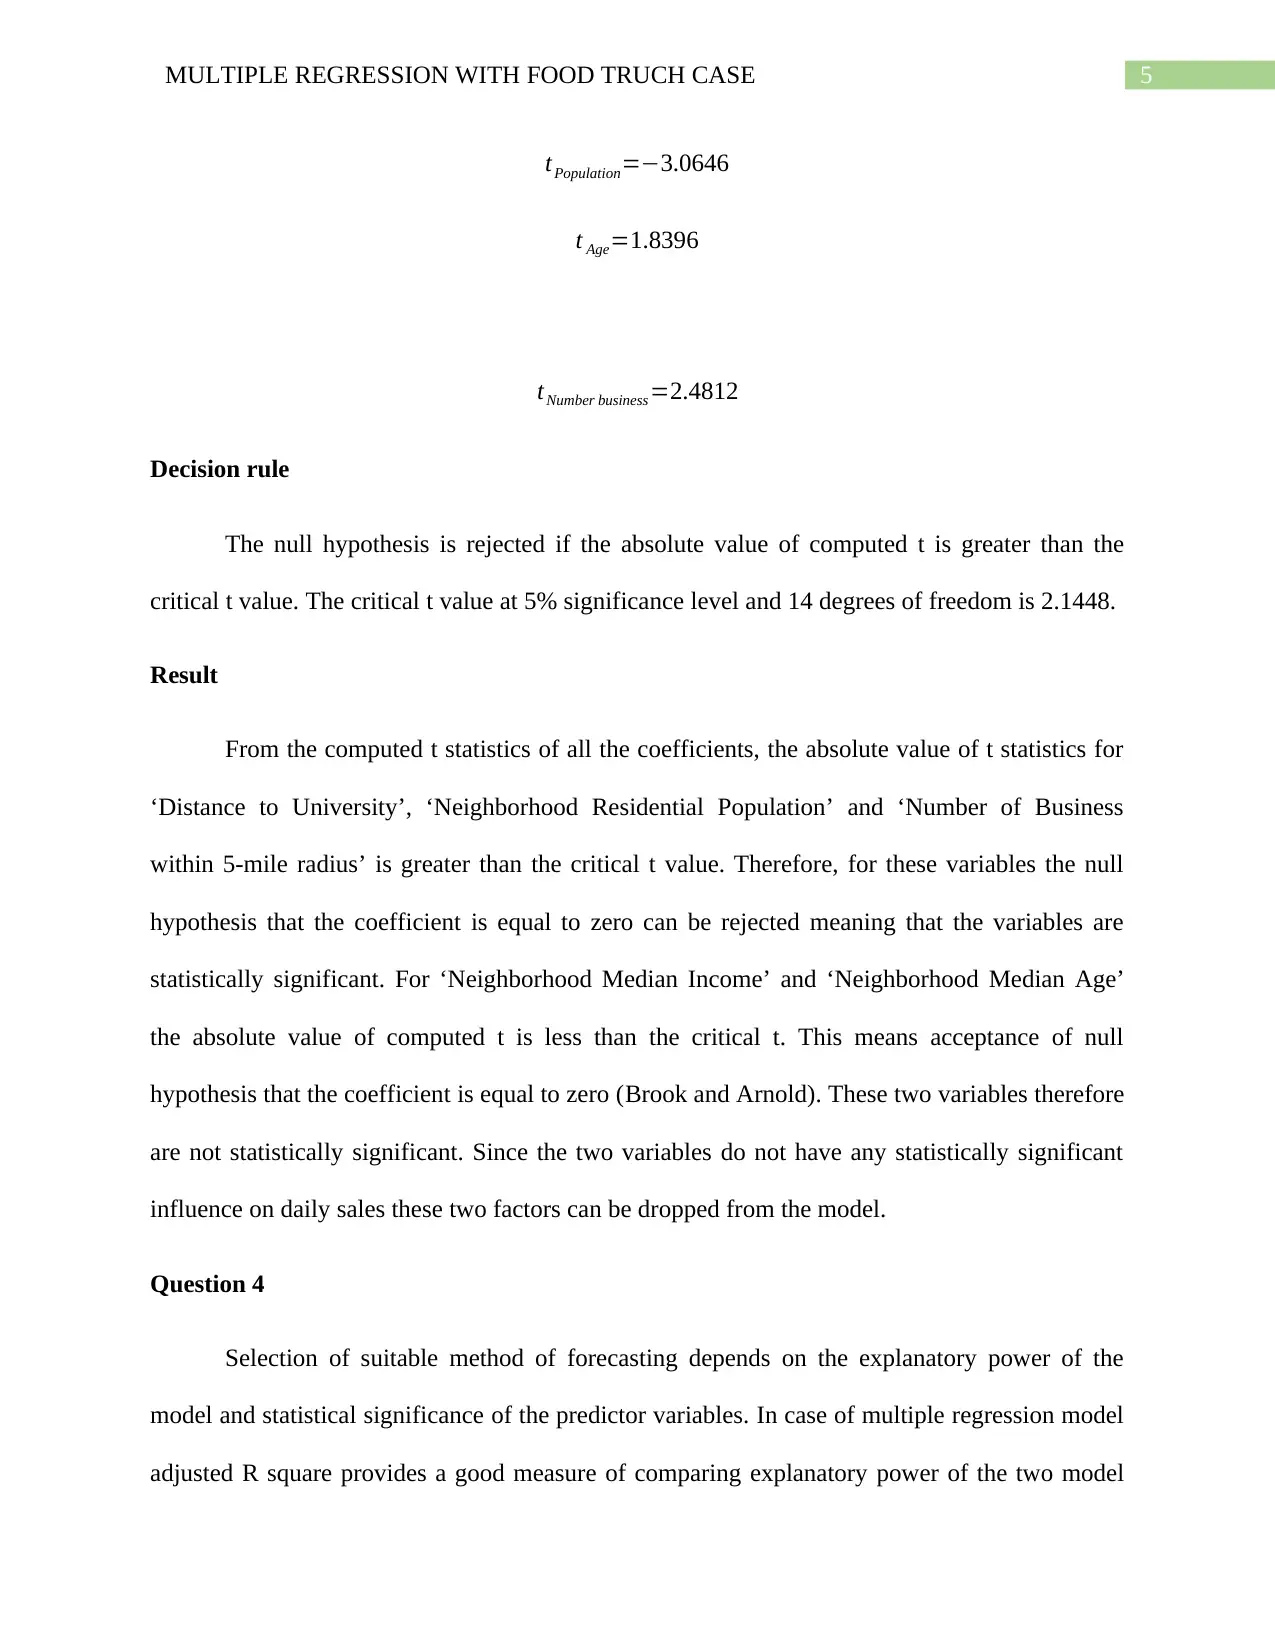
This document presents a comprehensive analysis of a food truck case study using multiple regression techniques. The assignment involves two regression models, examining the significance of various location-based factors on the food truck's daily sales. The student conducts F-tests to assess the overall significance of each model, comparing computed F-statistics with critical values and p-values. Furthermore, t-tests are performed to evaluate the significance of individual regression coefficients, identifying which variables significantly influence daily sales. The analysis includes the interpretation of adjusted R-squared values to compare the explanatory power of the two models and selection of the most suitable model based on statistical significance of predictor variables. The student concludes by selecting the second model due to the statistical significance of all its variables, making it a better predictor of profitability. The document includes tables summarizing the statistical results and references to relevant academic literature.
Document Page
Running head: MULTIPLE REGRESSION WITH FOOD TRUCK CASE
Multiple Regression with Food Truck Case
Name of the Student
Name of the University
Course ID
tabler-icon-diamond-filled.svg

Paraphrase This Document

Need a fresh take? Get an instant paraphrase of this document with our AI Paraphraser
Document Page
1MULTIPLE REGRESSION WITH FOOD TRUCH CASE
Table of Contents
Question 1........................................................................................................................................2
Question 2........................................................................................................................................3
Question 3........................................................................................................................................3
Question 4........................................................................................................................................5
References........................................................................................................................................7
Document Page
2MULTIPLE REGRESSION WITH FOOD TRUCH CASE
Question 1
Table 1: Comparison of F statistics and p value for the two regression
Regression model F-Statistics P - Value
First Model 20.959 0.000
Second Model 27.309 0.000
For a regression model, F –tests are used to examine overall significance of the model.
For the first model the obtained value of F statistics is 20.959. The critical value of F statistics
with (5, 14) degrees of freedom and 5% significance level is 2.9582. The computed F value is
greater than the critical F value. This suggests the null hypothesis of no overall significance of
the model is rejected. This implies that the overall model is statistically significant. For the
second model, the value of F statistics is 27.309. The value of critical F statistics with (3, 16) at
the 5% significance level is 3.2389. The computed F for the second model exceeds the critical F
meaning rejection of null hypothesis of no overall significance of the model (Schroeder, Sjoquist
and Stephan). The second model therefore is also statistically significant. The p values of the F-
tests also give the similar result. The significant p value corresponding to F statistics is 0.000.
The p value is less than the significance level suggesting rejection of null hypothesis that all the
coefficients are zero. This in turn means that both the model is statistically significant.
Document Page
3MULTIPLE REGRESSION WITH FOOD TRUCH CASE
Question 2
F test for overall significance
Hypotheses
Null Hypothesis: All the coefficients are zero
Alternative Hypothesis: At least one of coefficient is not equal to zero
Level of significance
The chosen significance level for the F tests is 5% that is alpha = 0.05.
F statistics
FFirst =20.959
FSecond=27.309
Critical region
Null hypothesis is rejected is FComputed is greater than FCritical. The critical F value for the
first model is 2.9582 and that for the second model is 3.2388.
Result
The F statistics for both the model is greater than the critical F value and that of the p
value is less than significance level (Darlington and Hayes). Therefore, for both the F test the
null hypothesis is rejected indicating both the model is statistically significant.
Question 3
Table 2: Comparison of t statistics for the first regression
tabler-icon-diamond-filled.svg

Paraphrase This Document

Need a fresh take? Get an instant paraphrase of this document with our AI Paraphraser
Document Page
4MULTIPLE REGRESSION WITH FOOD TRUCH CASE
Coefficient T-statistics Statistical significance
Distance to University -2.9529 Significant
Neighborhood Median Income 0.0223 Insignificant
Neighborhood Residential
Population
-3.0646 Significant
Neighborhood Median Age 1.8396 Insignificant
Number Businesses within 5 mi 2.4812 Significant
T tests
T test is used to examine significance of individual regression coefficient. The steps for
conducting t tests are described below
Hypotheses
Null Hypothesis: The coefficient is equal to zero
Alternative Hypothesis: The coefficient is significantly different from zero
Level of significance
The chosen significance level is 5%.
Test Statistics
tDistance =2.9529
tDistanc =2.9529
tIncome=0.0223
Document Page
5MULTIPLE REGRESSION WITH FOOD TRUCH CASE
tPopulation=3.0646
t Age=1.8396
tNumber business=2.4812
Decision rule
The null hypothesis is rejected if the absolute value of computed t is greater than the
critical t value. The critical t value at 5% significance level and 14 degrees of freedom is 2.1448.
Result
From the computed t statistics of all the coefficients, the absolute value of t statistics for
‘Distance to University’, ‘Neighborhood Residential Population’ and ‘Number of Business
within 5-mile radius’ is greater than the critical t value. Therefore, for these variables the null
hypothesis that the coefficient is equal to zero can be rejected meaning that the variables are
statistically significant. For ‘Neighborhood Median Income’ and ‘Neighborhood Median Age’
the absolute value of computed t is less than the critical t. This means acceptance of null
hypothesis that the coefficient is equal to zero (Brook and Arnold). These two variables therefore
are not statistically significant. Since the two variables do not have any statistically significant
influence on daily sales these two factors can be dropped from the model.
Question 4
Selection of suitable method of forecasting depends on the explanatory power of the
model and statistical significance of the predictor variables. In case of multiple regression model
adjusted R square provides a good measure of comparing explanatory power of the two model
Document Page
6MULTIPLE REGRESSION WITH FOOD TRUCH CASE
(Chatterjee and Hadi). For the first model, the adjusted R square value is 0.8401 meaning the
model can explain 84 percent variation of daily sales in different location. For the second model
the value of adjusted R square is 0.8060 meaning that the model accounts 81 percent variation in
daily sales in different location. The explanatory power of the first model though is slightly
greater than the second model, there are two variables in the model namely ‘Neighborhood
Median Income’ and ‘Neighborhood Median Age’ are statistically insignificant. Keeping the two
variables in the model would not make any significant difference in prediction of daily sales. In
contrast, all the variables in the second model are statistically significant and therefore, are
statistically significant predictor of daily sales. Therefore, the first model though has five
explanatory factors two of them however are statistically insignificant and therefore are not
significant predictors of daily sales (Fox). The second model however has all the factors that are
statistically significant predictors of daily sales and also have a good explanatory power. Hence,
the second model is better than the first model for predicting profitability of a location.
tabler-icon-diamond-filled.svg

Paraphrase This Document

Need a fresh take? Get an instant paraphrase of this document with our AI Paraphraser
Document Page
7MULTIPLE REGRESSION WITH FOOD TRUCH CASE
References
Brook, Richard J., and Gregory C. Arnold. Applied regression analysis and experimental design.
Routledge, 2018.
Chatterjee, Samprit, and Ali S. Hadi. Regression analysis by example. John Wiley & Sons, 2015.
Darlington, Richard B., and Andrew F. Hayes. Regression analysis and linear models: Concepts,
applications, and implementation. Guilford Publications, 2016.
Fox, John. Applied regression analysis and generalized linear models. Sage Publications, 2015.
Schroeder, Larry D., David L. Sjoquist, and Paula E. Stephan. Understanding regression
analysis: An introductory guide. Vol. 57. Sage Publications, 2016.
Document Page
8MULTIPLE REGRESSION WITH FOOD TRUCH CASE
chevron_up_icon
1 out of 9
circle_padding
hide_on_mobile
zoom_out_icon
[object Object]