Melbourne Foodbowl Economic Contribution: A Foodprint Project Report
VerifiedAdded on 2023/06/13
|11
|1032
|172
Report
AI Summary
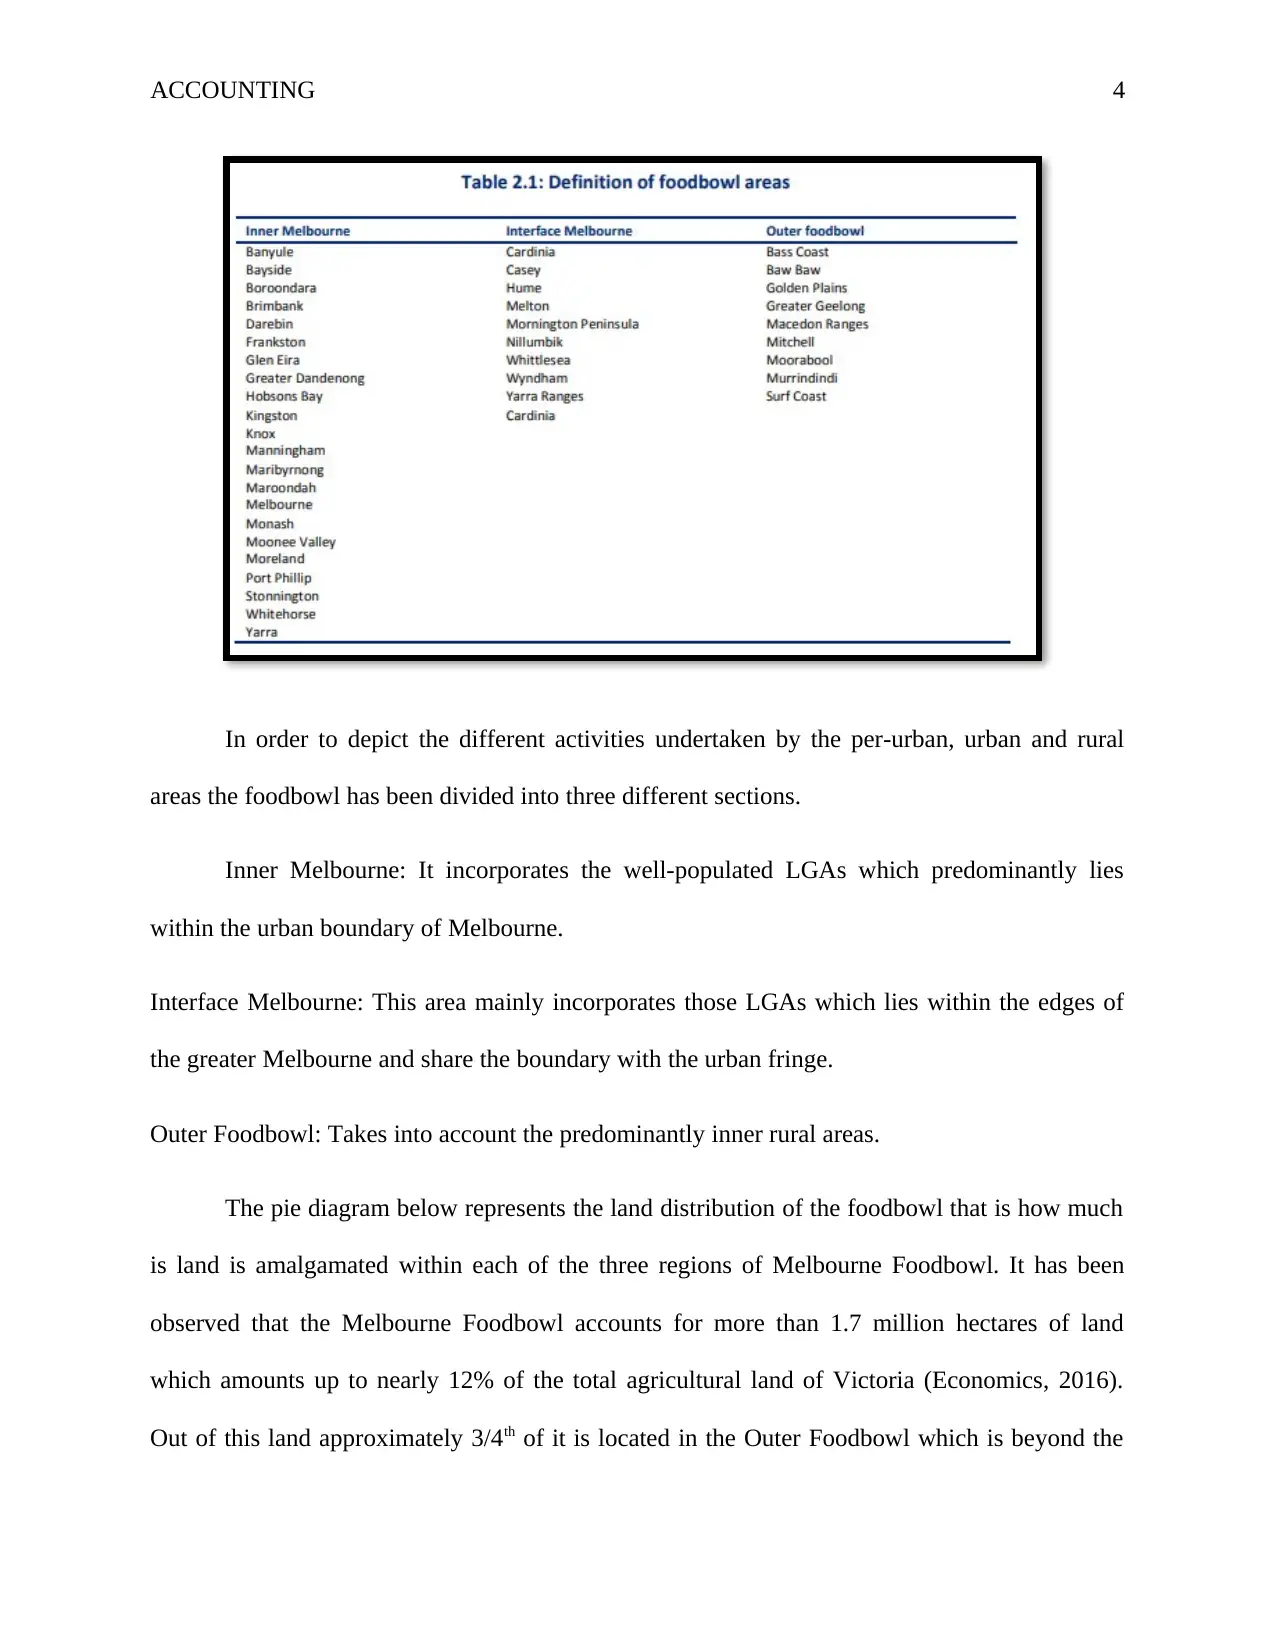
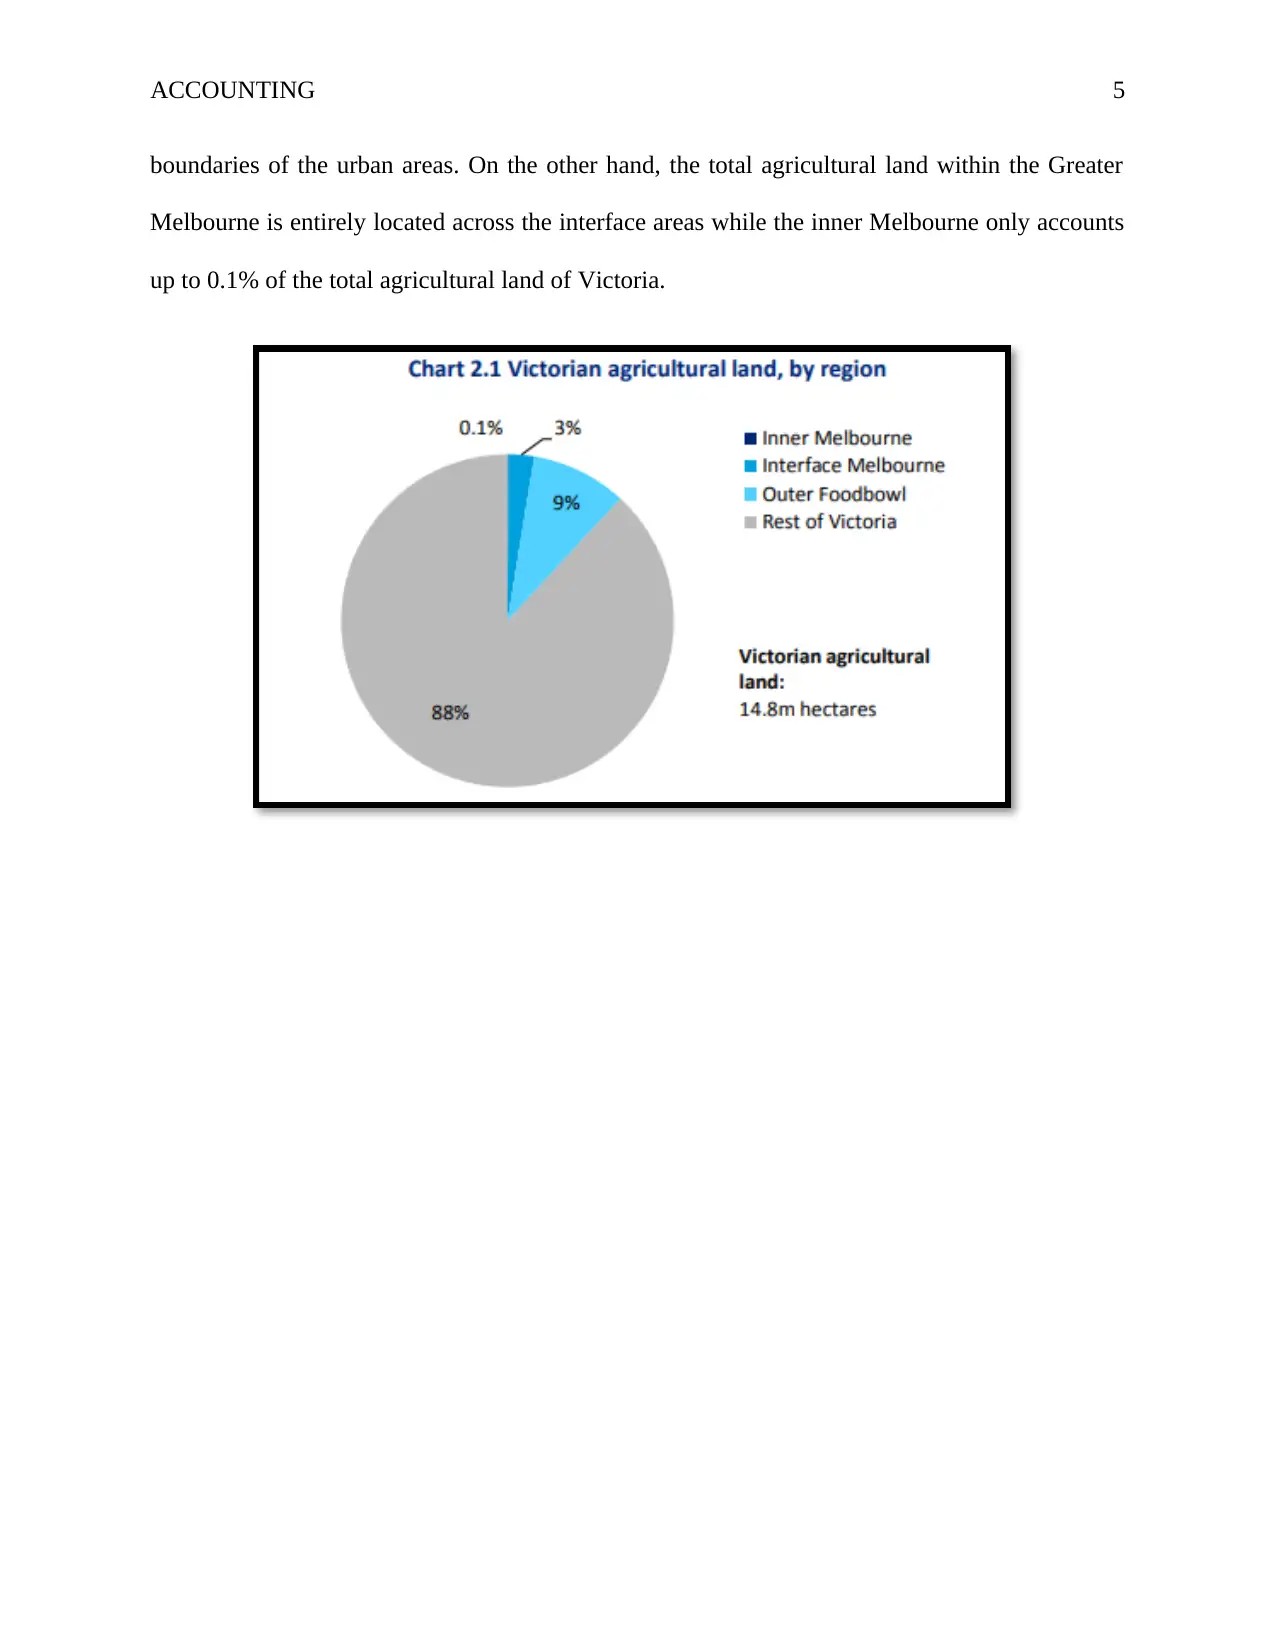
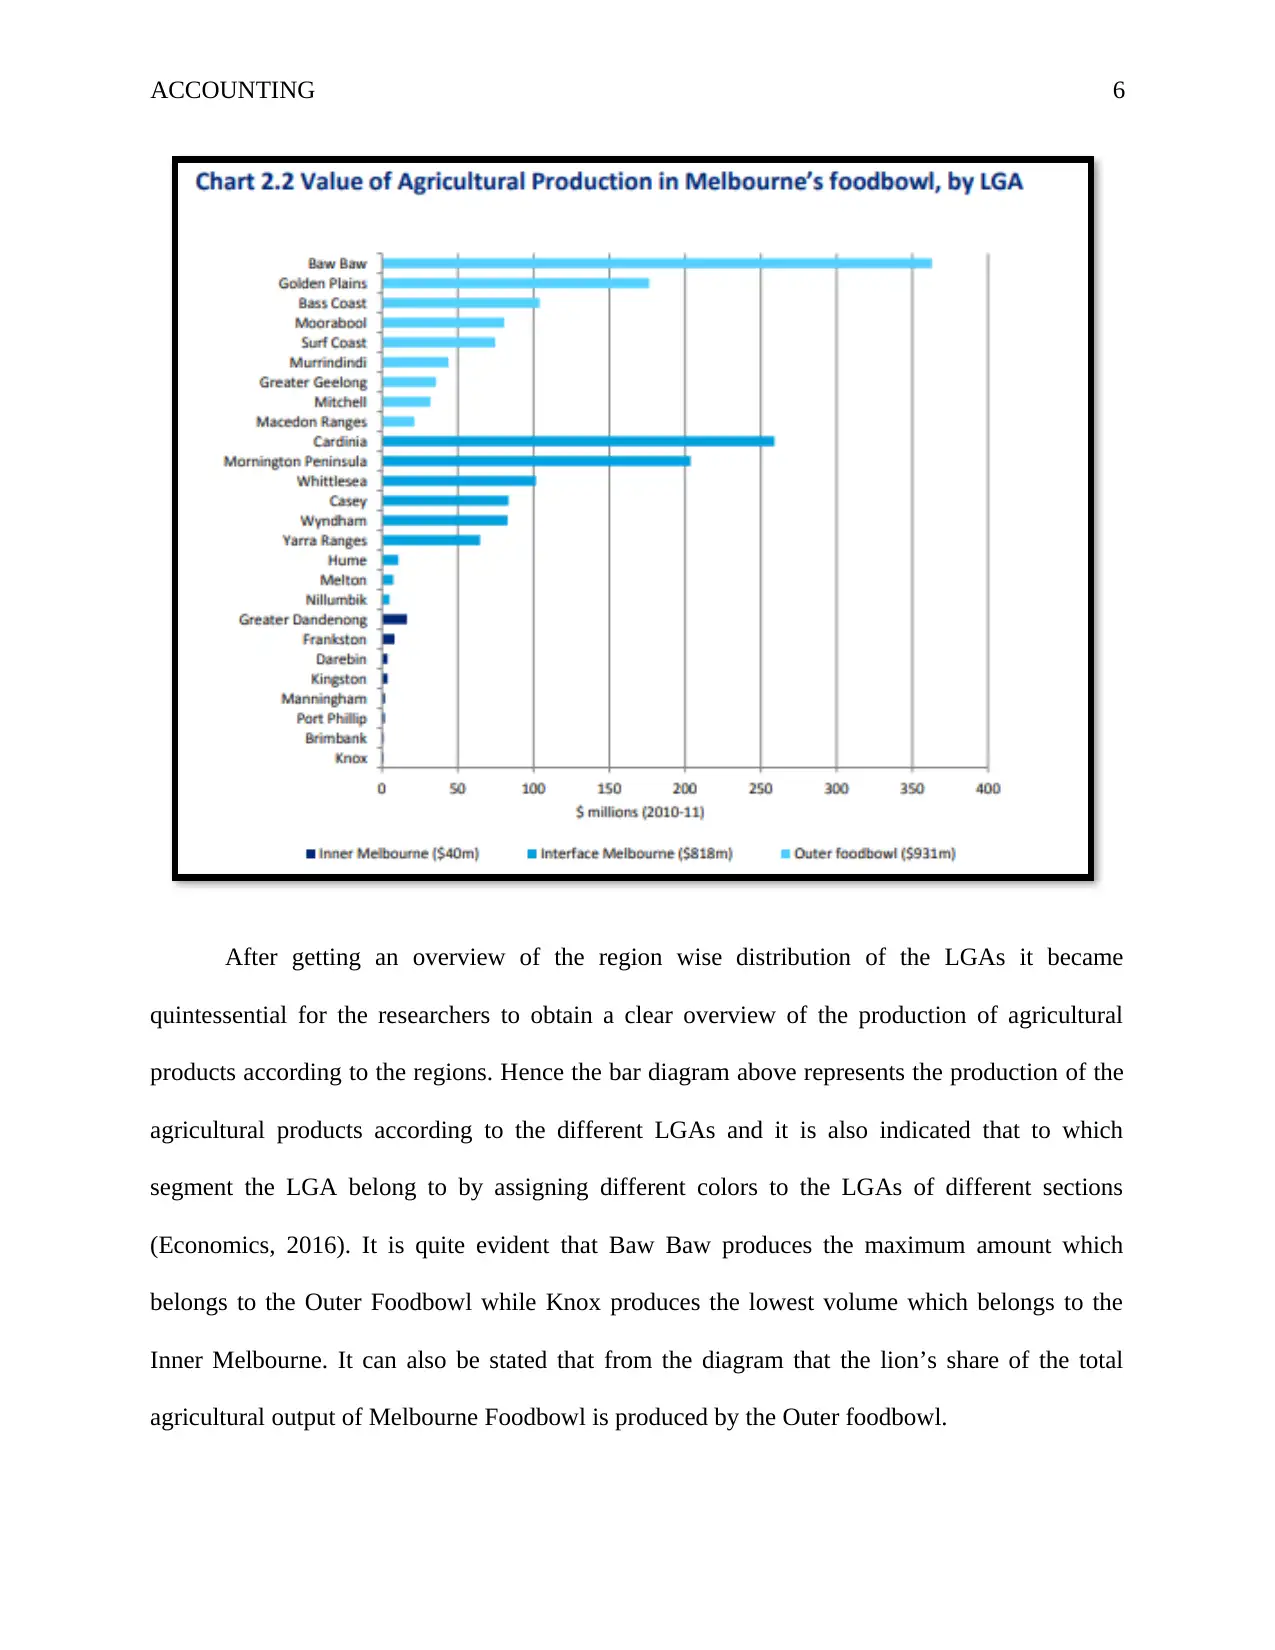
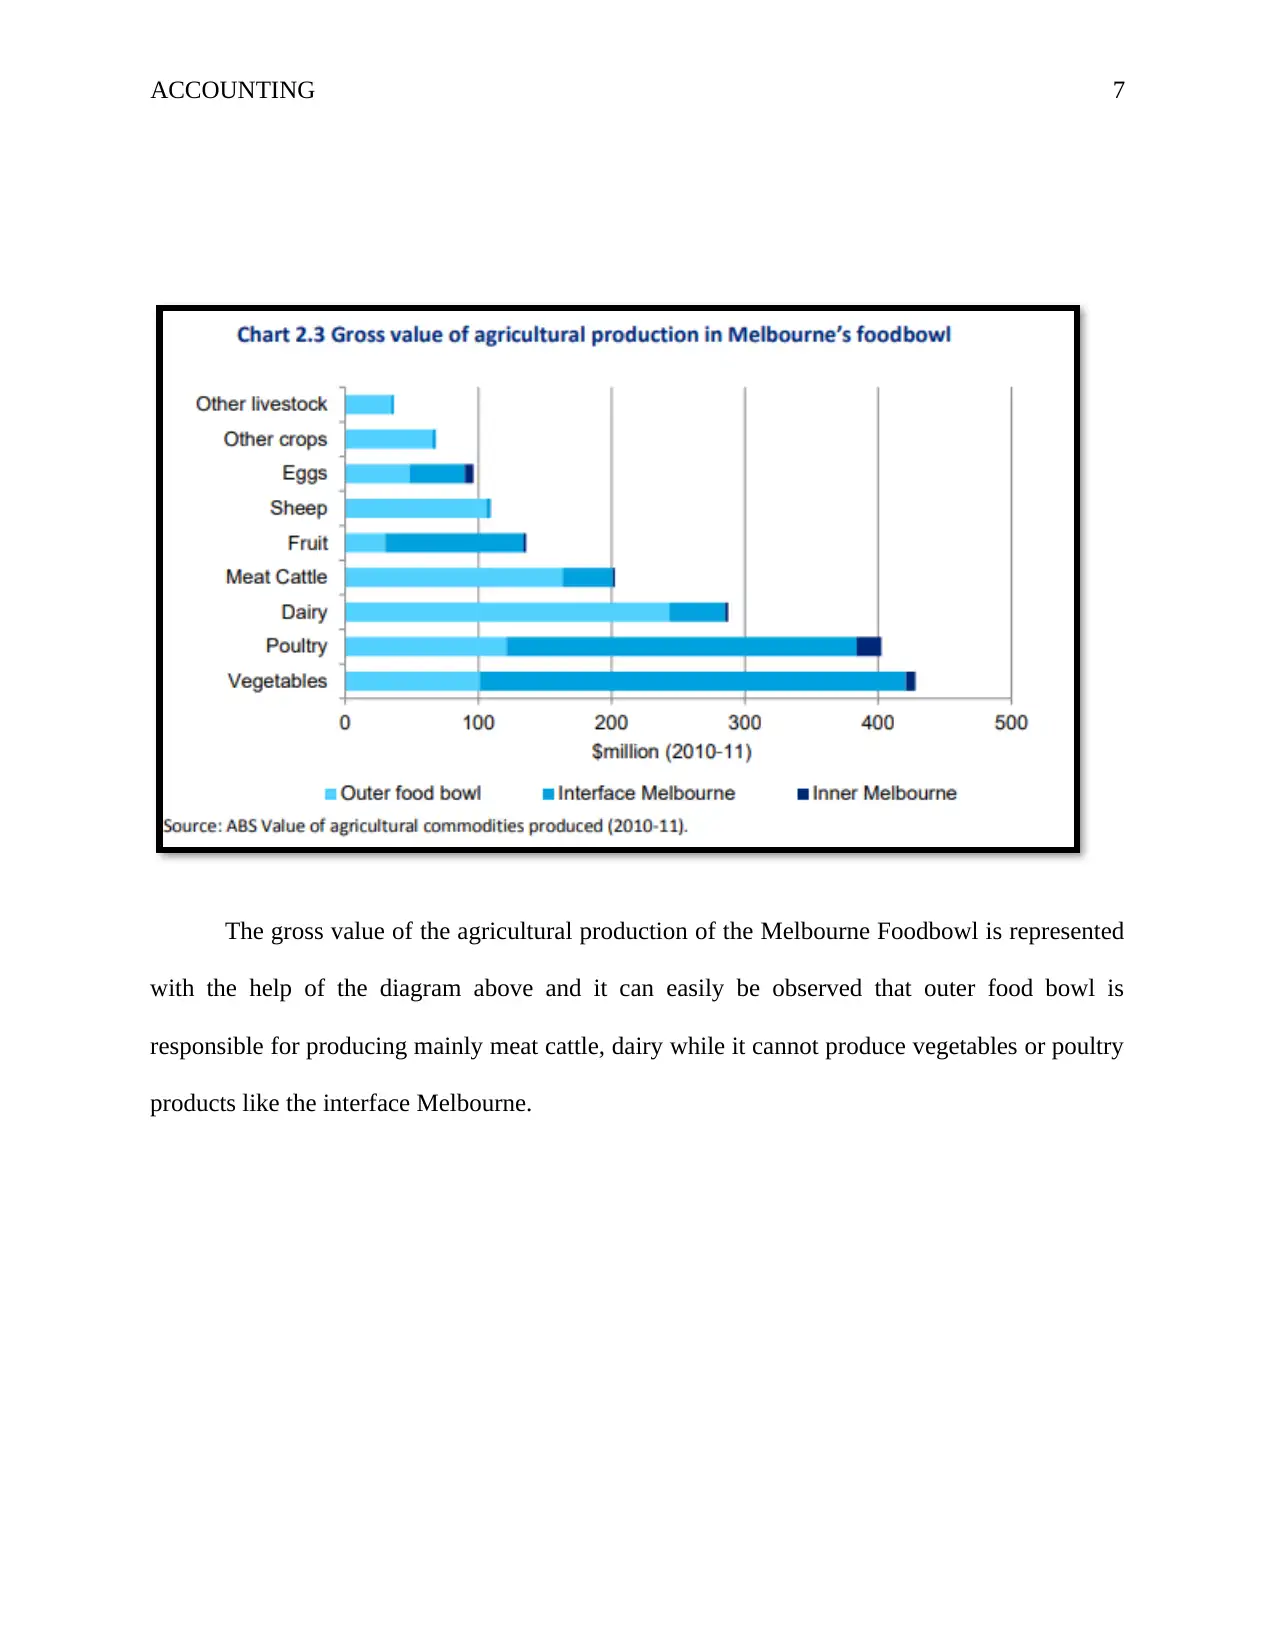
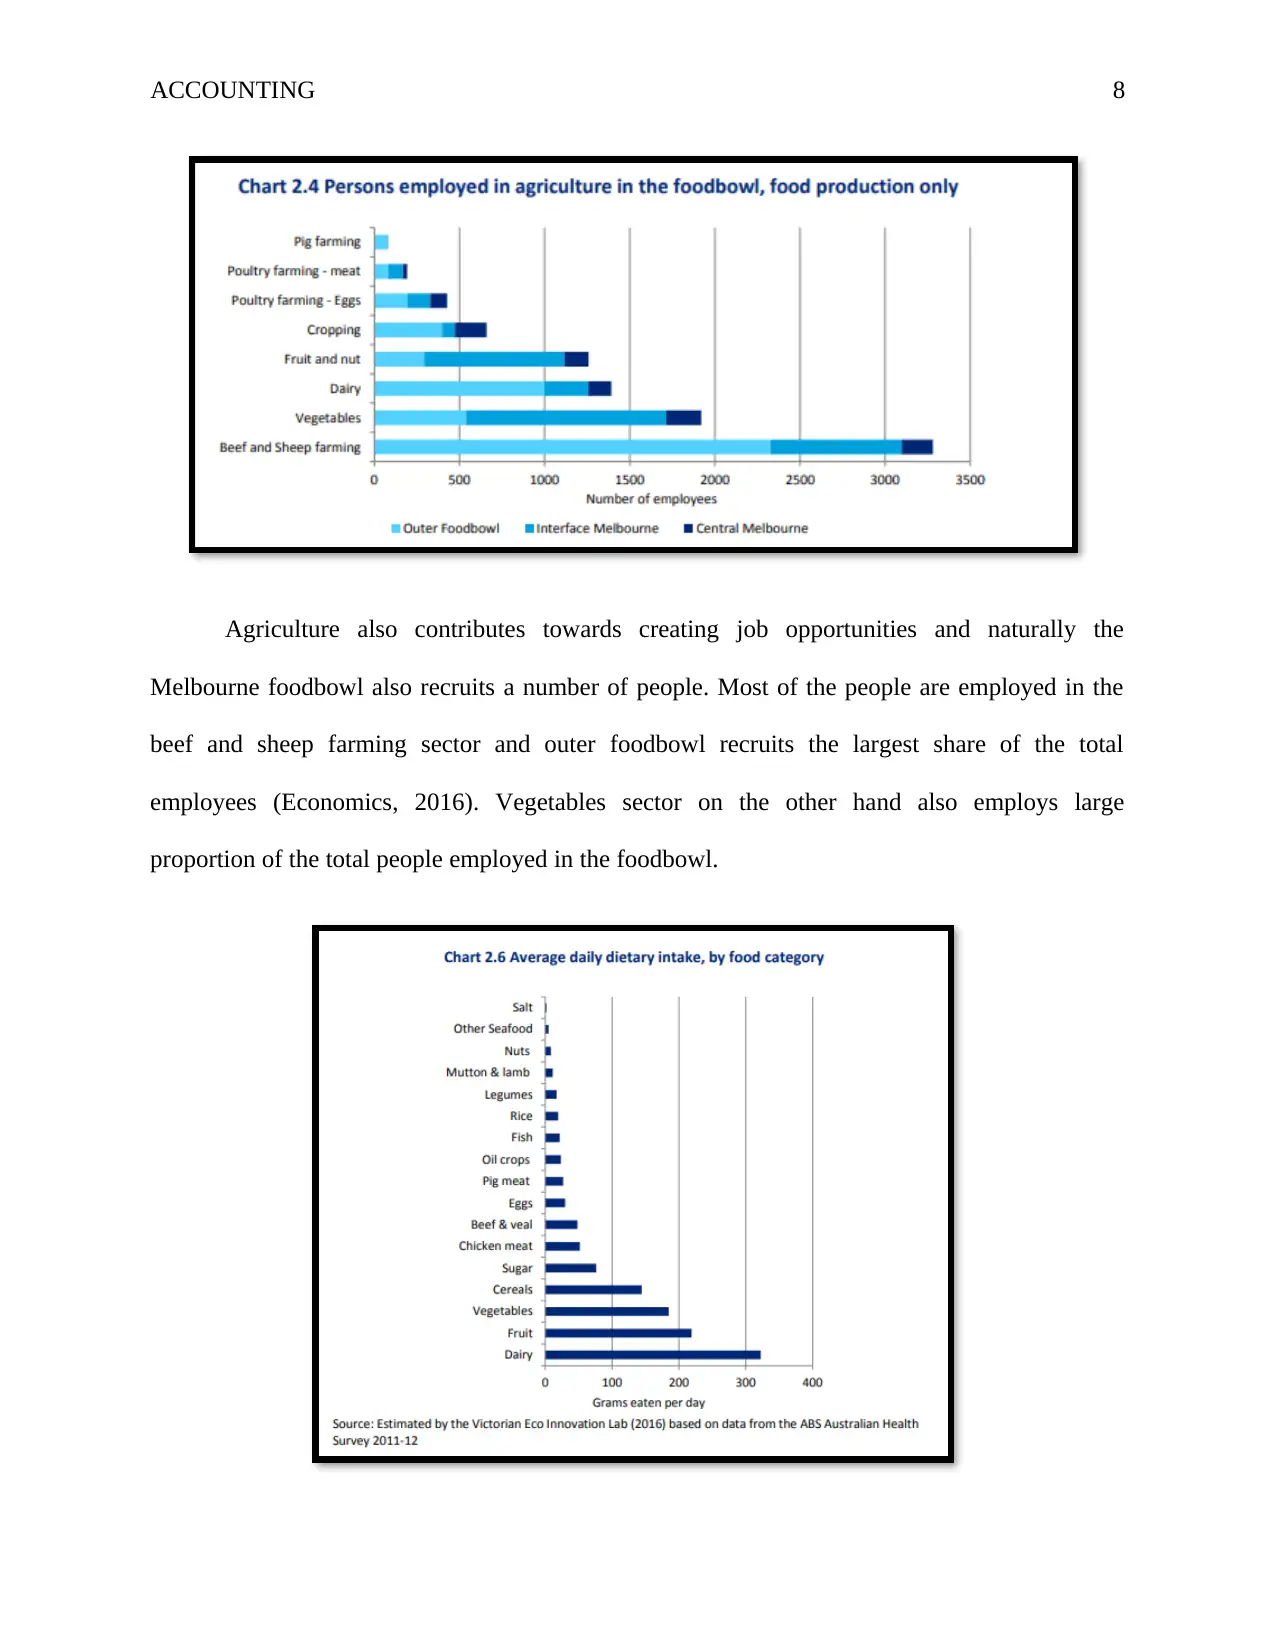
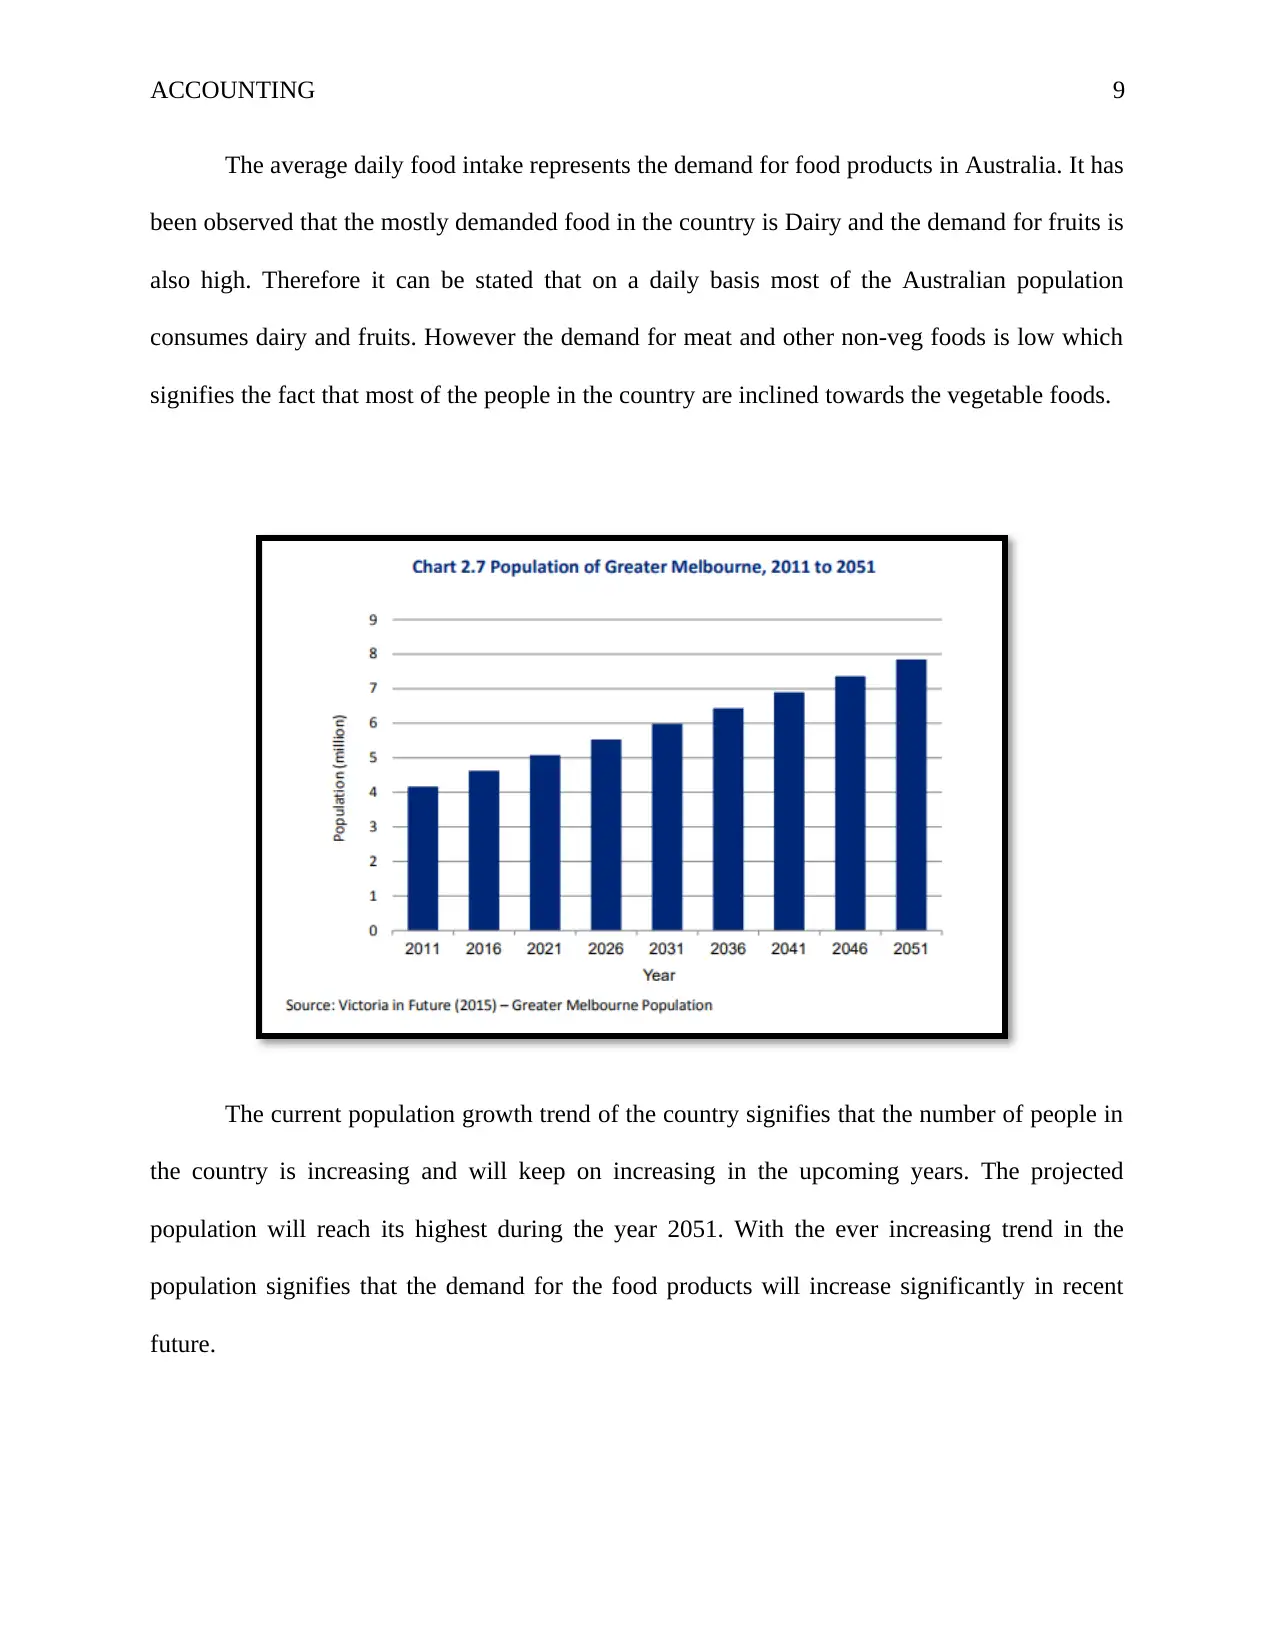
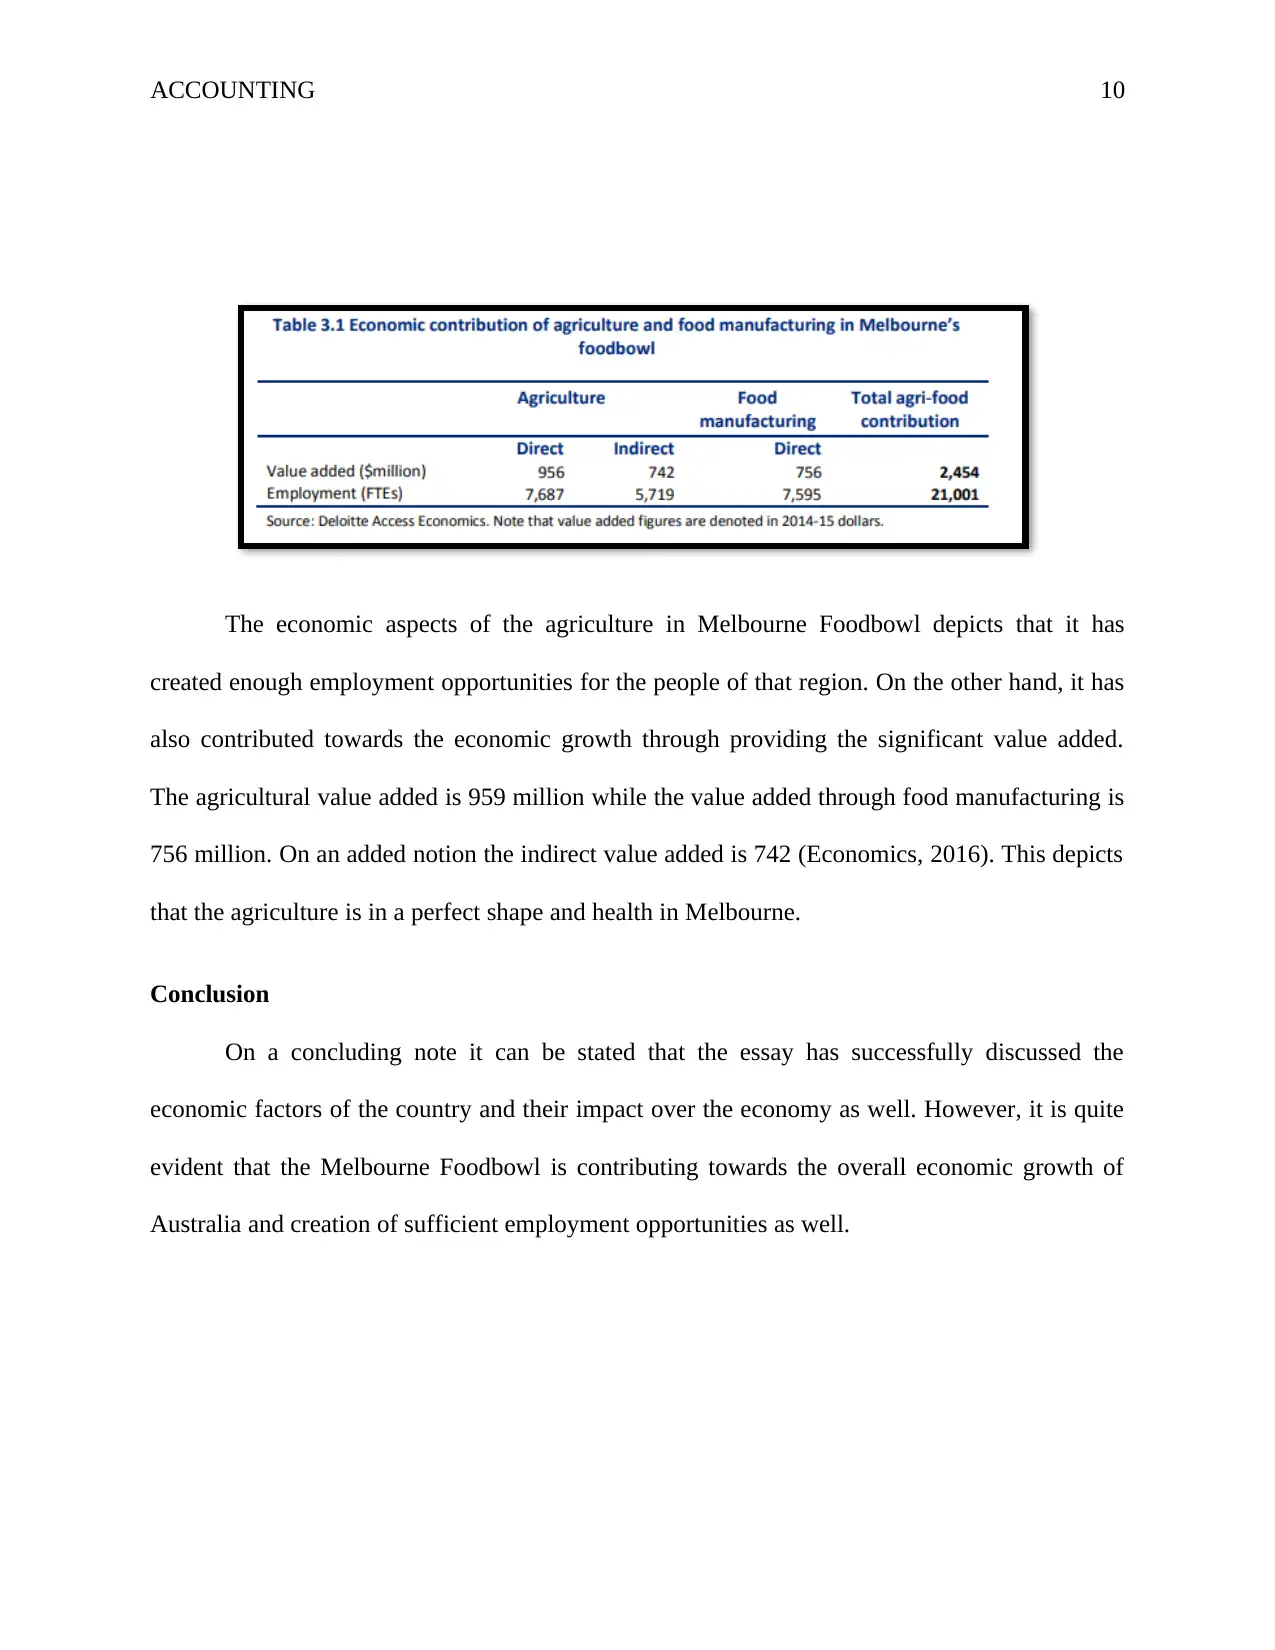
This report delves into the economic contribution of the Melbourne Foodbowl, a collaborative project involving Deakin University, Victorian Eco-innovation Lab, and Sustain: The Australian Food Network. It focuses on the economic analysis conducted by Deloitte Access Economics, highlighting the foodbowl's significance in Melbourne's food supply and the economic benefits derived from the region. The report segments the foodbowl into Inner Melbourne, Interface Melbourne, and Outer Foodbowl, examining land distribution, agricultural production, and employment opportunities. It emphasizes the Outer Foodbowl's dominance in agricultural output and the sector's role in job creation. Furthermore, it discusses the demand for food products, population growth trends, and the overall economic impact of agriculture and food manufacturing in the Melbourne Foodbowl, underscoring its contribution to Australia's economic growth.

Running head: ACCOUNTING
Accounting
Name of the Student:
Name of the University:
Author’s Note:
Accounting
Name of the Student:
Name of the University:
Author’s Note:
Paraphrase This Document
Need a fresh take? Get an instant paraphrase of this document with our AI Paraphraser

ACCOUNTING 2
Table of Contents
Introduction......................................................................................................................................3
Discussion........................................................................................................................................3
Conclusion.....................................................................................................................................10
Reference List................................................................................................................................11

ACCOUNTING 3
Introduction
Foodprint Melbourne is a collaborative project which is being carried out between the
Deakin University, Victorian Eco-innovation Lab and Sustain: The Australian Food Network.
The Victorian Eco Innovation Lab of the University of Melbourne has held Deloitte Access
Economics with the responsibility to perform an economic analysis which in turn will help to
support the part three of the project. This research project aims at investigating the foodbowl of
Melbourne which is the food growing regions situated in the outer fringe of Melbourne
(Economics, 2016). There are mainly three relevant sections of the project while this particular
essay will take into account only part three of the project in which an economic analysis of the
Melbourne Foodbowl is performed that stated the economic benefits of the region and the future
benefits that can be accrued through this foodbowl.
Discussion
The Melbourne Foodbowl comprises of the Local Government Areas which is outlined in
the figures below,
⊘ This is a preview!⊘
Do you want full access?
Subscribe today to unlock all pages.

Trusted by 1+ million students worldwide

ACCOUNTING 4
In order to depict the different activities undertaken by the per-urban, urban and rural
areas the foodbowl has been divided into three different sections.
Inner Melbourne: It incorporates the well-populated LGAs which predominantly lies
within the urban boundary of Melbourne.
Interface Melbourne: This area mainly incorporates those LGAs which lies within the edges of
the greater Melbourne and share the boundary with the urban fringe.
Outer Foodbowl: Takes into account the predominantly inner rural areas.
The pie diagram below represents the land distribution of the foodbowl that is how much
is land is amalgamated within each of the three regions of Melbourne Foodbowl. It has been
observed that the Melbourne Foodbowl accounts for more than 1.7 million hectares of land
which amounts up to nearly 12% of the total agricultural land of Victoria (Economics, 2016).
Out of this land approximately 3/4th of it is located in the Outer Foodbowl which is beyond the
Paraphrase This Document
Need a fresh take? Get an instant paraphrase of this document with our AI Paraphraser

ACCOUNTING 5
boundaries of the urban areas. On the other hand, the total agricultural land within the Greater
Melbourne is entirely located across the interface areas while the inner Melbourne only accounts
up to 0.1% of the total agricultural land of Victoria.
boundaries of the urban areas. On the other hand, the total agricultural land within the Greater
Melbourne is entirely located across the interface areas while the inner Melbourne only accounts
up to 0.1% of the total agricultural land of Victoria.

ACCOUNTING 6
After getting an overview of the region wise distribution of the LGAs it became
quintessential for the researchers to obtain a clear overview of the production of agricultural
products according to the regions. Hence the bar diagram above represents the production of the
agricultural products according to the different LGAs and it is also indicated that to which
segment the LGA belong to by assigning different colors to the LGAs of different sections
(Economics, 2016). It is quite evident that Baw Baw produces the maximum amount which
belongs to the Outer Foodbowl while Knox produces the lowest volume which belongs to the
Inner Melbourne. It can also be stated that from the diagram that the lion’s share of the total
agricultural output of Melbourne Foodbowl is produced by the Outer foodbowl.
⊘ This is a preview!⊘
Do you want full access?
Subscribe today to unlock all pages.

Trusted by 1+ million students worldwide

ACCOUNTING 7
The gross value of the agricultural production of the Melbourne Foodbowl is represented
with the help of the diagram above and it can easily be observed that outer food bowl is
responsible for producing mainly meat cattle, dairy while it cannot produce vegetables or poultry
products like the interface Melbourne.
Paraphrase This Document
Need a fresh take? Get an instant paraphrase of this document with our AI Paraphraser

ACCOUNTING 8
Agriculture also contributes towards creating job opportunities and naturally the
Melbourne foodbowl also recruits a number of people. Most of the people are employed in the
beef and sheep farming sector and outer foodbowl recruits the largest share of the total
employees (Economics, 2016). Vegetables sector on the other hand also employs large
proportion of the total people employed in the foodbowl.

ACCOUNTING 9
The average daily food intake represents the demand for food products in Australia. It has
been observed that the mostly demanded food in the country is Dairy and the demand for fruits is
also high. Therefore it can be stated that on a daily basis most of the Australian population
consumes dairy and fruits. However the demand for meat and other non-veg foods is low which
signifies the fact that most of the people in the country are inclined towards the vegetable foods.
The current population growth trend of the country signifies that the number of people in
the country is increasing and will keep on increasing in the upcoming years. The projected
population will reach its highest during the year 2051. With the ever increasing trend in the
population signifies that the demand for the food products will increase significantly in recent
future.
⊘ This is a preview!⊘
Do you want full access?
Subscribe today to unlock all pages.

Trusted by 1+ million students worldwide

ACCOUNTING 10
The economic aspects of the agriculture in Melbourne Foodbowl depicts that it has
created enough employment opportunities for the people of that region. On the other hand, it has
also contributed towards the economic growth through providing the significant value added.
The agricultural value added is 959 million while the value added through food manufacturing is
756 million. On an added notion the indirect value added is 742 (Economics, 2016). This depicts
that the agriculture is in a perfect shape and health in Melbourne.
Conclusion
On a concluding note it can be stated that the essay has successfully discussed the
economic factors of the country and their impact over the economy as well. However, it is quite
evident that the Melbourne Foodbowl is contributing towards the overall economic growth of
Australia and creation of sufficient employment opportunities as well.
Paraphrase This Document
Need a fresh take? Get an instant paraphrase of this document with our AI Paraphraser

ACCOUNTING 11
Reference List
Economics, D.A., 2016. The economic contribution of Melbourne’s Foodbowl, A report for the
Foodprint Melbourne project, University of Melbourne. Melbourne: Deloitte Access
Economics.
Reference List
Economics, D.A., 2016. The economic contribution of Melbourne’s Foodbowl, A report for the
Foodprint Melbourne project, University of Melbourne. Melbourne: Deloitte Access
Economics.
1 out of 11

Your All-in-One AI-Powered Toolkit for Academic Success.
+13062052269
info@desklib.com
Available 24*7 on WhatsApp / Email
Unlock your academic potential
Copyright © 2020–2025 A2Z Services. All Rights Reserved. Developed and managed by ZUCOL.