Analyzing Footwear Market: A Report on Kent Institute Student Trends
VerifiedAdded on 2023/06/11
|16
|3053
|138
Report
AI Summary
This report investigates footwear preferences among Kent Institute students to inform a new footwear business venture. A survey of 20 students, randomly selected from a population of over 1000, revealed that closed leather shoes are the most preferred style. The average shoe sizes for males and females were determined to be 42.5 and 37.9, respectively. Acceptable price ranges were identified as A$(29.1715 – 39.2285) for maximum cost and A$(10.44399 – 15.75601) for minimum cost. The report recommends prioritizing the supply of closed leather shoes in the shop to meet student demand. Statistical analysis included descriptive statistics and interval estimation to inform these conclusions.
Footwear fashions marketing report
i
i
Paraphrase This Document
Need a fresh take? Get an instant paraphrase of this document with our AI Paraphraser
Executive summary
This report was with the aim of addressing the market requirements for footwear business when
supplying goods into the shop with Kent institute students as the prospective customers. A
population of over 1000 students were targeted by the study out of which 20 sample was
randomly selected. The applied data collection technique in acquiring data from the participants
was questionnaire which led to collecting both quantitative and qualitative data. From the result,
the most preferred type of shoes by the students in the sample was leather closed shoes. The
average male and female shoe sizes from the results was determined to be 42.5 and 37.9
respectively. The range of price for which shoes could best sell in the area was at intervals of
A$(29.1715 – 39.2285) for maximum cost and A$(10.44399 – 15.75601) for minimum cost. It
was then concluded and recommended that the shoe type supplied in the shop should be more of
the closed leather shoes.
ii
Contents
Executive summary......................................................................................................................................ii
Introduction.................................................................................................................................................1
Research objectives.................................................................................................................................1
Research questions..................................................................................................................................2
Methods of data collection..........................................................................................................................2
Targeted population................................................................................................................................2
Data collection methods..........................................................................................................................3
Data analysis............................................................................................................................................3
Summary of the dataset..............................................................................................................................5
Descriptive data analysis...........................................................................................................................10
Interval estimation....................................................................................................................................11
Conclusion and recommendations............................................................................................................11
References.................................................................................................................................................13
List of figures
Figure 1………………………………………………..............………………………………………………………………………………………5
Figure 2……………………………………………………………………………………………………………………………………………………6
Figure 3…………………………………………………………………………………………..……………………………………………………….7
Figure 4…………………………………………………………………………………………………………………………………………………..8
Figure 5…………………………………………………………………………………………………………………………………………………..9
List of tables
Table 1: Data in the dataset………………………………………………………………………………………………………………4
Table 2: Descriptive Statistics……………………………………………………………….10
Table 3: Grouped shoe size summary……………………………………………………….10
iii
⊘ This is a preview!⊘
Do you want full access?
Subscribe today to unlock all pages.
Trusted by 1+ million students worldwide
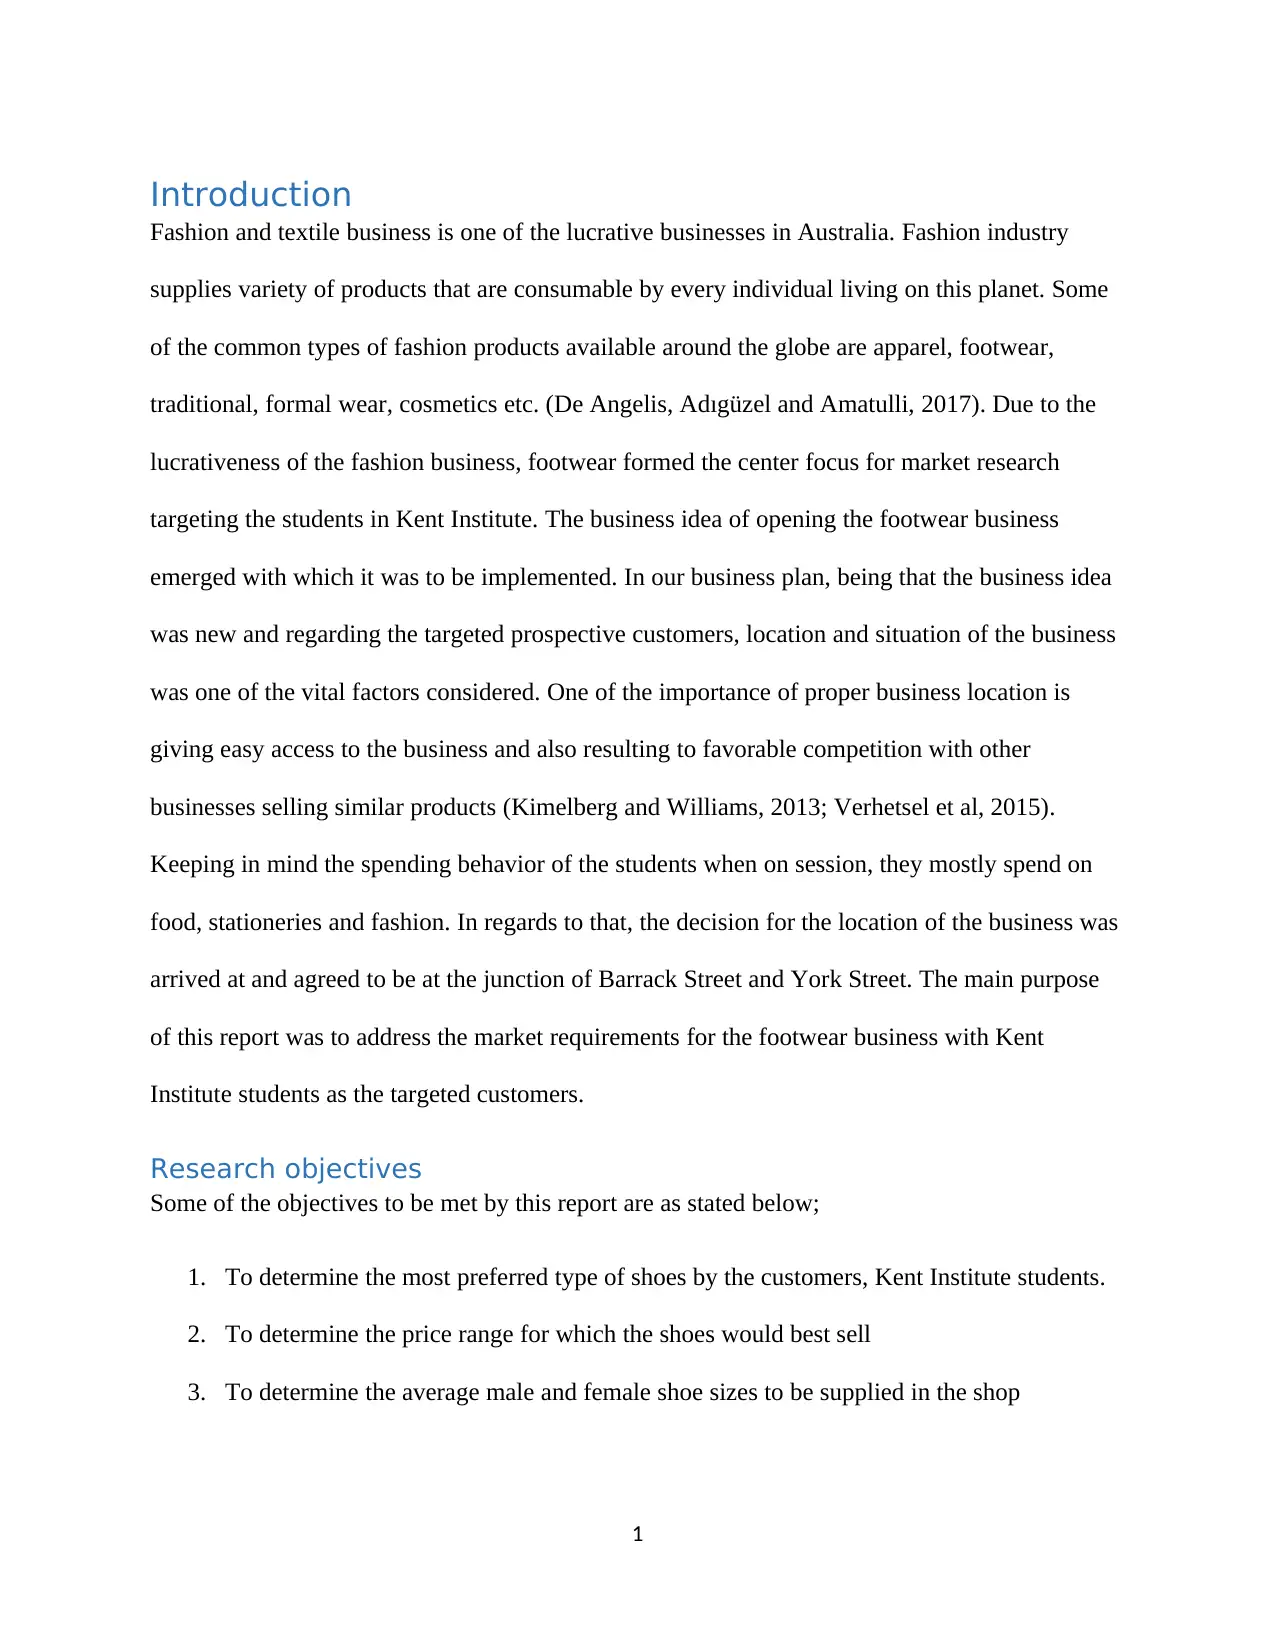
Introduction
Fashion and textile business is one of the lucrative businesses in Australia. Fashion industry
supplies variety of products that are consumable by every individual living on this planet. Some
of the common types of fashion products available around the globe are apparel, footwear,
traditional, formal wear, cosmetics etc. (De Angelis, Adıgüzel and Amatulli, 2017). Due to the
lucrativeness of the fashion business, footwear formed the center focus for market research
targeting the students in Kent Institute. The business idea of opening the footwear business
emerged with which it was to be implemented. In our business plan, being that the business idea
was new and regarding the targeted prospective customers, location and situation of the business
was one of the vital factors considered. One of the importance of proper business location is
giving easy access to the business and also resulting to favorable competition with other
businesses selling similar products (Kimelberg and Williams, 2013; Verhetsel et al, 2015).
Keeping in mind the spending behavior of the students when on session, they mostly spend on
food, stationeries and fashion. In regards to that, the decision for the location of the business was
arrived at and agreed to be at the junction of Barrack Street and York Street. The main purpose
of this report was to address the market requirements for the footwear business with Kent
Institute students as the targeted customers.
Research objectives
Some of the objectives to be met by this report are as stated below;
1. To determine the most preferred type of shoes by the customers, Kent Institute students.
2. To determine the price range for which the shoes would best sell
3. To determine the average male and female shoe sizes to be supplied in the shop
1
Paraphrase This Document
Need a fresh take? Get an instant paraphrase of this document with our AI Paraphraser
Research questions
1. What is the most preferred type of shoes by the customers, Kent institute students?
2. What range of price would the supplied shoes best sell?
3. What is the average male and female shoe sizes to be supplied in the shop?
Methods of data collection
This section will cover target population and sample size, data collection techniques and data
analysis.
Targeted population
The targeted group by this research were the Kent institute students whose population was over
1000 students. Population is the total number of items targeted by the study (Colby and Ortman,
2017), in this case the Kent institute students. The students who participated in the research
process were selected through random sampling. Sampling is the process of choosing the suitable
sample size to be engaged in the study (Palinkas et al, 2015; Cleary, Horsfall, and Hayter, 2014).
Sample is the proportion and a subset of the population of objects under study (Malterud,
Siersma and Guassora, 2016). Sample size of 20 participants was used who were randomly
selected from the population using the simple random sampling method. The most suitable
sample size for the population in this research at a margin of error of 0.05 would be including
278 participants to participate in the data collection process. In that regard therefore, the size of
the sample used was small which are associated with some of the advantages such as time saving
and cost effectiveness as compared to when the large sample size would have been used (Hair,
Sarstedt, Pieper and Ringle, 2012). The sample size used in this research was assumed to have
fully represented the characteristics in the population and that the results could be relied on.
2
Data collection methods
Data collection methods enable the researchers to collect or collate data from the participants in
regards to the subject under investigation. Such methods include surveys, questionnaires,
interviews, etc. From the randomly selected sample size of 20 respondents, the respondents were
supplied with the questionnaires which were structured with the closed and open ended
questions. The questionnaires were administered by the researcher in the data collection process
where the researcher would provide clarity to the respondents where questions seem unclear. The
questionnaires were structured with ten short answer questions. This method of data collection
was appropriate since it saves respondents’ time and also allow them to give their responses in
relaxed manner. Where multiple choices were available for some of the questions, the participant
was required to pick only one choice out of the multiple choices. Resulted data from this method
depending on the nature and structure of the questions were both quantitative and qualitative.
Closed ended questions resulted to categorical variables whereas open ended questions resulted
to numerical continuous variables.
Data analysis
The data analysis methods applied in this research were frequency and descriptive statistics in
order to draw meaning from the data. Both excel and SPSS were the statistical software used in
the analysis of data in the representation of data on the tables and graphs for easy understanding
and interpretations. Categorical variables were coded with numerical values and their scale
measures were nominal with numerical variables taking scale measurement. Examples of the
categorical variables from the dataset were; gender, Shoe-type, shoe-color, official-casual, buy-
interval and shoelaces. On the other hand, numerical variables were; shoe-size, max-cost and
min-cost. The dataset was as in the table below;
Table 1: Data in the dataset 3
⊘ This is a preview!⊘
Do you want full access?
Subscribe today to unlock all pages.
Trusted by 1+ million students worldwide
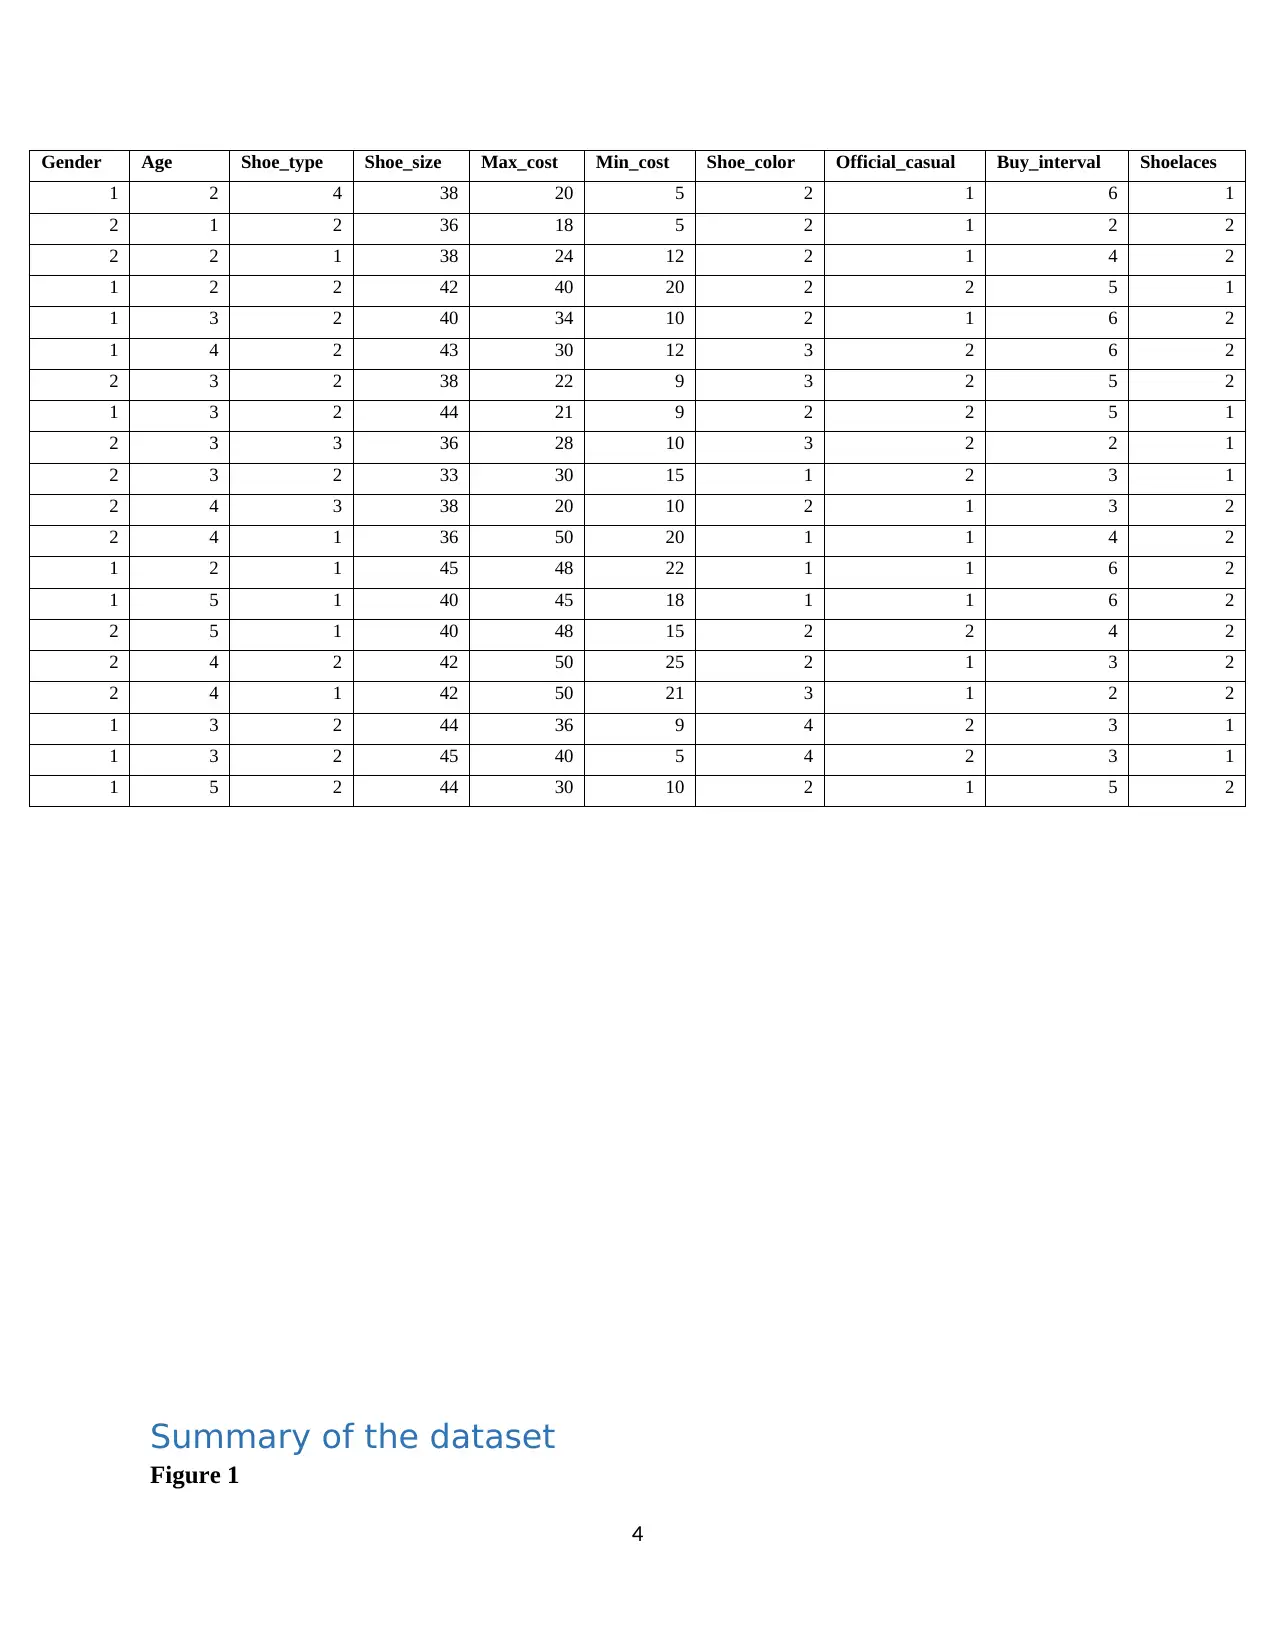
Gender Age Shoe_type Shoe_size Max_cost Min_cost Shoe_color Official_casual Buy_interval Shoelaces
1 2 4 38 20 5 2 1 6 1
2 1 2 36 18 5 2 1 2 2
2 2 1 38 24 12 2 1 4 2
1 2 2 42 40 20 2 2 5 1
1 3 2 40 34 10 2 1 6 2
1 4 2 43 30 12 3 2 6 2
2 3 2 38 22 9 3 2 5 2
1 3 2 44 21 9 2 2 5 1
2 3 3 36 28 10 3 2 2 1
2 3 2 33 30 15 1 2 3 1
2 4 3 38 20 10 2 1 3 2
2 4 1 36 50 20 1 1 4 2
1 2 1 45 48 22 1 1 6 2
1 5 1 40 45 18 1 1 6 2
2 5 1 40 48 15 2 2 4 2
2 4 2 42 50 25 2 1 3 2
2 4 1 42 50 21 3 1 2 2
1 3 2 44 36 9 4 2 3 1
1 3 2 45 40 5 4 2 3 1
1 5 2 44 30 10 2 1 5 2
Summary of the dataset
Figure 1
4
Paraphrase This Document
Need a fresh take? Get an instant paraphrase of this document with our AI Paraphraser
<18 yrs 18-20 yrs 21-23 yrs 24-26 yrs >26 yrs
0%
5%
10%
15%
20%
25%
30%
35%
40%
Age of the respondents
Age
Percentage Frequency
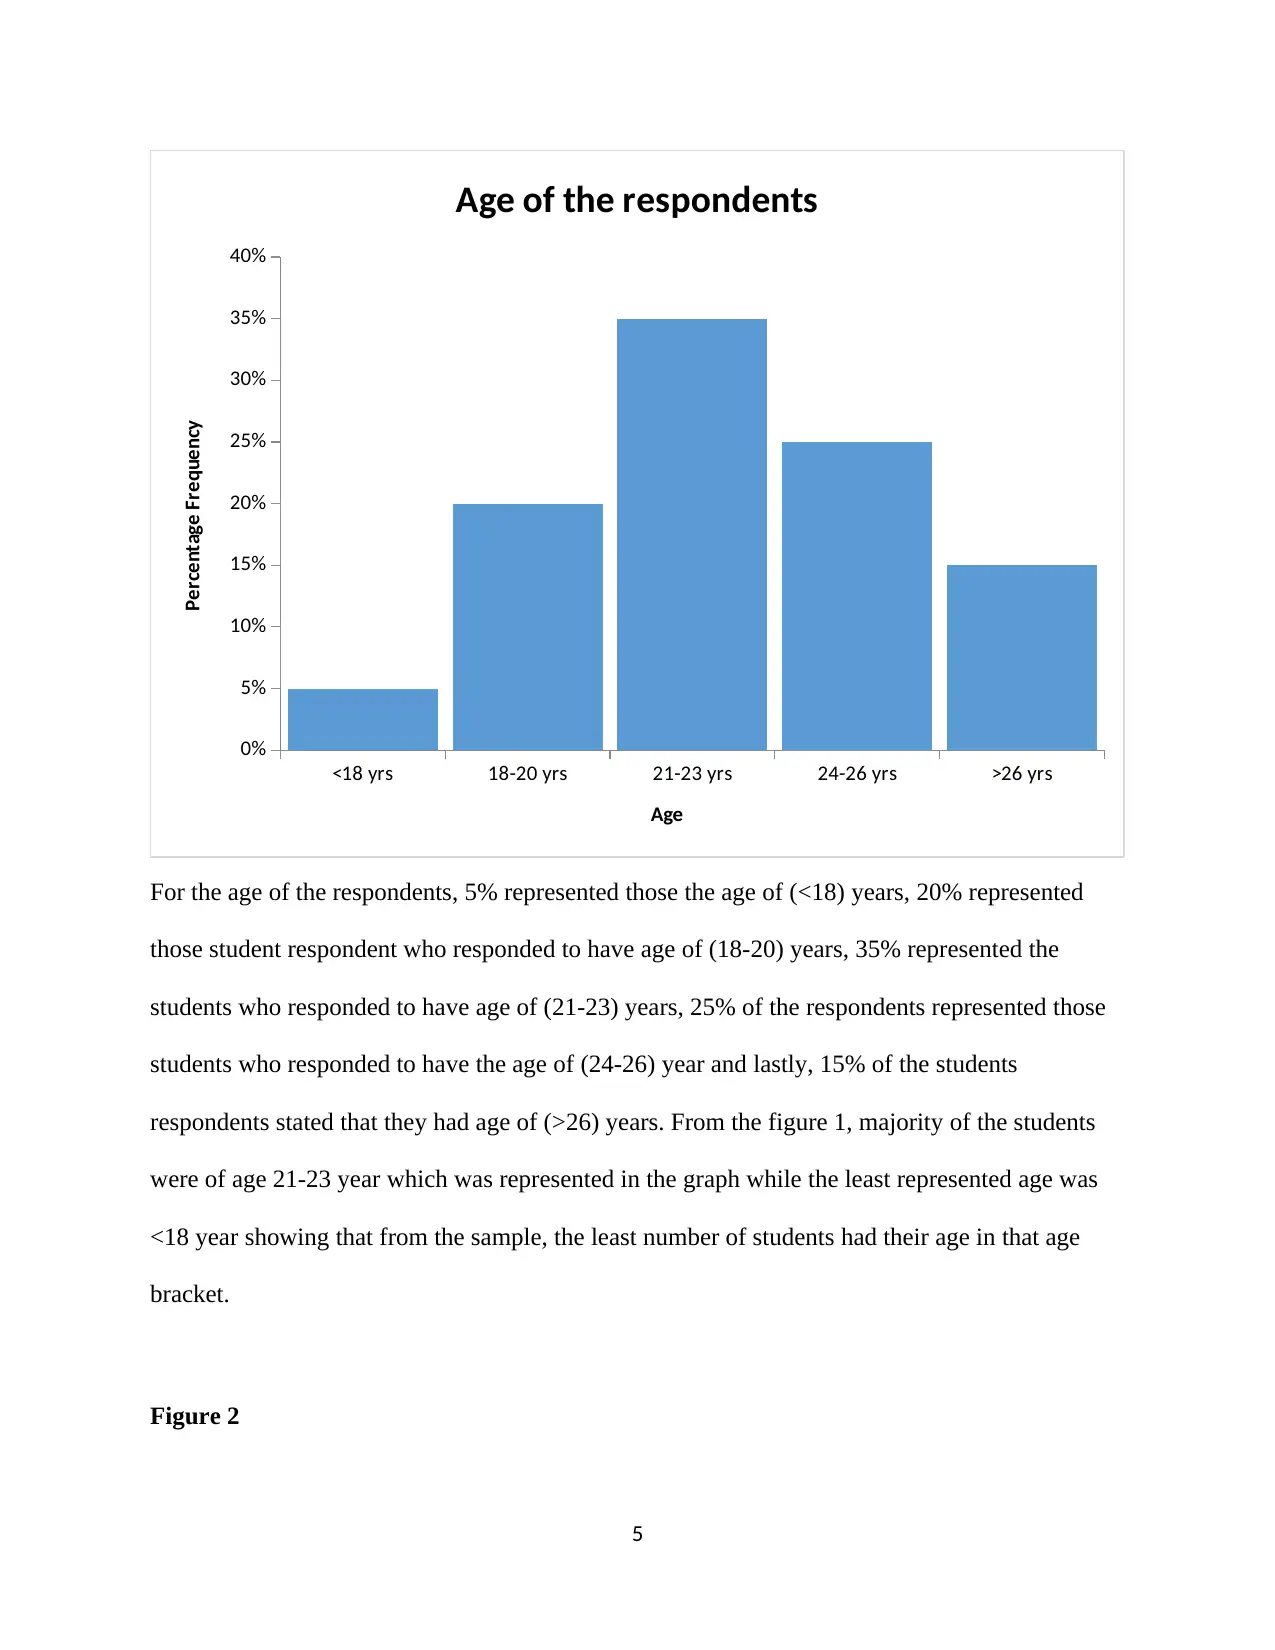
For the age of the respondents, 5% represented those the age of (<18) years, 20% represented
those student respondent who responded to have age of (18-20) years, 35% represented the
students who responded to have age of (21-23) years, 25% of the respondents represented those
students who responded to have the age of (24-26) year and lastly, 15% of the students
respondents stated that they had age of (>26) years. From the figure 1, majority of the students
were of age 21-23 year which was represented in the graph while the least represented age was
<18 year showing that from the sample, the least number of students had their age in that age
bracket.
Figure 2
5
0%
5%
10%
15%
20%
25%
30%
35%
40%
Age of the respondents
Age
Percentage Frequency
For the age of the respondents, 5% represented those the age of (<18) years, 20% represented
those student respondent who responded to have age of (18-20) years, 35% represented the
students who responded to have age of (21-23) years, 25% of the respondents represented those
students who responded to have the age of (24-26) year and lastly, 15% of the students
respondents stated that they had age of (>26) years. From the figure 1, majority of the students
were of age 21-23 year which was represented in the graph while the least represented age was
<18 year showing that from the sample, the least number of students had their age in that age
bracket.
Figure 2
5
Rubbers closed Leather closed Robbers open Leather open
0%
10%
20%
30%
40%
50%
60%
Shoe types graph
Shoe_type
Percentage Frequency
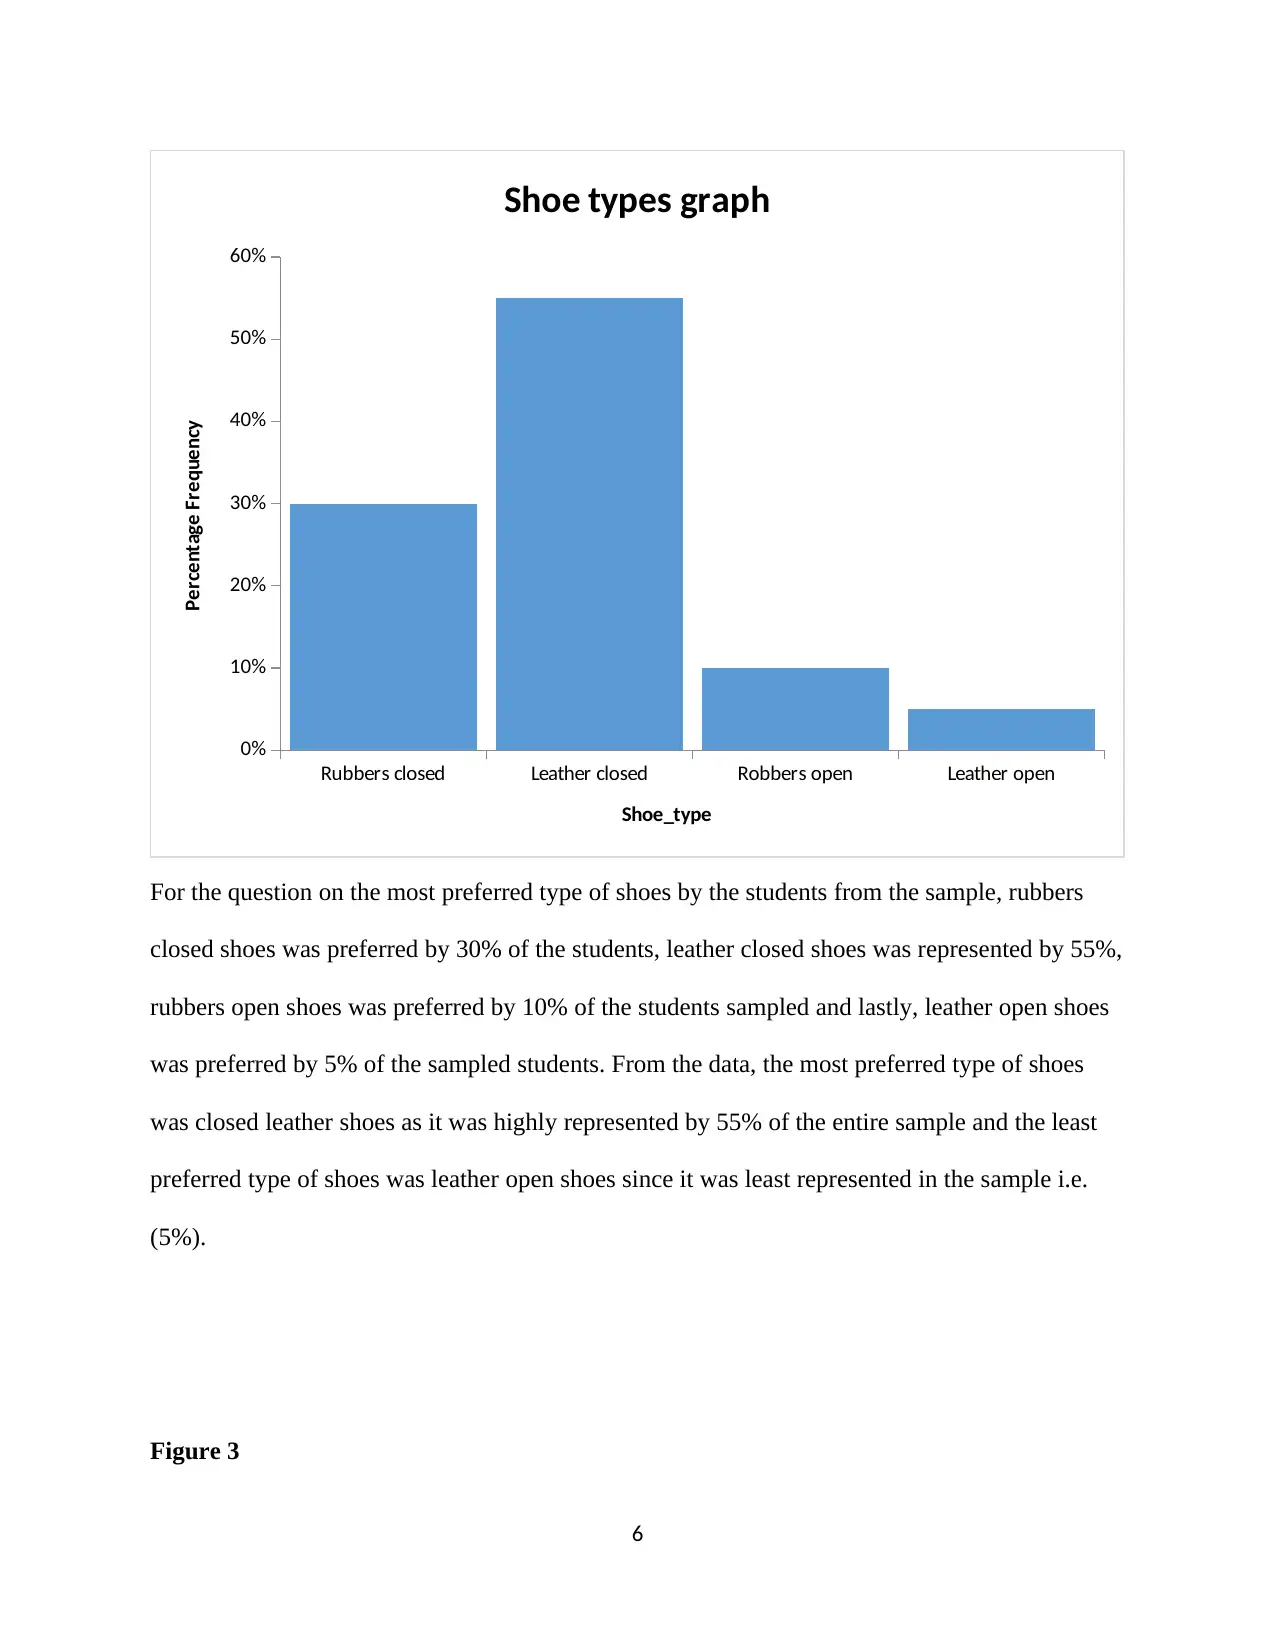
For the question on the most preferred type of shoes by the students from the sample, rubbers
closed shoes was preferred by 30% of the students, leather closed shoes was represented by 55%,
rubbers open shoes was preferred by 10% of the students sampled and lastly, leather open shoes
was preferred by 5% of the sampled students. From the data, the most preferred type of shoes
was closed leather shoes as it was highly represented by 55% of the entire sample and the least
preferred type of shoes was leather open shoes since it was least represented in the sample i.e.
(5%).
Figure 3
6
0%
10%
20%
30%
40%
50%
60%
Shoe types graph
Shoe_type
Percentage Frequency
For the question on the most preferred type of shoes by the students from the sample, rubbers
closed shoes was preferred by 30% of the students, leather closed shoes was represented by 55%,
rubbers open shoes was preferred by 10% of the students sampled and lastly, leather open shoes
was preferred by 5% of the sampled students. From the data, the most preferred type of shoes
was closed leather shoes as it was highly represented by 55% of the entire sample and the least
preferred type of shoes was leather open shoes since it was least represented in the sample i.e.
(5%).
Figure 3
6
⊘ This is a preview!⊘
Do you want full access?
Subscribe today to unlock all pages.
Trusted by 1+ million students worldwide
White Black Brown Others
0%
10%
20%
30%
40%
50%
60%
Shoe color graph
Shoe_color
Percentage Frequency
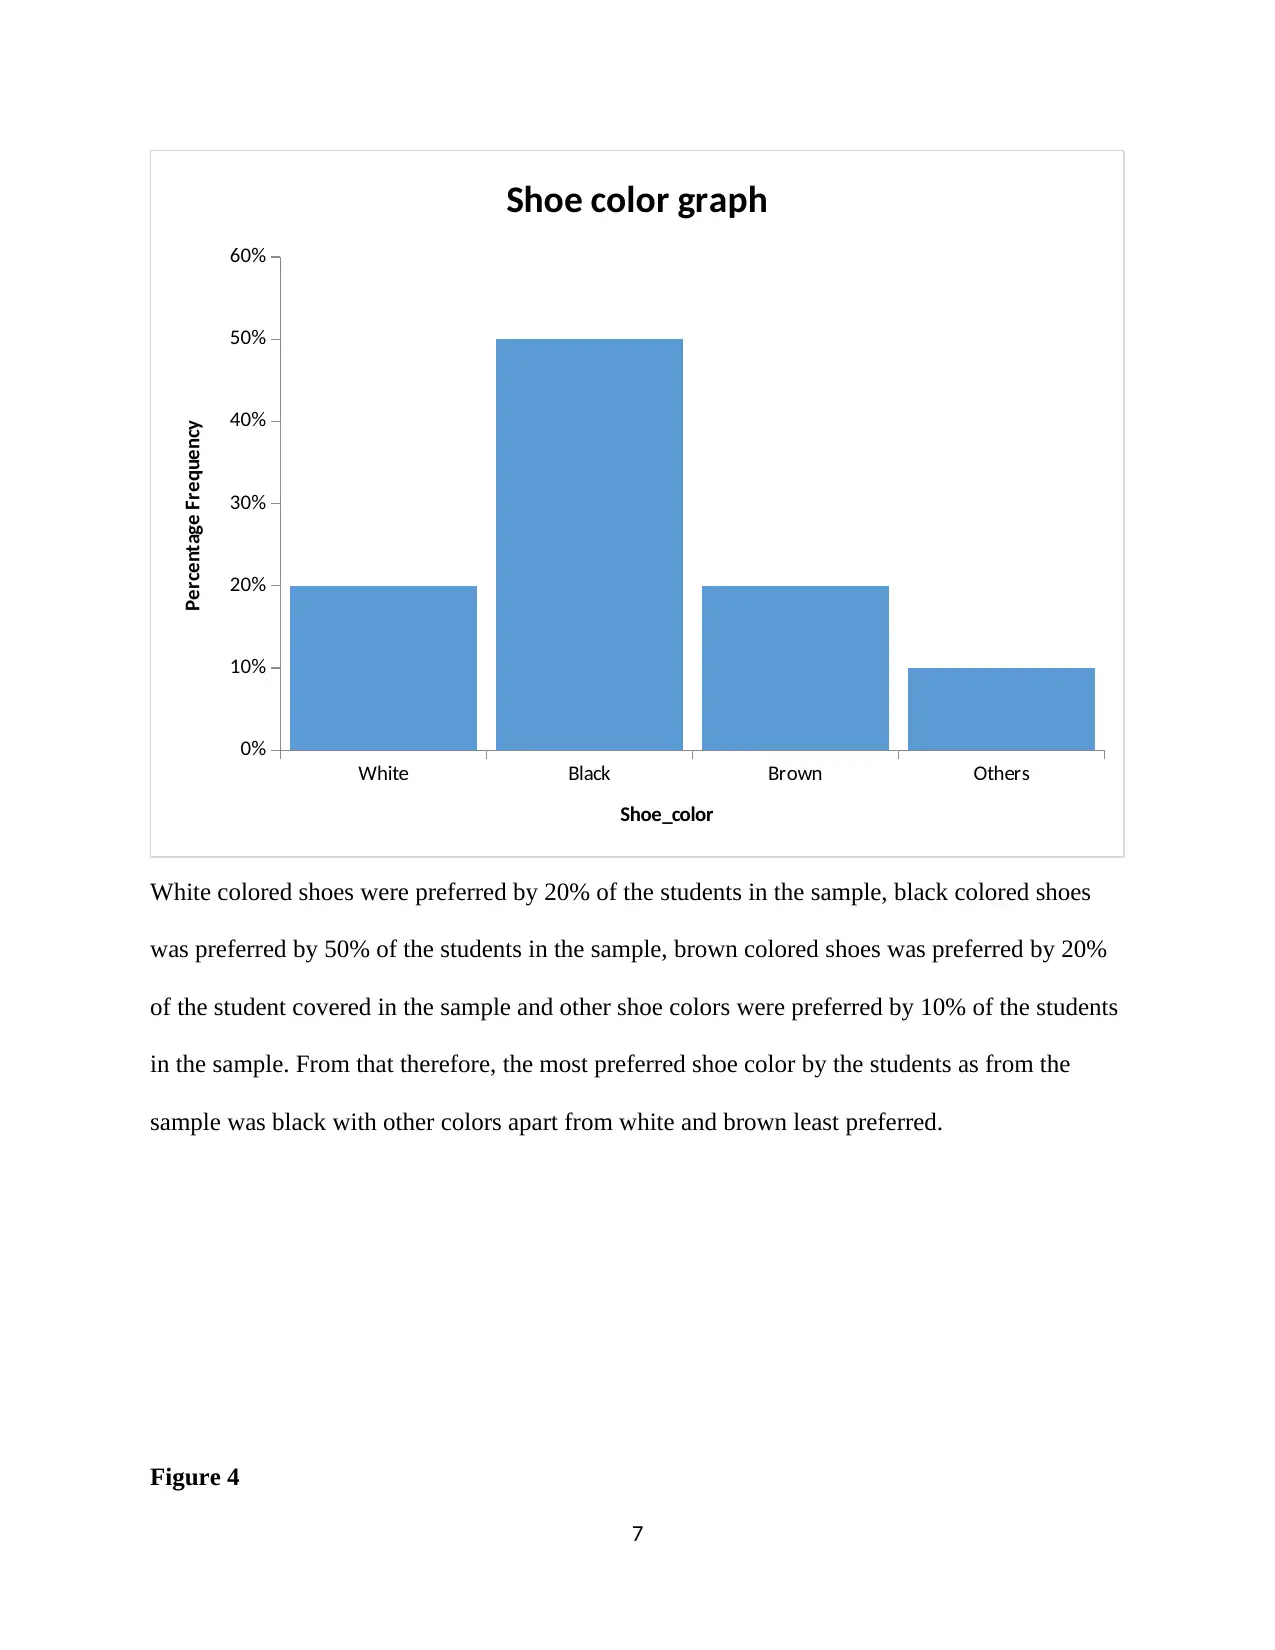
White colored shoes were preferred by 20% of the students in the sample, black colored shoes
was preferred by 50% of the students in the sample, brown colored shoes was preferred by 20%
of the student covered in the sample and other shoe colors were preferred by 10% of the students
in the sample. From that therefore, the most preferred shoe color by the students as from the
sample was black with other colors apart from white and brown least preferred.
Figure 4
7
0%
10%
20%
30%
40%
50%
60%
Shoe color graph
Shoe_color
Percentage Frequency
White colored shoes were preferred by 20% of the students in the sample, black colored shoes
was preferred by 50% of the students in the sample, brown colored shoes was preferred by 20%
of the student covered in the sample and other shoe colors were preferred by 10% of the students
in the sample. From that therefore, the most preferred shoe color by the students as from the
sample was black with other colors apart from white and brown least preferred.
Figure 4
7
Paraphrase This Document
Need a fresh take? Get an instant paraphrase of this document with our AI Paraphraser
Weekly Monthly Every 3 months Every 4 monhts Every 6 months Annually
0%
5%
10%
15%
20%
25%
30%
Frequency for buying shoes
Buy_interval
Percentage Frequency
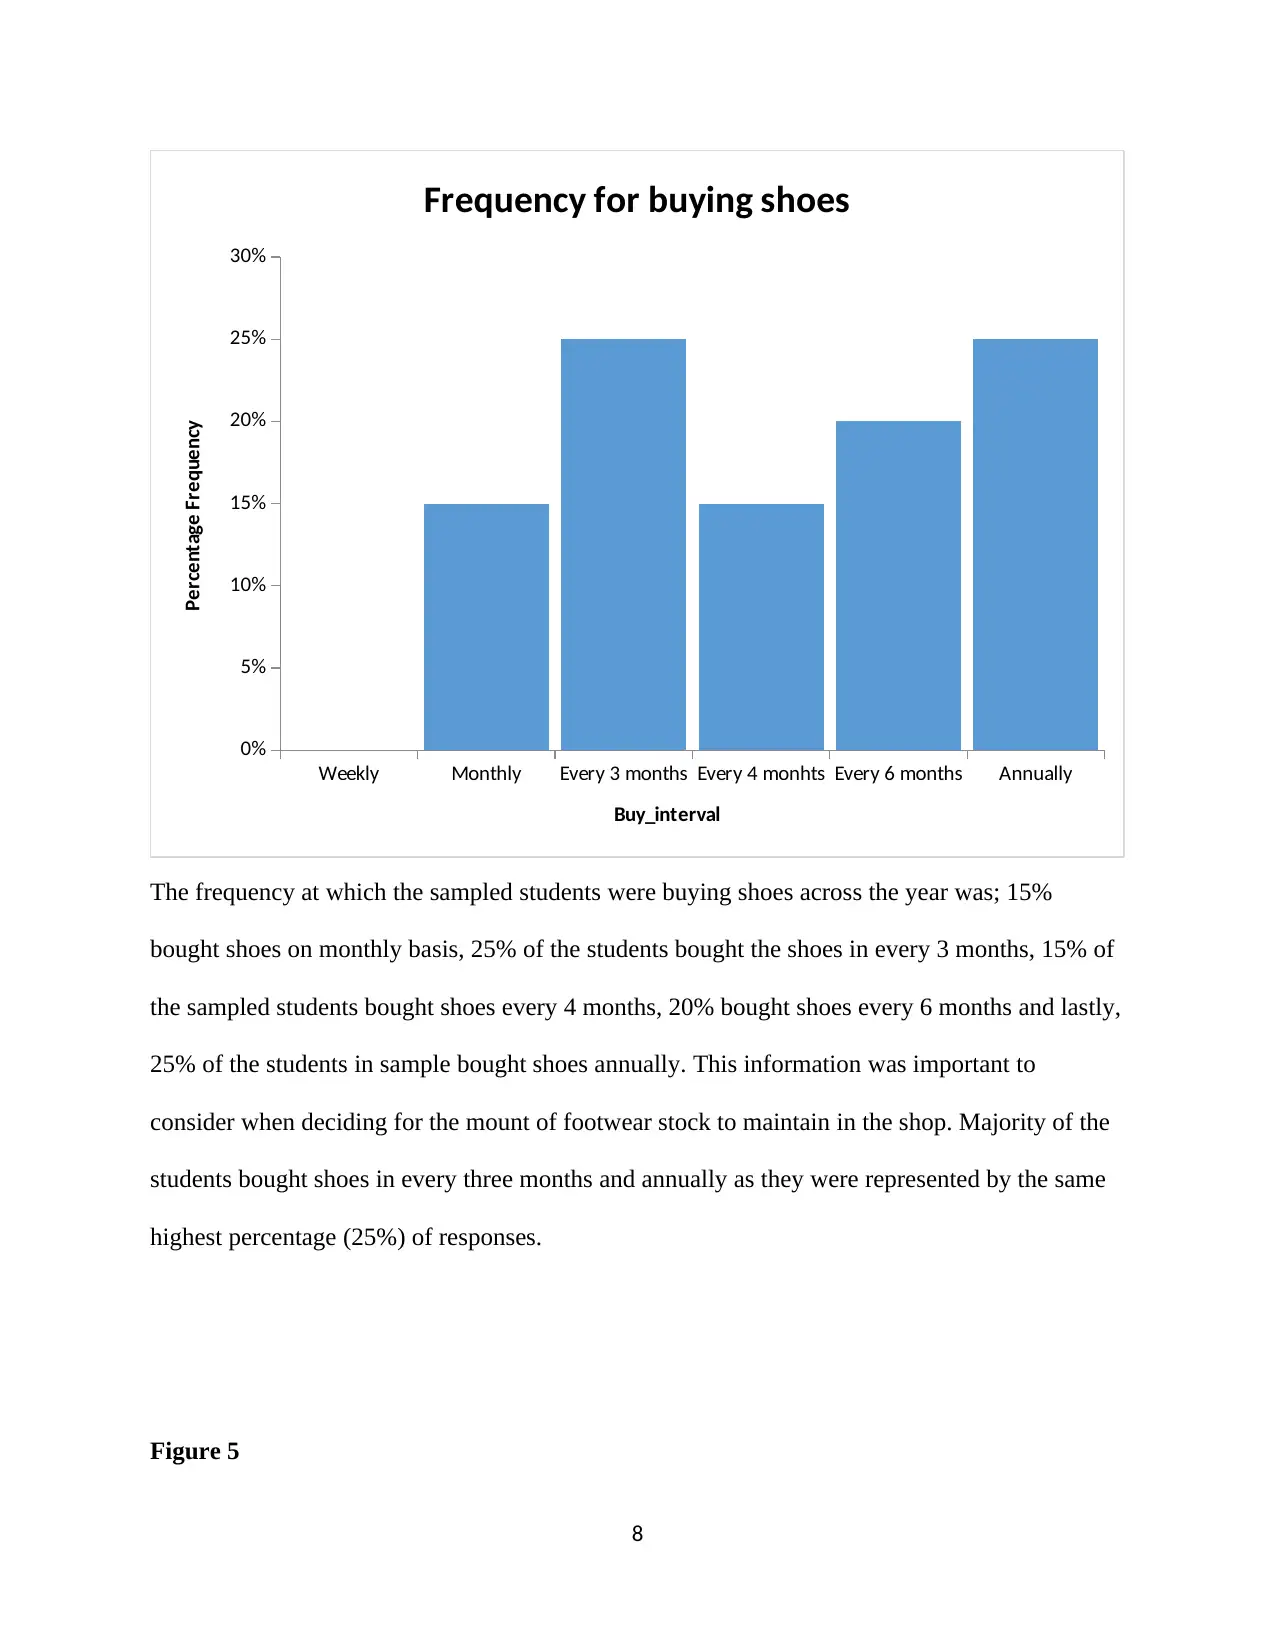
The frequency at which the sampled students were buying shoes across the year was; 15%
bought shoes on monthly basis, 25% of the students bought the shoes in every 3 months, 15% of
the sampled students bought shoes every 4 months, 20% bought shoes every 6 months and lastly,
25% of the students in sample bought shoes annually. This information was important to
consider when deciding for the mount of footwear stock to maintain in the shop. Majority of the
students bought shoes in every three months and annually as they were represented by the same
highest percentage (25%) of responses.
Figure 5
8
0%
5%
10%
15%
20%
25%
30%
Frequency for buying shoes
Buy_interval
Percentage Frequency
The frequency at which the sampled students were buying shoes across the year was; 15%
bought shoes on monthly basis, 25% of the students bought the shoes in every 3 months, 15% of
the sampled students bought shoes every 4 months, 20% bought shoes every 6 months and lastly,
25% of the students in sample bought shoes annually. This information was important to
consider when deciding for the mount of footwear stock to maintain in the shop. Majority of the
students bought shoes in every three months and annually as they were represented by the same
highest percentage (25%) of responses.
Figure 5
8
With Shoelaces without shoelaces
0%
10%
20%
30%
40%
50%
60%
70%
Preferred shoes
Shoelaces
Percentage Frequency
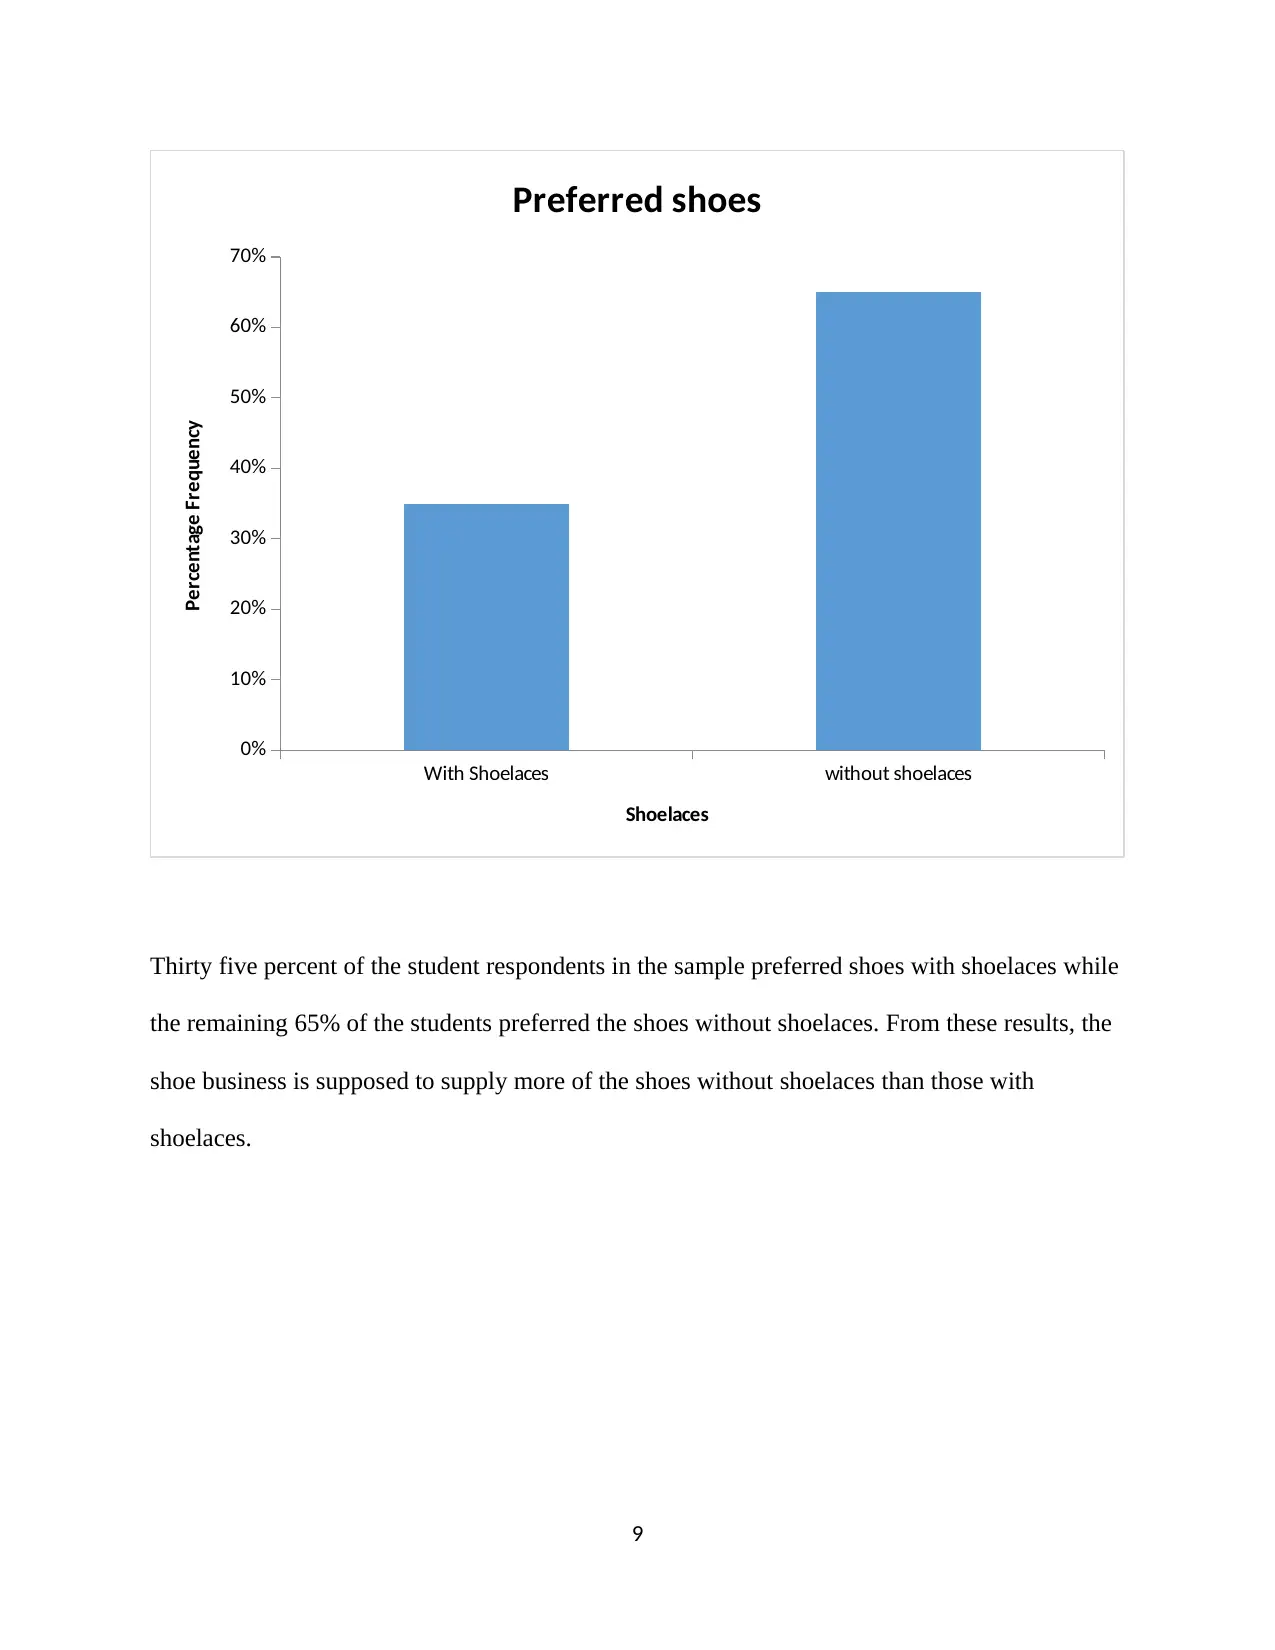
Thirty five percent of the student respondents in the sample preferred shoes with shoelaces while
the remaining 65% of the students preferred the shoes without shoelaces. From these results, the
shoe business is supposed to supply more of the shoes without shoelaces than those with
shoelaces.
9
0%
10%
20%
30%
40%
50%
60%
70%
Preferred shoes
Shoelaces
Percentage Frequency
Thirty five percent of the student respondents in the sample preferred shoes with shoelaces while
the remaining 65% of the students preferred the shoes without shoelaces. From these results, the
shoe business is supposed to supply more of the shoes without shoelaces than those with
shoelaces.
9
⊘ This is a preview!⊘
Do you want full access?
Subscribe today to unlock all pages.
Trusted by 1+ million students worldwide
1 out of 16
Related Documents


Your All-in-One AI-Powered Toolkit for Academic Success.
+13062052269
info@desklib.com
Available 24*7 on WhatsApp / Email
![[object Object]](/_next/static/media/star-bottom.7253800d.svg)
Unlock your academic potential
Copyright © 2020–2026 A2Z Services. All Rights Reserved. Developed and managed by ZUCOL.