Ford Motor Company Performance Analysis: Income Statement Review

Verified

Added on  2022/08/19

|9
|806
|11
Report
AI Summary
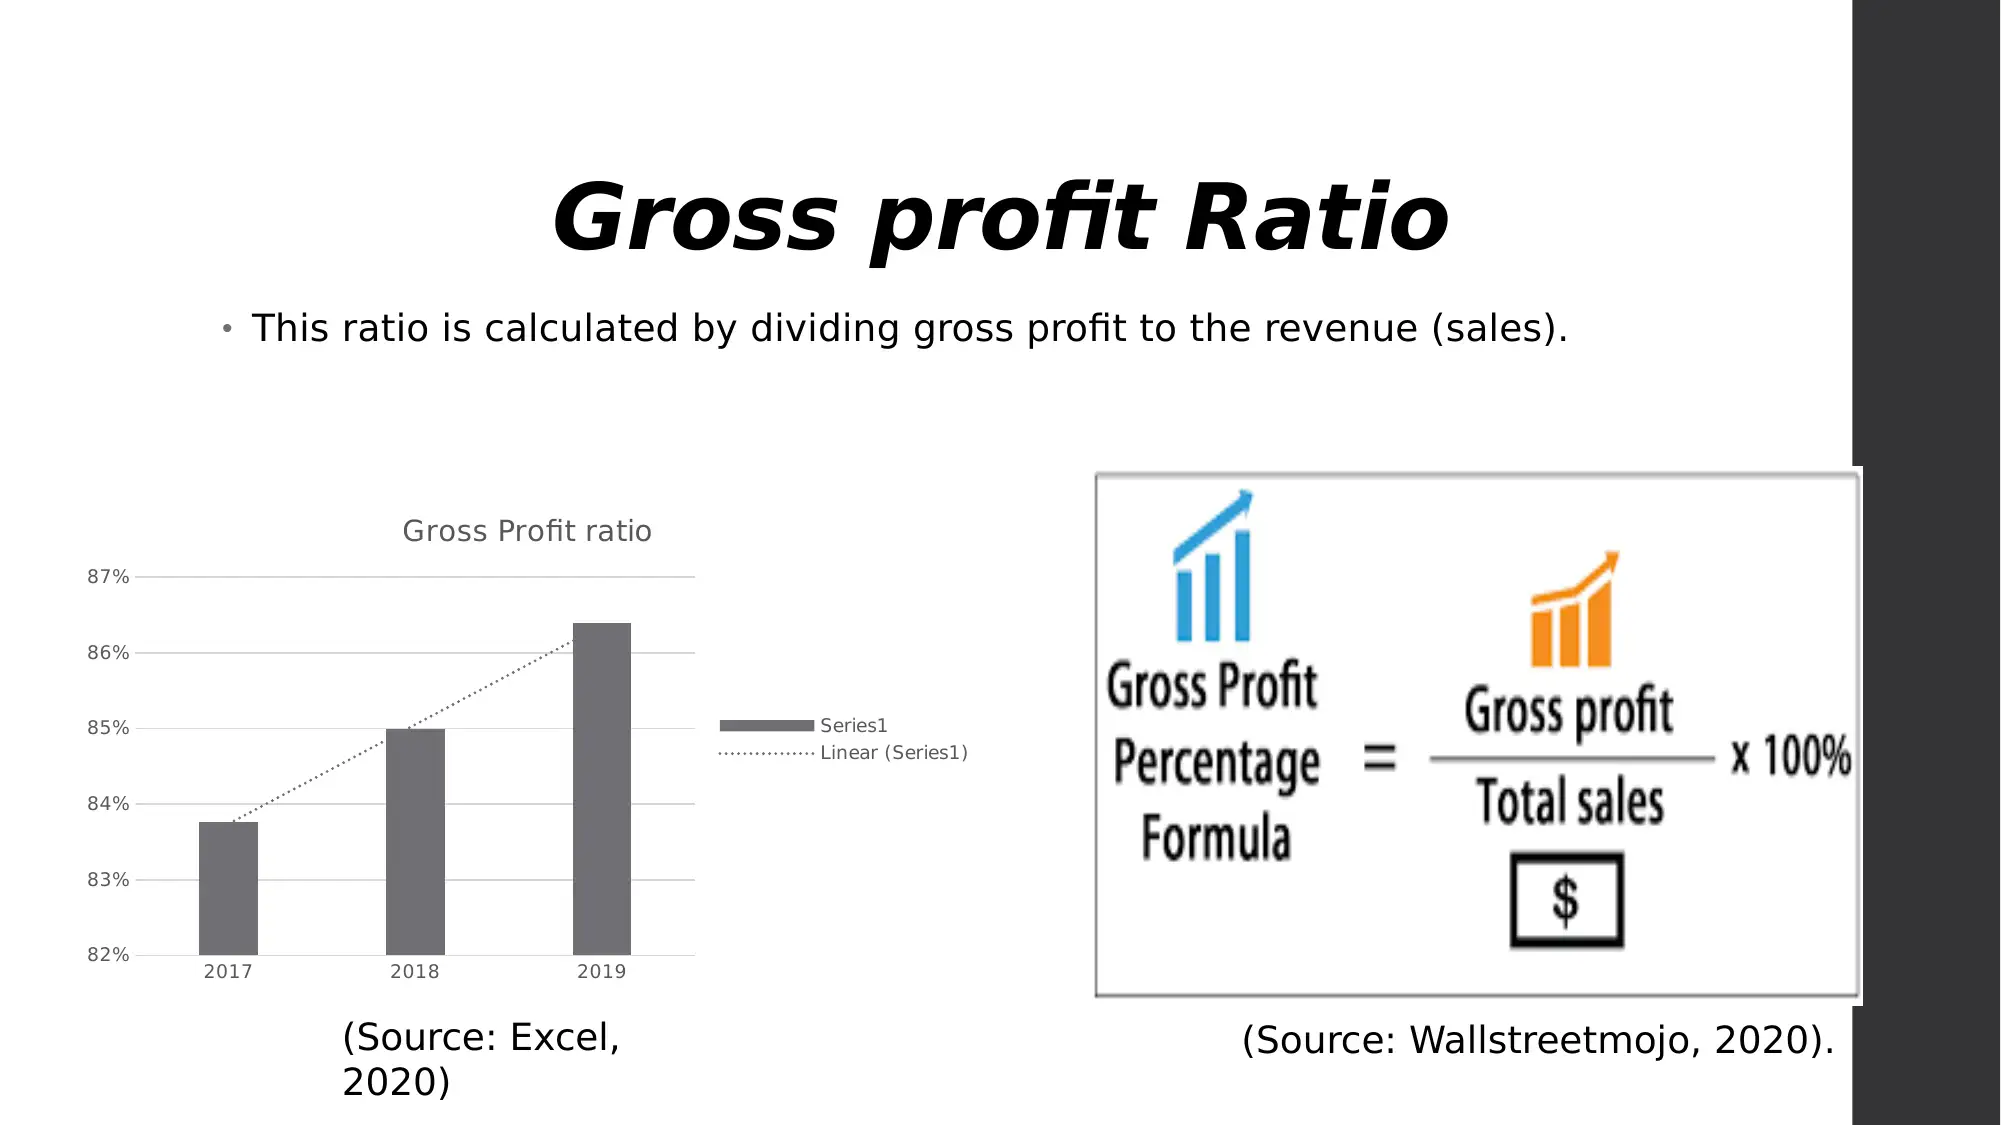
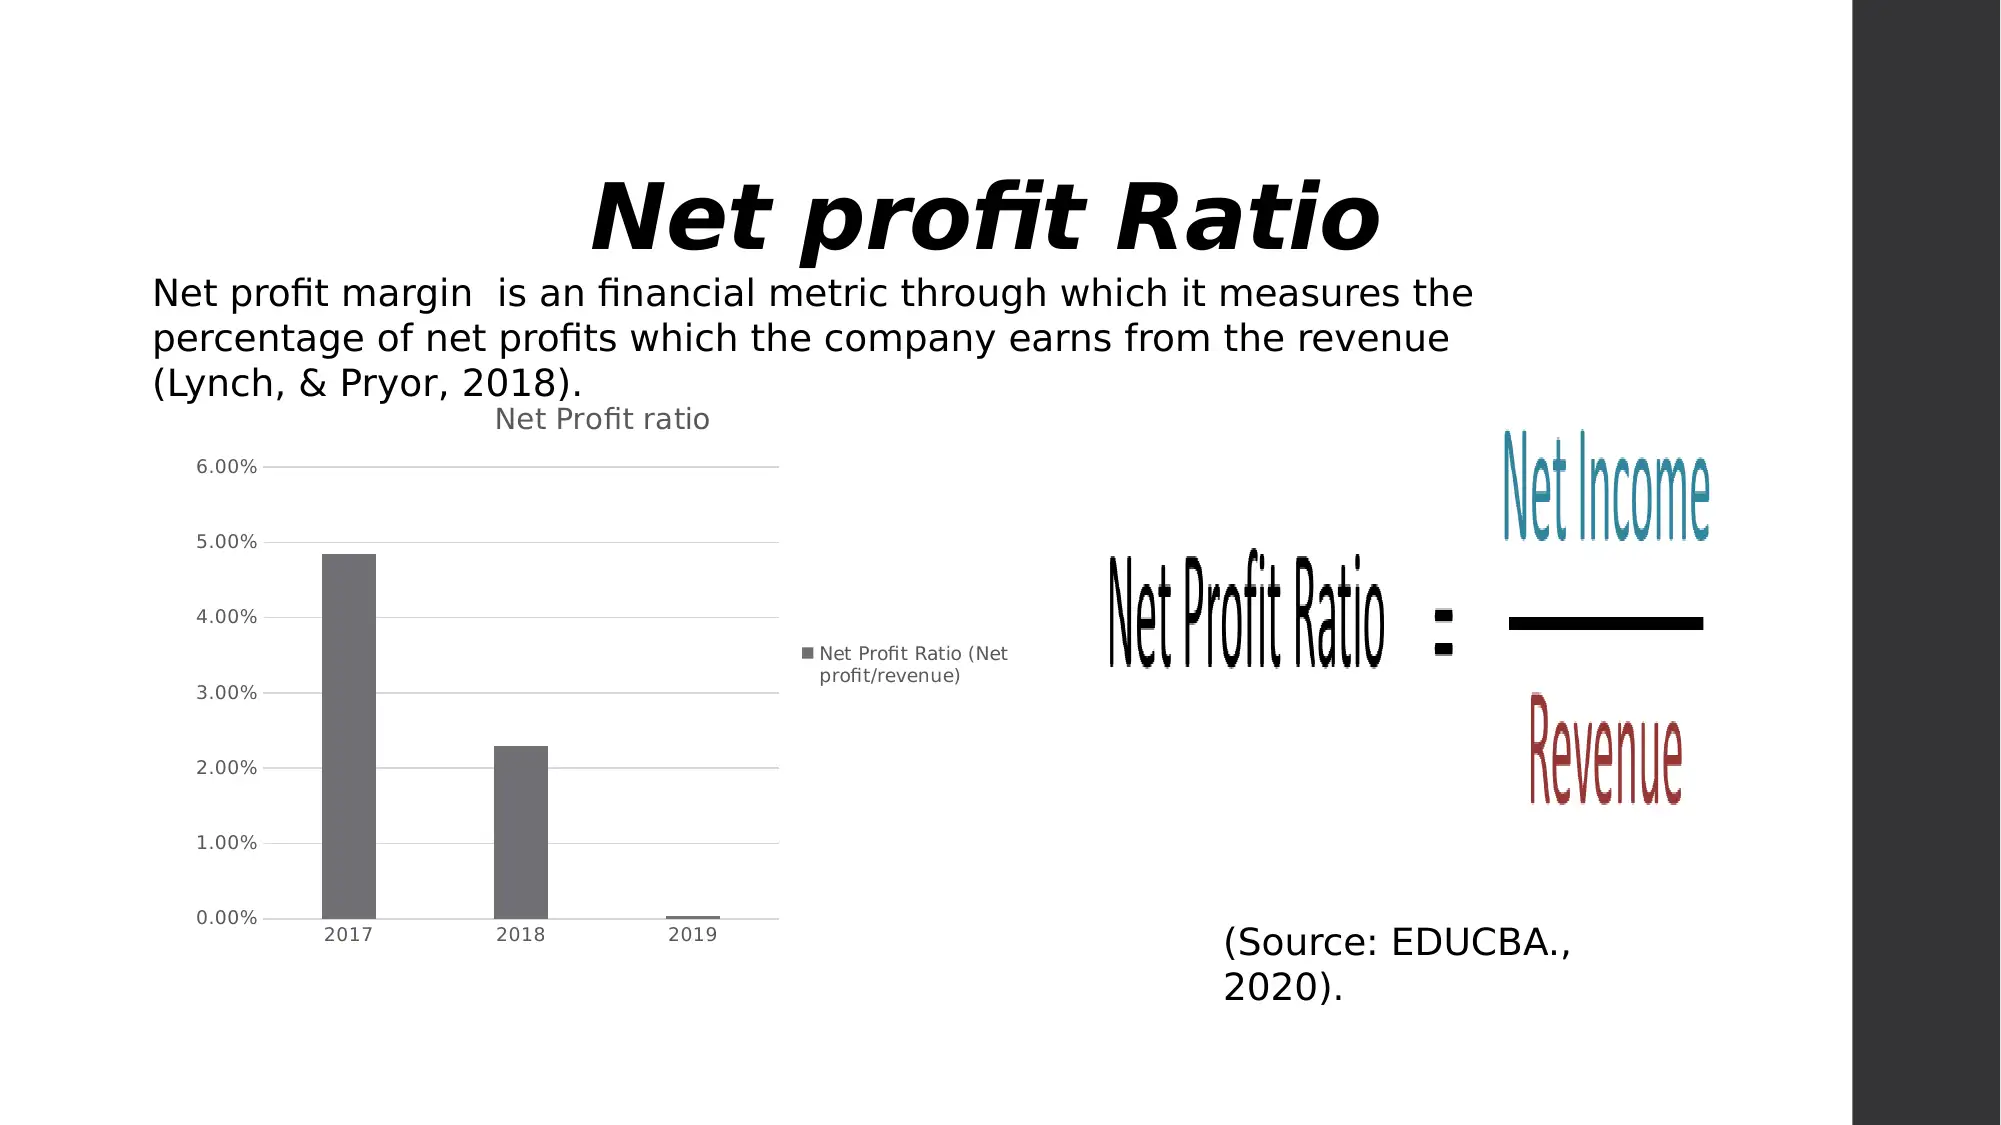
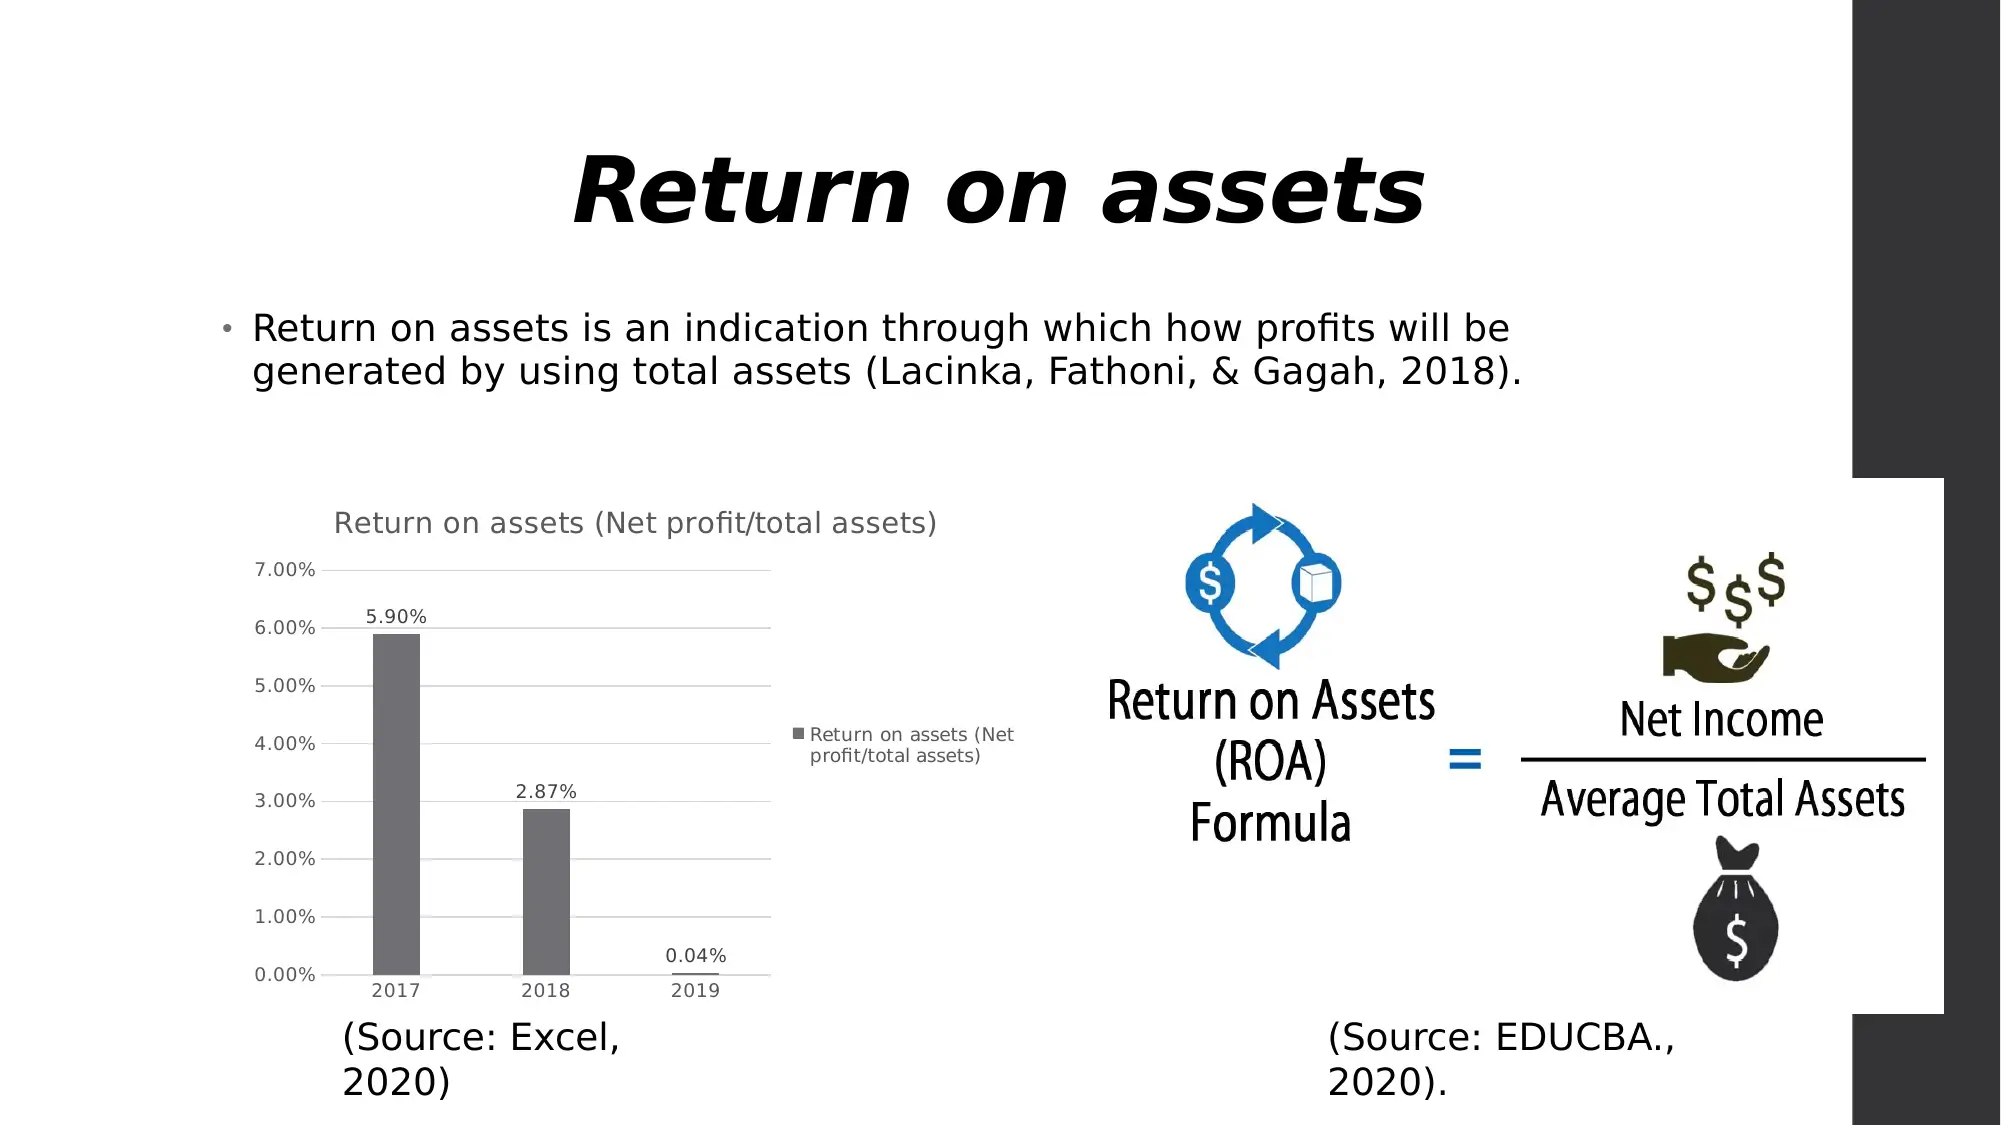
This report analyzes the financial performance of Ford Motor Company over a three-year period, focusing on profitability ratios such as gross profit, net profit, and return on assets. The analysis reveals trends in revenue, expenses, and overall financial health. The company's gross profit ratio shows inefficiency. The report examines the fluctuations in revenue, with an initial increase followed by a decrease, and the corresponding impact on net profit. It also discusses the significance of changes in various expenses, including interest and operating expenses. The study calculates and interprets the gross profit ratio, net profit ratio, and return on assets to assess the company's performance and provide insights into its financial stability and growth. The report uses data from the company's 10-K form and other financial resources to support its findings.
Document Page
Name of student-
Roll number-
tabler-icon-diamond-filled.svg

Paraphrase This Document

Need a fresh take? Get an instant paraphrase of this document with our AI Paraphraser
Document Page
Comparison of company`s performance from
prior year
On the basis of profitability ratios such as Gross profit ratio, net profit
ratio and return on assets are used to examine the profitability and
performance of the company (Hoffer, & Pincin, 2016).
The company has unsuitable increasing gross profit ratio, which
clearly shows the company has not been working efficiently because
with the increase in production, revenue increases and gross profit
attains an improvement stage (Ford Motor Company-10K form,
2017).
The reports state that in 2018, the company`s revenue has fallen
while comparing it to the 2017 data. However, the net profit too
shows the same calculation where profit has reduced in 2018.
Document Page
Changes or growth in the
market
Decreasing leasing costs show zero road tax and low running costs, which may tend the
customers to make a smart move and switch for another brand.
Labour and other overhead costs have been constant for all the models. This shows
small cars are less profitable and trucks are more profitable.
Document Page
Revenue trends
2017 2018 2019
153000000
154000000
155000000
156000000
157000000
158000000
159000000
160000000
161000000
156776000
160338000
155900000
Revenue
The revenue trends for the company is
not stable (Su, 2019). As in 2017, the
company generates 15676000, in 2018 it
is 160338000 and at last it decreased
to155900000.
While evaluating the gap between the
revenue of two years, from 2017 to
2018, the revenue has increased by 2
percent. Moreover, the revenue has
decreased by 2 percent from 2018 to
2019 (Macrotrends, 2020).
tabler-icon-diamond-filled.svg

Paraphrase This Document

Need a fresh take? Get an instant paraphrase of this document with our AI Paraphraser
Document Page
Company expenses
Significance of increase and decrease in every expense-
2017 2018 2019 %
differenc
e
%
difference
Interest
expense 11,33,000 12,28,000 10,49,000 8% -17%
Operating
expense 2,06,31,000 2,08,66,000 2,06,33,000 1% -1%
Although, there are several expenses, which have impact on income
statement and the performance of the company.
Interest expense is incurred when the company engages in incurring
long term loans. From 2017, the interest expense has increased by 8
percent in 2018 and furthermore, the difference has decreased by 17
percent in 2019.
Operating expense is an direct expense incurred, which summarise that
operating expense shows almost same pace of growth and check
whether the company is stable or not.
Document Page
Gross profit Ratio
This ratio is calculated by dividing gross profit to the revenue (sales).
2017 2018 2019
82%
83%
84%
85%
86%
87%
Gross Profit ratio
Series1
Linear (Series1)
(Source: Excel,
2020)
(Source: Wallstreetmojo, 2020).
Document Page
Net profit Ratio
2017 2018 2019
0.00%
1.00%
2.00%
3.00%
4.00%
5.00%
6.00%
Net Profit ratio
Net Profit Ratio (Net
profit/revenue)
Net profit margin is an financial metric through which it measures the
percentage of net profits which the company earns from the revenue
(Lynch, & Pryor, 2018).
(Source: EDUCBA.,
2020).
tabler-icon-diamond-filled.svg

Paraphrase This Document

Need a fresh take? Get an instant paraphrase of this document with our AI Paraphraser
Document Page
Return on assets
Return on assets is an indication through which how profits will be
generated by using total assets (Lacinka, Fathoni, & Gagah, 2018).
2017 2018 2019
0.00%
1.00%
2.00%
3.00%
4.00%
5.00%
6.00%
7.00%
5.90%
2.87%
0.04%
Return on assets (Net profit/total assets)
Return on assets (Net
profit/total assets)
(Source: Excel,
2020)
(Source: EDUCBA.,
2020).
Document Page
References
Shadburne
, S., (2019). Ford reports revenue, profit losses in 2019. Retrieved from: https://www.bizjournals.com/louisville/news/202
0/02/05/ford-reports-revenue-profit-losses-in-2019.html
Hoffer, A., & Pincin, J. A. (2016). The effects of revenue changes on NCAA athletic departments’ expenditures. Journal of
Sport and Social Issues, 40(1), 82-102.
Su, M. (2019). Local Governments’ Responses to Revenue Changes: The Effects of Unreserved General Fund
Balances. International Journal of Public Administration, 1-13.
Lynch, N. C., & Pryor, C. R. (2018). The Impact of the New Revenue Recognition Guidance on Cloud Computing
Arrangements. The CPA Journal, 88(6), 38-45.
Lacinka, A., Fathoni, A., & Gagah, E. (2018). ANALYZE EFFECT OF DEBT TO EQUITY RATIO, NET PROFIT MARGIN, AND
EARNING PER SHARE TO THE COMPANY'S STOCK PRICES LQ45 LISTED ON THE INDONESIA STOCK EXCHANGE YEAR
2012-2015. Journal of Management, 4(4).
Öztürk, H., & Karabulut, T. A. (2018). The relationship between earnings-to-price, current ratio, profit margin and return:
an empirical analysis on Istanbul stock exchange. Accounting and Finance Research, 7(1), 109-115.
Wallstreetmojo, (2020). Profit Margin Formula. Retrieved from: https://www.wallstreetmojo.com/profit-margin-formula/
EDUCBA., (2020). Return on Total Assets Formula. Retrieved from:
https://www.educba.com/return-on-total-assets-formula/
Macrotrends, (2020). Ford Motor Revenue 2006-2019 | F. Retrieved from:
https://www.macrotrends.net/stocks/charts/F/ford-motor/revenue
Ford Motor Company, (2017). 10-K form. Retrieved from: https
://www.sec.gov/Archives/edgar/data/37996/000003799618000015/f1231201710-k.htm
chevron_up_icon
1 out of 9
circle_padding
hide_on_mobile
zoom_out_icon
[object Object]