Financial Statement Analysis of Ford Motor Credit Company: Report

Verified

Added on  2022/10/19

|6
|1497
|112
Report
AI Summary
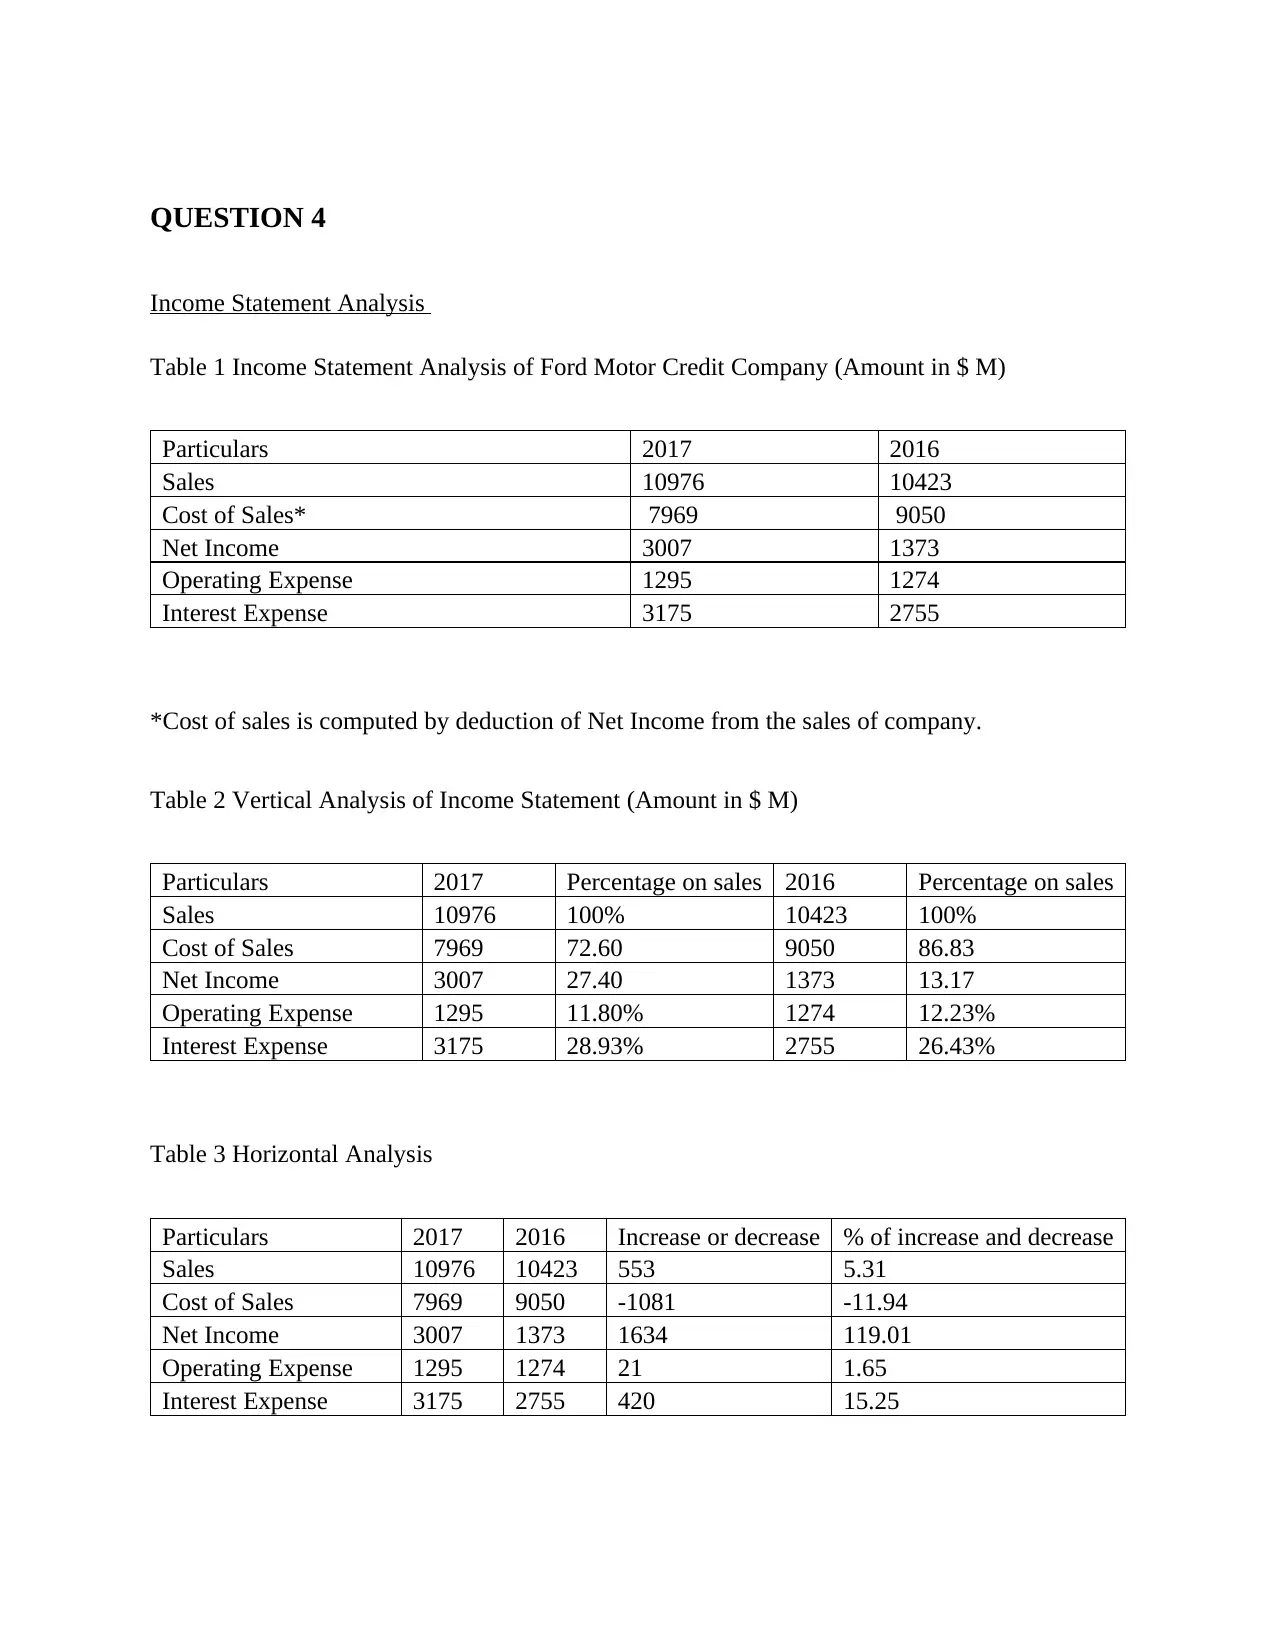
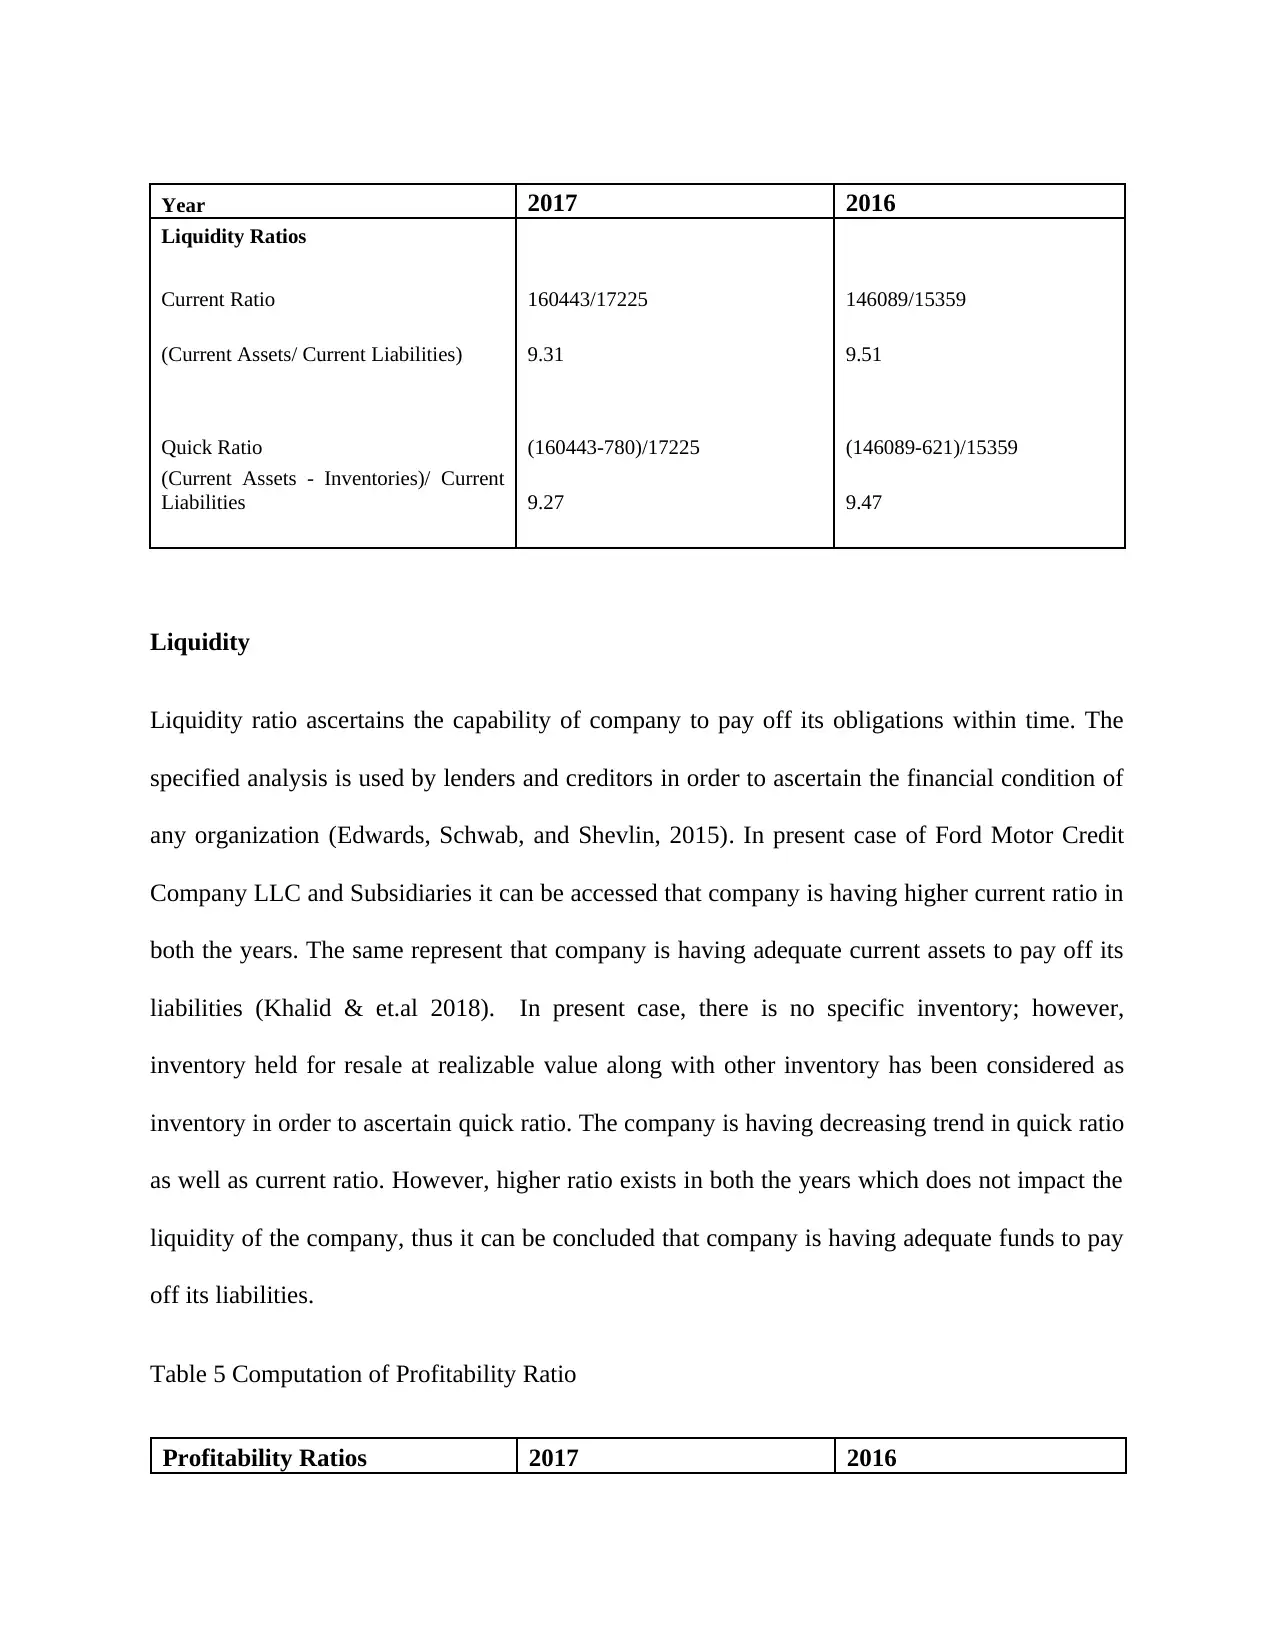
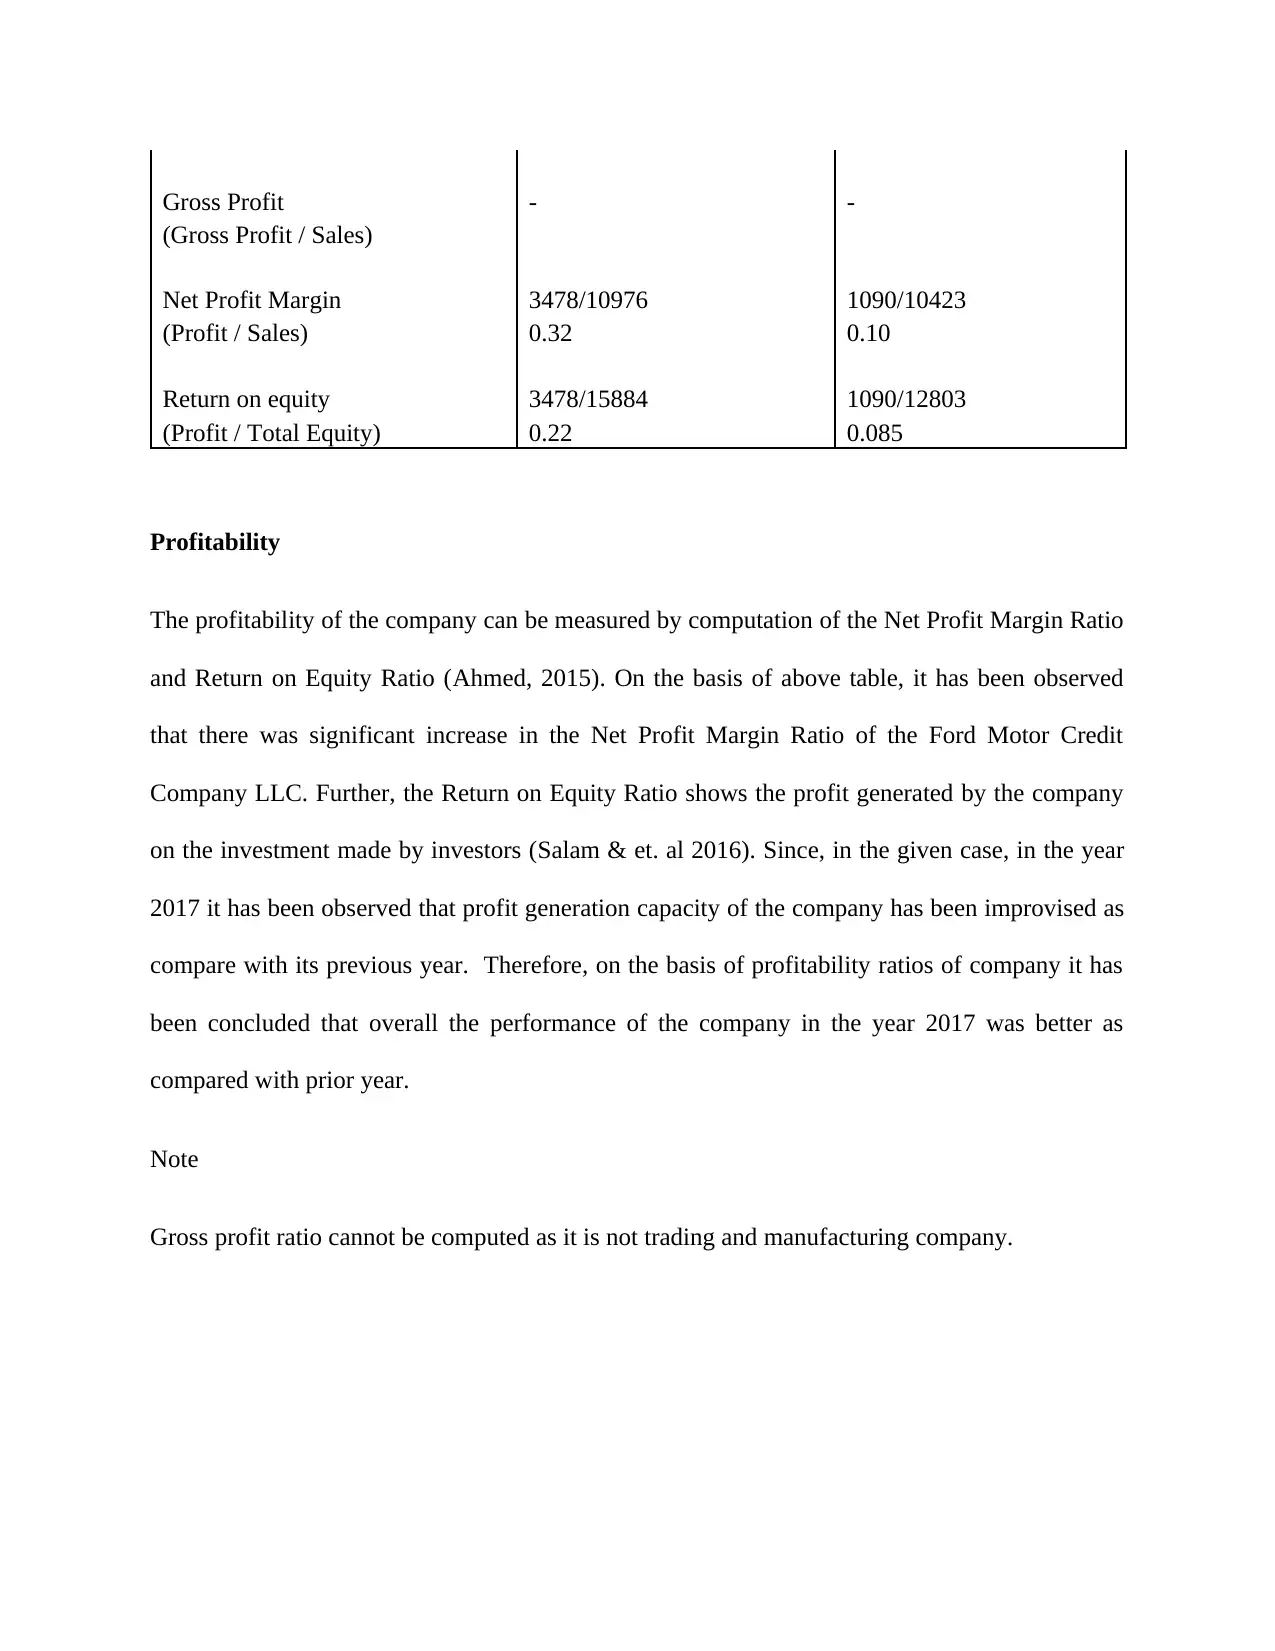
This report presents a detailed financial analysis of Ford Motor Credit Company, focusing on its performance in 2017. The analysis includes an examination of the income statement, utilizing both horizontal and vertical analysis techniques to assess trends and performance relative to sales. Key metrics such as cost of sales, net income, operating expenses, and interest expenses are analyzed to understand the company's profitability and cost management. Furthermore, the report delves into ratio analysis, evaluating liquidity through current and quick ratios and assessing profitability using net profit margin and return on equity. The findings indicate improvements in profitability and financial health in 2017 compared to the previous year, highlighting the company's effective strategies in revenue generation and cost control. The report also discusses the company's leverage position and its implications on financial performance. The analysis is supported by data from the company's financial statements and references relevant academic literature to provide a comprehensive understanding of Ford Motor Credit Company's financial standing.
Document Page
QUESTION 4
Income Statement Analysis
Table 1 Income Statement Analysis of Ford Motor Credit Company (Amount in $ M)
Particulars 2017 2016
Sales 10976 10423
Cost of Sales* 7969 9050
Net Income 3007 1373
Operating Expense 1295 1274
Interest Expense 3175 2755
*Cost of sales is computed by deduction of Net Income from the sales of company.
Table 2 Vertical Analysis of Income Statement (Amount in $ M)
Particulars 2017 Percentage on sales 2016 Percentage on sales
Sales 10976 100% 10423 100%
Cost of Sales 7969 72.60 9050 86.83
Net Income 3007 27.40 1373 13.17
Operating Expense 1295 11.80% 1274 12.23%
Interest Expense 3175 28.93% 2755 26.43%
Table 3 Horizontal Analysis
Particulars 2017 2016 Increase or decrease % of increase and decrease
Sales 10976 10423 553 5.31
Cost of Sales 7969 9050 -1081 -11.94
Net Income 3007 1373 1634 119.01
Operating Expense 1295 1274 21 1.65
Interest Expense 3175 2755 420 15.25
tabler-icon-diamond-filled.svg

Paraphrase This Document

Need a fresh take? Get an instant paraphrase of this document with our AI Paraphraser
Document Page
Income statement analysis of the company assists in understanding of the cost outlay as well as
profitability over a particular period of time. It includes comparison of the different item stated in
the financial statement (Williams, and Dobelman, 2017). There are two methods such as
horizontal method and vertical method by which Income Statement Analysis can be performed.
In the given case, Income Statement Analysis of Ford Motor Credit Company is performed by
application of both methods. In the horizontal method, financial information of company can be
evaluated with the one or more prior periods. On the basis of this, it has been observed that there
is increment in the revenue of company in the year 2017 by the 5.31% as compared with its
previous year. Further, the net income of company significantly accelerated in the year 2017.
The percentage of increment in the net income was 119.01%. It shows the excellent performance
by the company. The reason behind the increment in the net income was the increment in the
revenue of company. Further, it has been evaluated that, cost of sales of the company has been
reduced in the year 2017 as compared with the previous year. There is possibility that company
has implemented several plans and policies for reduction of cost of sales. Further, by raising the
funds through debt source, company may reduce its financing cost, which ultimately gives the
benefits to the company. Further, it has been evaluated that, although the operating expenses of
company more than in the year 2017 as compared with the year 2016, but the percentage of
increase in expenses was less as compared with turnover. Further, the expenses on interest of the
company were also enhanced in the year 2017 as compared with its prior year. This shows about
the leverage position of company. In other words it can be said that the company has more debt
portion in the capital structure of company as compared with earlier year. Overall, on the basis
of horizontal analysis of Income Statement, it has been drawn that in the year 2017 the
performance of the company has been improvised as compare with its previous year.
Document Page
On the other hand, Vertical Analysis of Income Statement assists in evaluating the performance
of company by making the comparison of items of the same financial period. In this method,
each expense is compared with the total sales of that accounting period (Lang, and Stice-
Lawrence, 2015). It has been observed that Net Income, Operating expenses and Interest
Expenses of the company in the year 2017 was 27.40%, 11.80%, and 28.93% respectively of
total sales of company. It has been analyzed that percentage of net income has been improvised
in the 2017 as compared with earlier year. Further, the percentage of operating expenses on total
sales has been reduced, which is the good indication for company.
In case of Ford Motor Credit Company, on the basis of vertical analysis, it has been observed
that in the year 2017 the percentage of cost of sales and Net Income on the basis of total sales
was 72.60% and 27.40% respectively. It has been analyzed that percentage of net income has
been improvised in the 2017 as compared with the earlier year. Further, the percentage of cost of
sales on total sales has been reduced, which is the good indication for company.
QUESTION 6
Ratio Analysis
Ratio analysis is effective tool for evaluating the financial performance of the company. In the
given case, the liquidity of the company has been evaluated by computation of current ratio and
quick ratio. Further, the profitability of the company has been evaluated by computation of Net
Income margin ratio and Return on Equity Ratio.
Table 4 Computation of Liquidity Ratio
(Amount in $)
Document Page
Year 2017 2016
Liquidity Ratios
Current Ratio 160443/17225 146089/15359
(Current Assets/ Current Liabilities) 9.31 9.51
Quick Ratio (160443-780)/17225 (146089-621)/15359
(Current Assets - Inventories)/ Current
Liabilities 9.27 9.47
Liquidity
Liquidity ratio ascertains the capability of company to pay off its obligations within time. The
specified analysis is used by lenders and creditors in order to ascertain the financial condition of
any organization (Edwards, Schwab, and Shevlin, 2015). In present case of Ford Motor Credit
Company LLC and Subsidiaries it can be accessed that company is having higher current ratio in
both the years. The same represent that company is having adequate current assets to pay off its
liabilities (Khalid & et.al 2018). In present case, there is no specific inventory; however,
inventory held for resale at realizable value along with other inventory has been considered as
inventory in order to ascertain quick ratio. The company is having decreasing trend in quick ratio
as well as current ratio. However, higher ratio exists in both the years which does not impact the
liquidity of the company, thus it can be concluded that company is having adequate funds to pay
off its liabilities.
Table 5 Computation of Profitability Ratio
Profitability Ratios 2017 2016
tabler-icon-diamond-filled.svg

Paraphrase This Document

Need a fresh take? Get an instant paraphrase of this document with our AI Paraphraser
Document Page
Gross Profit - -
(Gross Profit / Sales)
Net Profit Margin 3478/10976 1090/10423
(Profit / Sales) 0.32 0.10
Return on equity 3478/15884 1090/12803
(Profit / Total Equity) 0.22 0.085
Profitability
The profitability of the company can be measured by computation of the Net Profit Margin Ratio
and Return on Equity Ratio (Ahmed, 2015). On the basis of above table, it has been observed
that there was significant increase in the Net Profit Margin Ratio of the Ford Motor Credit
Company LLC. Further, the Return on Equity Ratio shows the profit generated by the company
on the investment made by investors (Salam & et. al 2016). Since, in the given case, in the year
2017 it has been observed that profit generation capacity of the company has been improvised as
compare with its previous year. Therefore, on the basis of profitability ratios of company it has
been concluded that overall the performance of the company in the year 2017 was better as
compared with prior year.
Note
Gross profit ratio cannot be computed as it is not trading and manufacturing company.
Document Page
REFERENCES
Ahmed, I.E., 2015.Liquidity, profitability and the dividends payout policy. World Review of
Business Research, 5(2), pp.73-85.
Edwards, A., Schwab, C. and Shevlin, T., 2015. Financial constraints and cash tax savings. The
Accounting Review, 91(3), pp.859-881.
Khalid, R., Saif, T., Gondal, A.R. and Sarfraz, H., 2018.Working Capital Management and
Profitability. Mediterranean Journal of Basic and Applied Sciences (MJBAS), 2(2), pp.117-125.
Lang, M. and Stice-Lawrence, L., 2015. Textual analysis and international financial reporting:
Large sample evidence. Journal of Accounting and Economics, 60(2-3), pp.110-135.
Salam, Z.A., Quoquab, F., Jamil, R., Rizal, A.M., Mahadi, N. and Hussin, N., 2016. Does
Liquidity Affects Profitability?. Advanced Science Letters, 22(12), pp.4506-4508.
Williams, E.E. and Dobelman, J.A., 2017. Financial statement analysis. World Scientific Book
Chapters, pp.109-169.
chevron_up_icon
1 out of 6
circle_padding
hide_on_mobile
zoom_out_icon
[object Object]