Comparative Financial Performance of Ford and General Motors
VerifiedAdded on 2020/04/21
|32
|9442
|67
AI Summary
The task requires an analysis of the financial performance of two major automotive companies: Ford and General Motors (GM). The data spans the years 2015-2017 and includes a variety of key financial metrics such as net margin, return on equity, liquidity ratios like current ratio and quick ratio, efficiency indicators including asset turnover and receivables collection period, along with solvency measures like debt to equity ratio. For Ford, the analysis reveals fluctuations in profitability with net margins ranging from 3.46% to 6.67%, while GM shows a slightly higher range of 2.53% to 6.36%. Return on equity for Ford varies between 10.56% and 20.29%, compared to GM's 10.96% to 24.02%. Liquidity assessment through current ratios highlights Ford’s better short-term financial health, averaging around 1.32 to 1.52 against GM’s lower range of 1.09 to 1.31. The quick ratio supports this with similar trends. Asset turnover shows GM's higher operational efficiency, ranging from 0.78 to 0.93, compared to Ford's 0.51 to 0.61. Solvency is another key focus area, where both companies maintain a relatively high debt burden, but Ford displays slightly more conservative leverage with debt to equity ratios between 2.53 and 4.34, whereas GM ranges from 2.85 to 3.93. The receivables collection period indicates that GM manages its receivables more efficiently than Ford across the given years.
Running Head: ACCT3303
1
Project Report: financial analysis
1
Project Report: financial analysis
Paraphrase This Document
Need a fresh take? Get an instant paraphrase of this document with our AI Paraphraser
ACCT3303
2
Executive Summary:
Introduction:
This report presents the user about the comparison of two companies which are ford
motors and General Motors on the basis of various financial data and the figures. For this
report, various financial tools have been used.
Ford motors:
Ford Motors Company is an American company which is operating its business into
international market. Headquarter of the company is in Dearborn, Michigan. This company
has been founded in June, 1903. This company sells commercial and automobile vehicles
under the name of Ford brand and the luxurious cars have been manufactured in Lincoln
brand. Currently, around 8% of the market share has been owned by the ford Motors of the
automobile industry (Home, 2017).
General Motors:
General Motors Company is an American company which is operating its business
into international market. Headquarter of the company is in Detroit, Michigan. This company
has been founded in September, 1908. This company manufactures, sells, designs and
distributes the vehicle parts and the financial services. Currently, this company has its plant
into the 35 countries (home, 2017). This company was the largest automobile manufacturing
company in the industry from 1931 to 2007.
Analytics:
Financial analysis is a study which assists the chief financial officer, financial
manager and the financial analyst to manage and administer the various levels and the
performance of the company. In this analytics section, horizontal analysis, vertical analysis
and ratio analysis study has been done of both the companies (Larcker, Richardson & Tuna,
2007). The comments and the calculations are as follows:
Vertical analysis:
Vertical analysis is the financial method which is used by the company to analyze the
performance of the company on a single basic to analyze and administer the performance of
ACCT3303
3
the company on the basis of its sales and the total assets of the company. The comments and
the calculations of vertical analysis over both the companies are as follows:
Ford Motors:
The calculations of vertical analysis have been performed over the ford motors to
analyze and administer the performance and position of each activity on the basis of sales and
total assets of the company. This evaluation has been done over the comapny to analyze that
how this company is managing and administering the entire financial figures. The
performance and the position of the company have been analyzed in the income statement of
the company on the basis of their sales (Juan García-Teruel & Martinez-Solano, 2007). Such
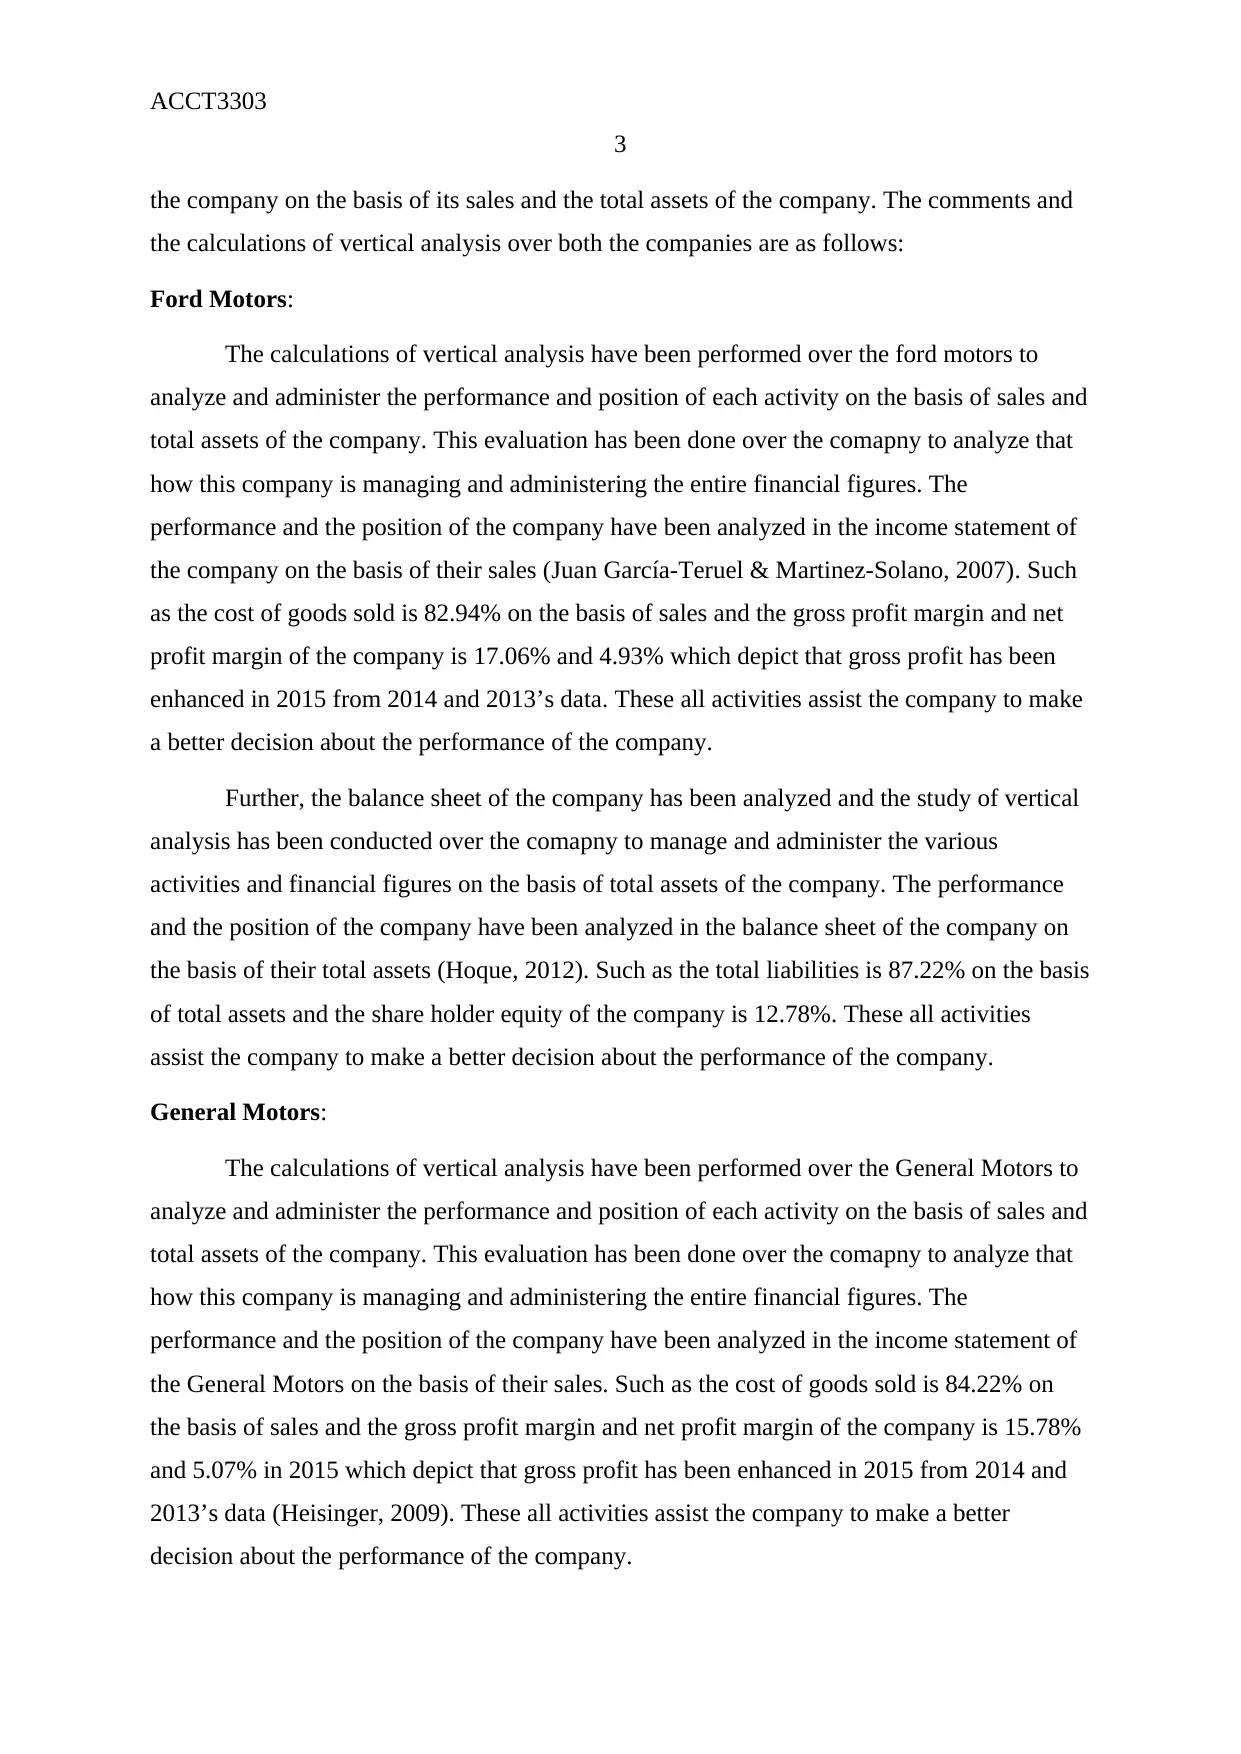
as the cost of goods sold is 82.94% on the basis of sales and the gross profit margin and net
profit margin of the company is 17.06% and 4.93% which depict that gross profit has been
enhanced in 2015 from 2014 and 2013’s data. These all activities assist the company to make
a better decision about the performance of the company.
Further, the balance sheet of the company has been analyzed and the study of vertical
analysis has been conducted over the comapny to manage and administer the various
activities and financial figures on the basis of total assets of the company. The performance
and the position of the company have been analyzed in the balance sheet of the company on
the basis of their total assets (Hoque, 2012). Such as the total liabilities is 87.22% on the basis
of total assets and the share holder equity of the company is 12.78%. These all activities
assist the company to make a better decision about the performance of the company.
General Motors:
The calculations of vertical analysis have been performed over the General Motors to
analyze and administer the performance and position of each activity on the basis of sales and
total assets of the company. This evaluation has been done over the comapny to analyze that
how this company is managing and administering the entire financial figures. The
performance and the position of the company have been analyzed in the income statement of
the General Motors on the basis of their sales. Such as the cost of goods sold is 84.22% on
the basis of sales and the gross profit margin and net profit margin of the company is 15.78%
and 5.07% in 2015 which depict that gross profit has been enhanced in 2015 from 2014 and
2013’s data (Heisinger, 2009). These all activities assist the company to make a better
decision about the performance of the company.
3
the company on the basis of its sales and the total assets of the company. The comments and
the calculations of vertical analysis over both the companies are as follows:
Ford Motors:
The calculations of vertical analysis have been performed over the ford motors to
analyze and administer the performance and position of each activity on the basis of sales and
total assets of the company. This evaluation has been done over the comapny to analyze that
how this company is managing and administering the entire financial figures. The
performance and the position of the company have been analyzed in the income statement of
the company on the basis of their sales (Juan García-Teruel & Martinez-Solano, 2007). Such
as the cost of goods sold is 82.94% on the basis of sales and the gross profit margin and net
profit margin of the company is 17.06% and 4.93% which depict that gross profit has been
enhanced in 2015 from 2014 and 2013’s data. These all activities assist the company to make
a better decision about the performance of the company.
Further, the balance sheet of the company has been analyzed and the study of vertical
analysis has been conducted over the comapny to manage and administer the various
activities and financial figures on the basis of total assets of the company. The performance
and the position of the company have been analyzed in the balance sheet of the company on
the basis of their total assets (Hoque, 2012). Such as the total liabilities is 87.22% on the basis
of total assets and the share holder equity of the company is 12.78%. These all activities
assist the company to make a better decision about the performance of the company.
General Motors:
The calculations of vertical analysis have been performed over the General Motors to
analyze and administer the performance and position of each activity on the basis of sales and
total assets of the company. This evaluation has been done over the comapny to analyze that
how this company is managing and administering the entire financial figures. The
performance and the position of the company have been analyzed in the income statement of
the General Motors on the basis of their sales. Such as the cost of goods sold is 84.22% on
the basis of sales and the gross profit margin and net profit margin of the company is 15.78%
and 5.07% in 2015 which depict that gross profit has been enhanced in 2015 from 2014 and
2013’s data (Heisinger, 2009). These all activities assist the company to make a better
decision about the performance of the company.
⊘ This is a preview!⊘
Do you want full access?
Subscribe today to unlock all pages.
Trusted by 1+ million students worldwide
ACCT3303
4
Further, the balance sheet of the company has been analyzed and the study of vertical
analysis has been conducted over the comapny to manage and administer the various
activities and financial figures on the basis of total assets of the company. The performance
and the position of the company have been analyzed in the balance sheet of the company on
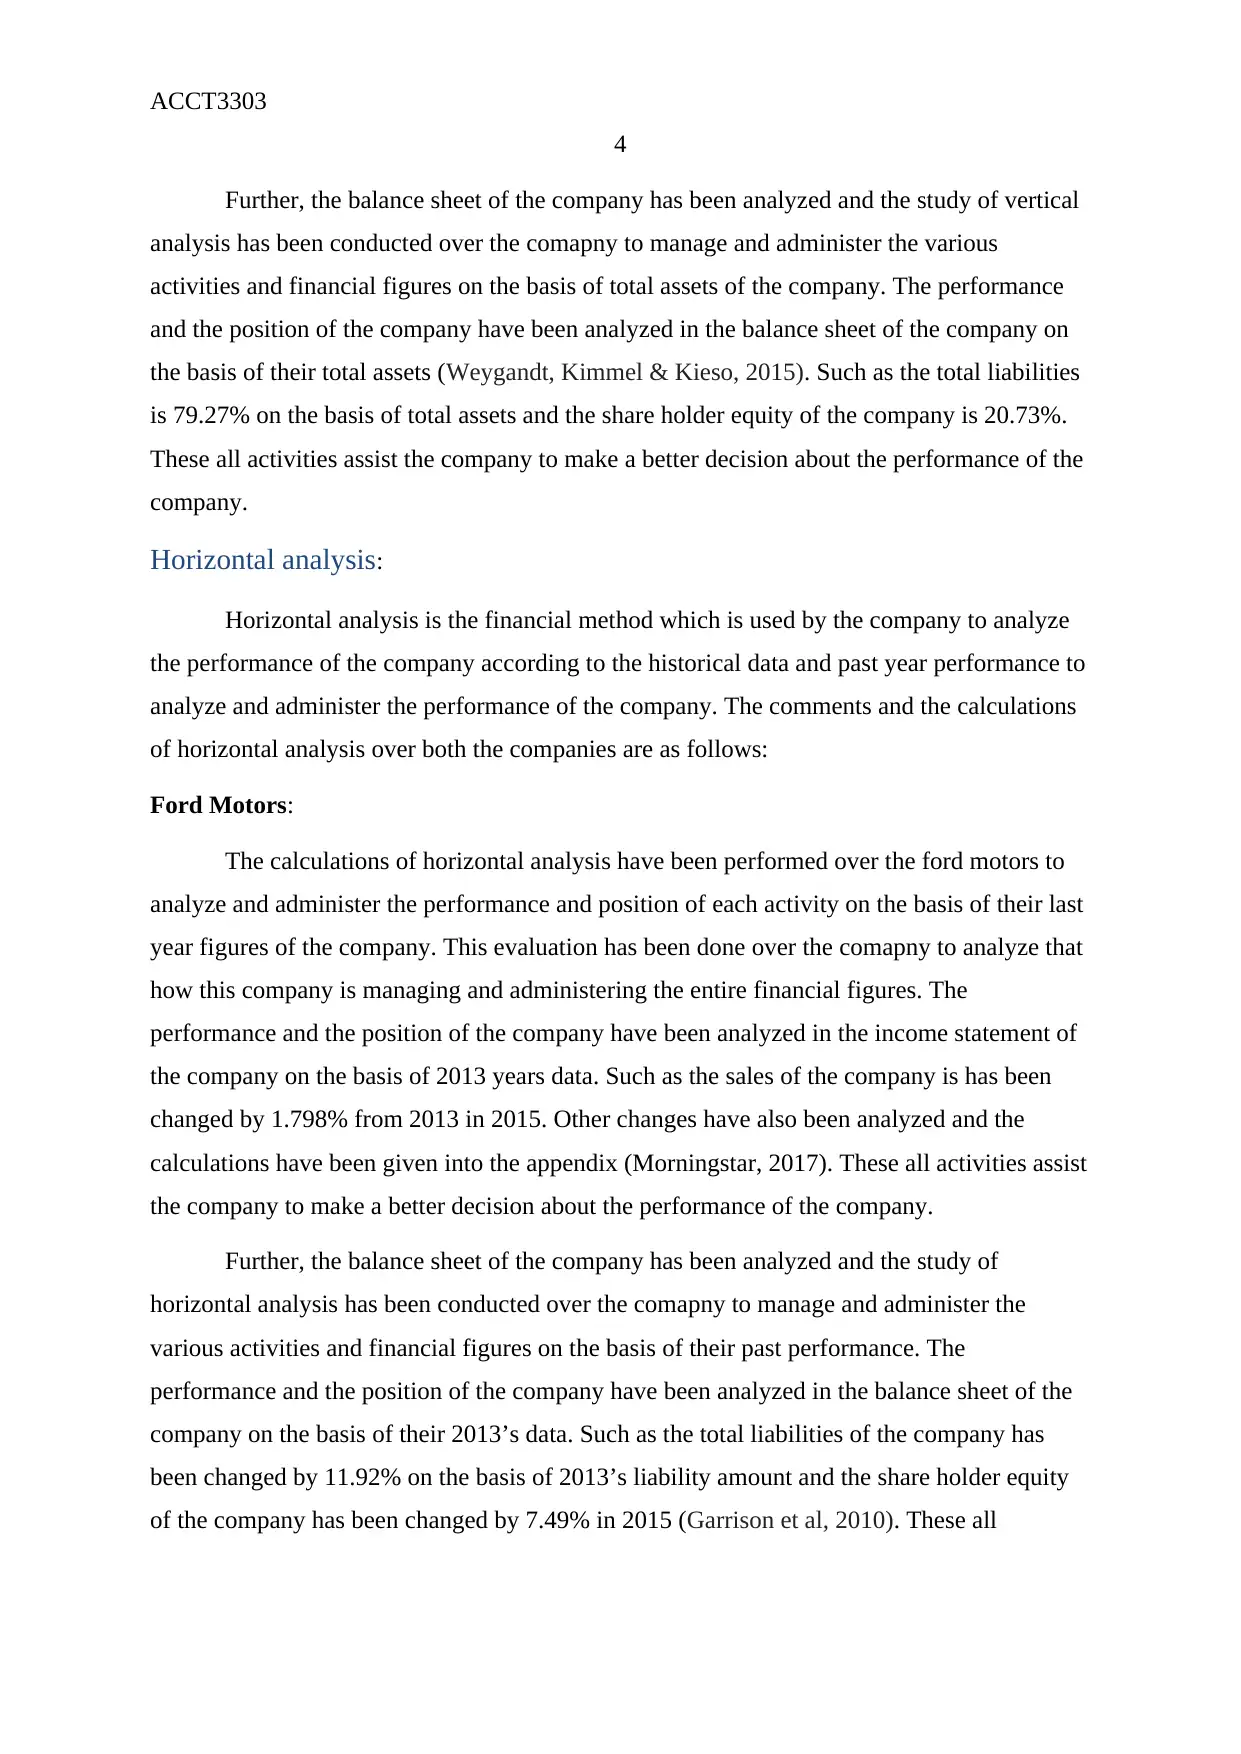
the basis of their total assets (Weygandt, Kimmel & Kieso, 2015). Such as the total liabilities
is 79.27% on the basis of total assets and the share holder equity of the company is 20.73%.
These all activities assist the company to make a better decision about the performance of the
company.
Horizontal analysis:
Horizontal analysis is the financial method which is used by the company to analyze
the performance of the company according to the historical data and past year performance to
analyze and administer the performance of the company. The comments and the calculations
of horizontal analysis over both the companies are as follows:
Ford Motors:
The calculations of horizontal analysis have been performed over the ford motors to
analyze and administer the performance and position of each activity on the basis of their last
year figures of the company. This evaluation has been done over the comapny to analyze that
how this company is managing and administering the entire financial figures. The
performance and the position of the company have been analyzed in the income statement of
the company on the basis of 2013 years data. Such as the sales of the company is has been
changed by 1.798% from 2013 in 2015. Other changes have also been analyzed and the
calculations have been given into the appendix (Morningstar, 2017). These all activities assist
the company to make a better decision about the performance of the company.
Further, the balance sheet of the company has been analyzed and the study of
horizontal analysis has been conducted over the comapny to manage and administer the
various activities and financial figures on the basis of their past performance. The
performance and the position of the company have been analyzed in the balance sheet of the
company on the basis of their 2013’s data. Such as the total liabilities of the company has
been changed by 11.92% on the basis of 2013’s liability amount and the share holder equity
of the company has been changed by 7.49% in 2015 (Garrison et al, 2010). These all
4
Further, the balance sheet of the company has been analyzed and the study of vertical
analysis has been conducted over the comapny to manage and administer the various
activities and financial figures on the basis of total assets of the company. The performance
and the position of the company have been analyzed in the balance sheet of the company on
the basis of their total assets (Weygandt, Kimmel & Kieso, 2015). Such as the total liabilities
is 79.27% on the basis of total assets and the share holder equity of the company is 20.73%.
These all activities assist the company to make a better decision about the performance of the
company.
Horizontal analysis:
Horizontal analysis is the financial method which is used by the company to analyze
the performance of the company according to the historical data and past year performance to
analyze and administer the performance of the company. The comments and the calculations
of horizontal analysis over both the companies are as follows:
Ford Motors:
The calculations of horizontal analysis have been performed over the ford motors to
analyze and administer the performance and position of each activity on the basis of their last
year figures of the company. This evaluation has been done over the comapny to analyze that
how this company is managing and administering the entire financial figures. The
performance and the position of the company have been analyzed in the income statement of
the company on the basis of 2013 years data. Such as the sales of the company is has been
changed by 1.798% from 2013 in 2015. Other changes have also been analyzed and the
calculations have been given into the appendix (Morningstar, 2017). These all activities assist
the company to make a better decision about the performance of the company.
Further, the balance sheet of the company has been analyzed and the study of
horizontal analysis has been conducted over the comapny to manage and administer the
various activities and financial figures on the basis of their past performance. The
performance and the position of the company have been analyzed in the balance sheet of the
company on the basis of their 2013’s data. Such as the total liabilities of the company has
been changed by 11.92% on the basis of 2013’s liability amount and the share holder equity
of the company has been changed by 7.49% in 2015 (Garrison et al, 2010). These all
Paraphrase This Document
Need a fresh take? Get an instant paraphrase of this document with our AI Paraphraser
ACCT3303
5
activities assist the company to make a better decision about the performance of the
company.
General Motors:
The calculations of horizontal analysis have been performed over the General Motors
to analyze and administer the performance and position of each activity on the basis of their
last year figures of the company. This evaluation has been done over the comapny to analyze
that how this company is managing and administering the entire financial figures. The
performance and the position of the company have been analyzed in the income statement of
the company on the basis of 2013 years data. Such as the sales of the company is has been
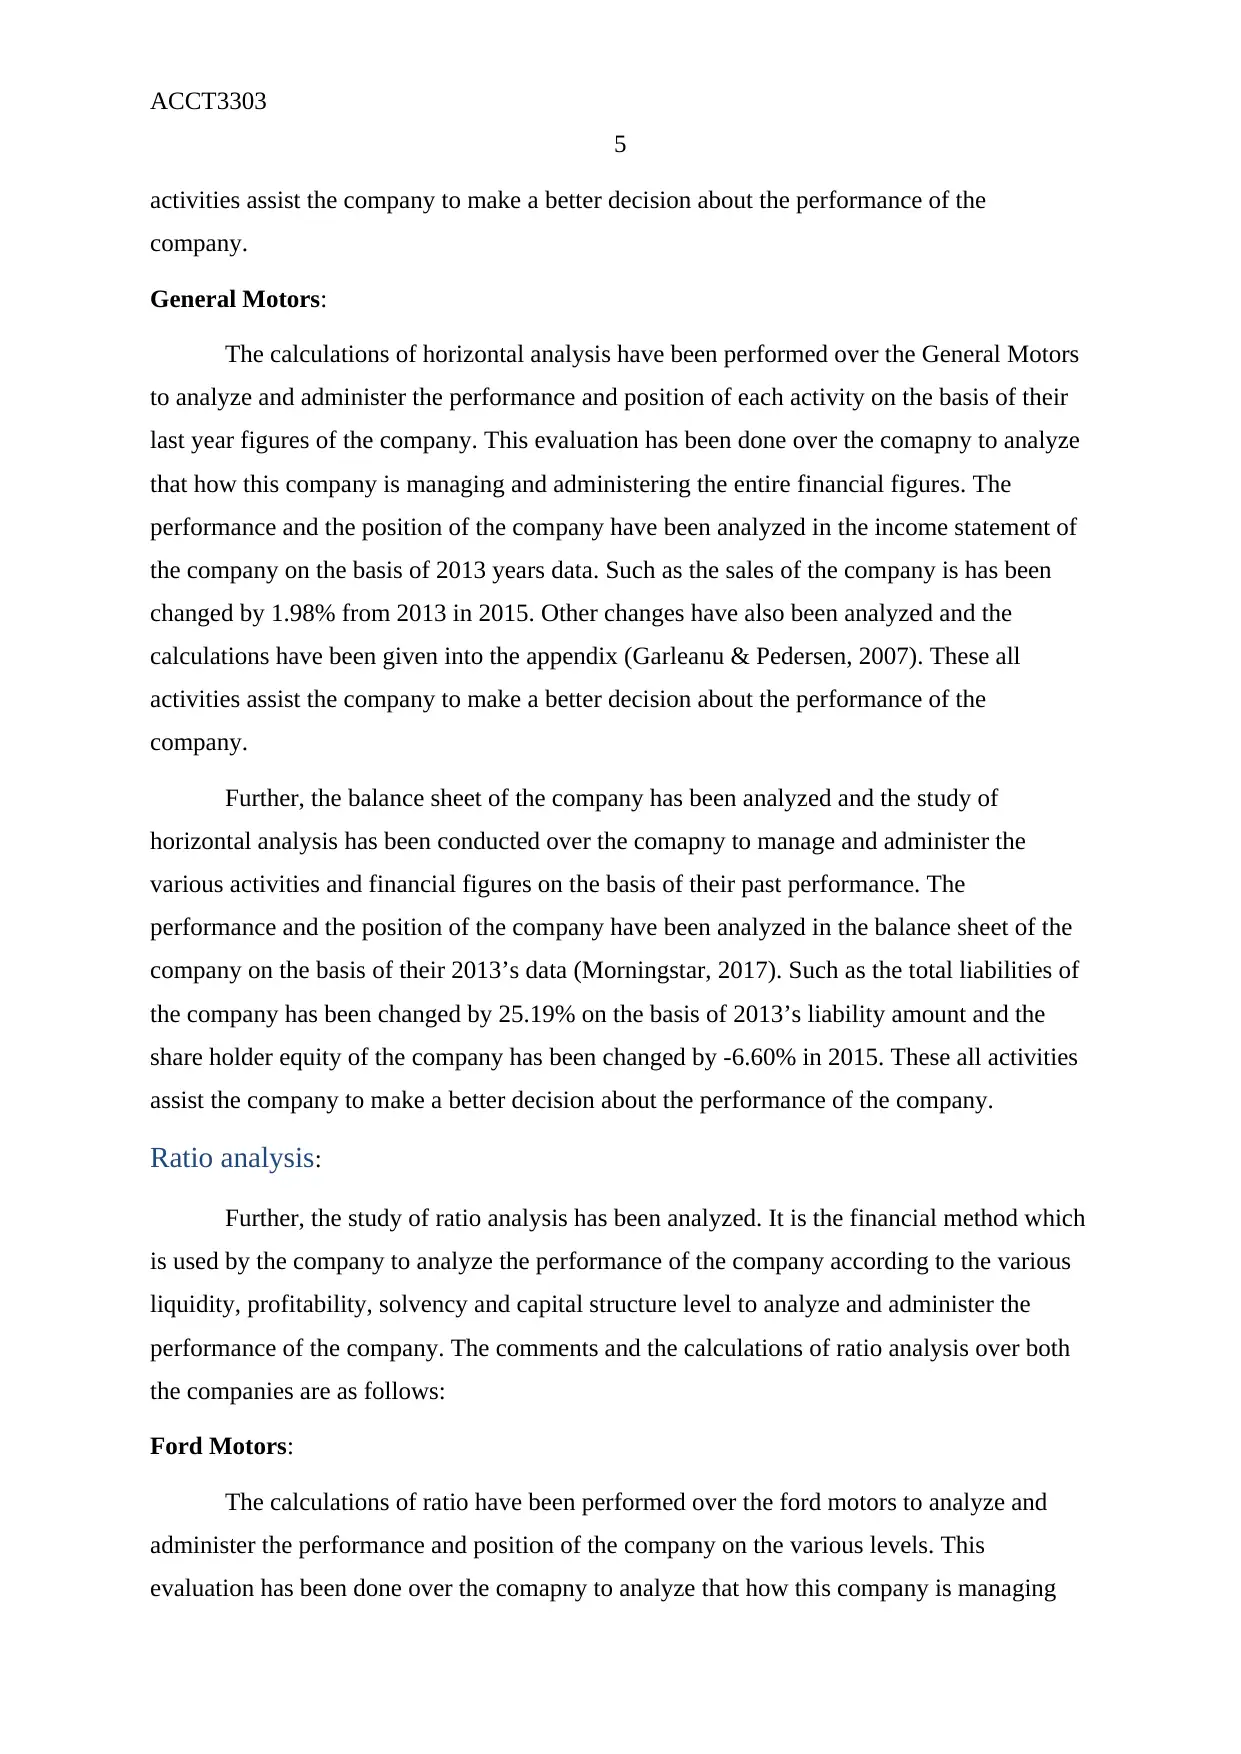
changed by 1.98% from 2013 in 2015. Other changes have also been analyzed and the
calculations have been given into the appendix (Garleanu & Pedersen, 2007). These all
activities assist the company to make a better decision about the performance of the
company.
Further, the balance sheet of the company has been analyzed and the study of
horizontal analysis has been conducted over the comapny to manage and administer the
various activities and financial figures on the basis of their past performance. The
performance and the position of the company have been analyzed in the balance sheet of the
company on the basis of their 2013’s data (Morningstar, 2017). Such as the total liabilities of
the company has been changed by 25.19% on the basis of 2013’s liability amount and the
share holder equity of the company has been changed by -6.60% in 2015. These all activities
assist the company to make a better decision about the performance of the company.
Ratio analysis:
Further, the study of ratio analysis has been analyzed. It is the financial method which
is used by the company to analyze the performance of the company according to the various
liquidity, profitability, solvency and capital structure level to analyze and administer the
performance of the company. The comments and the calculations of ratio analysis over both
the companies are as follows:
Ford Motors:
The calculations of ratio have been performed over the ford motors to analyze and
administer the performance and position of the company on the various levels. This
evaluation has been done over the comapny to analyze that how this company is managing
5
activities assist the company to make a better decision about the performance of the
company.
General Motors:
The calculations of horizontal analysis have been performed over the General Motors
to analyze and administer the performance and position of each activity on the basis of their
last year figures of the company. This evaluation has been done over the comapny to analyze
that how this company is managing and administering the entire financial figures. The
performance and the position of the company have been analyzed in the income statement of
the company on the basis of 2013 years data. Such as the sales of the company is has been
changed by 1.98% from 2013 in 2015. Other changes have also been analyzed and the
calculations have been given into the appendix (Garleanu & Pedersen, 2007). These all
activities assist the company to make a better decision about the performance of the
company.
Further, the balance sheet of the company has been analyzed and the study of
horizontal analysis has been conducted over the comapny to manage and administer the
various activities and financial figures on the basis of their past performance. The
performance and the position of the company have been analyzed in the balance sheet of the
company on the basis of their 2013’s data (Morningstar, 2017). Such as the total liabilities of
the company has been changed by 25.19% on the basis of 2013’s liability amount and the
share holder equity of the company has been changed by -6.60% in 2015. These all activities
assist the company to make a better decision about the performance of the company.
Ratio analysis:
Further, the study of ratio analysis has been analyzed. It is the financial method which
is used by the company to analyze the performance of the company according to the various
liquidity, profitability, solvency and capital structure level to analyze and administer the
performance of the company. The comments and the calculations of ratio analysis over both
the companies are as follows:
Ford Motors:
The calculations of ratio have been performed over the ford motors to analyze and
administer the performance and position of the company on the various levels. This
evaluation has been done over the comapny to analyze that how this company is managing
ACCT3303
6
and administering the entire financial position. The performance and the position of the
company have been analyzed through analyzing the financial figures of the company from
the income statement, balance sheet and cash flow statement (Davies & Crawford, 2011).
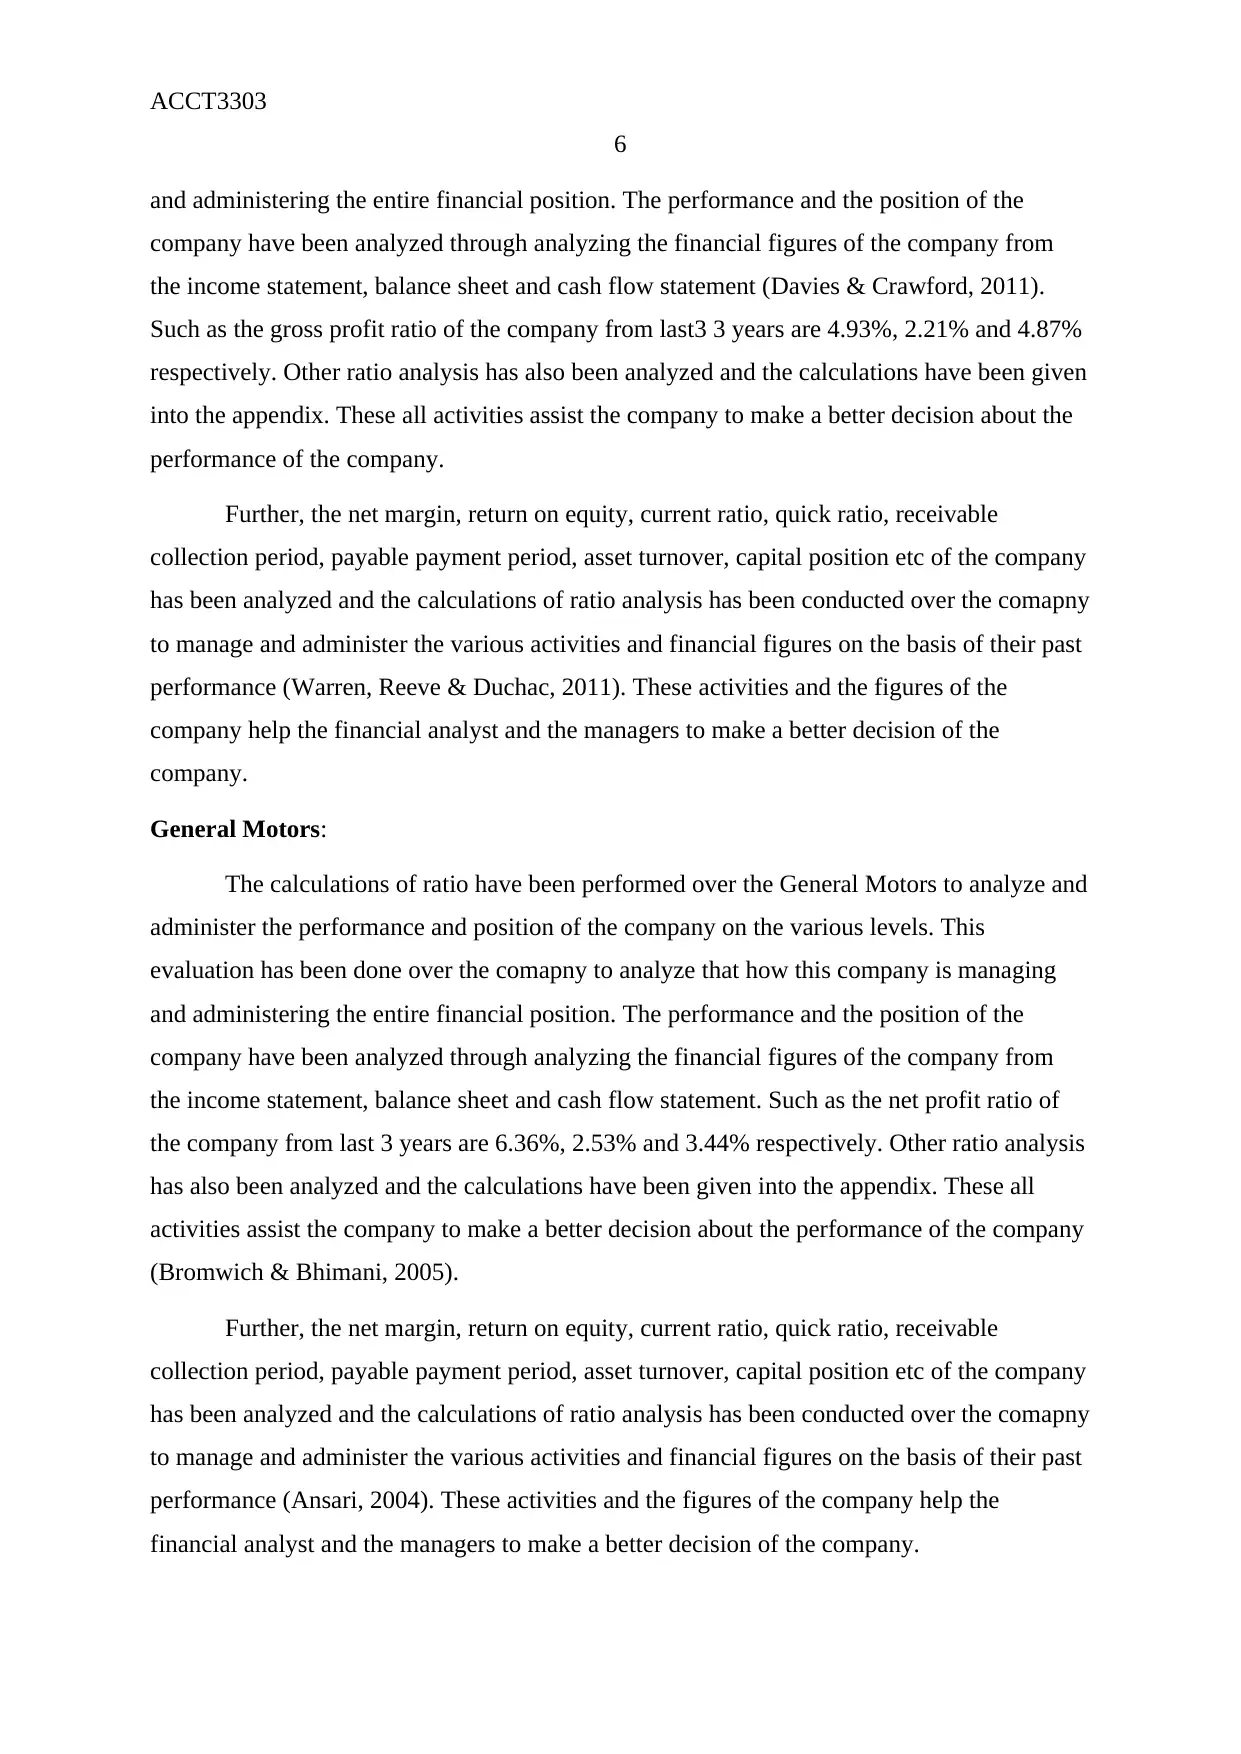
Such as the gross profit ratio of the company from last3 3 years are 4.93%, 2.21% and 4.87%
respectively. Other ratio analysis has also been analyzed and the calculations have been given
into the appendix. These all activities assist the company to make a better decision about the
performance of the company.
Further, the net margin, return on equity, current ratio, quick ratio, receivable
collection period, payable payment period, asset turnover, capital position etc of the company
has been analyzed and the calculations of ratio analysis has been conducted over the comapny
to manage and administer the various activities and financial figures on the basis of their past
performance (Warren, Reeve & Duchac, 2011). These activities and the figures of the
company help the financial analyst and the managers to make a better decision of the
company.
General Motors:
The calculations of ratio have been performed over the General Motors to analyze and
administer the performance and position of the company on the various levels. This
evaluation has been done over the comapny to analyze that how this company is managing
and administering the entire financial position. The performance and the position of the
company have been analyzed through analyzing the financial figures of the company from
the income statement, balance sheet and cash flow statement. Such as the net profit ratio of
the company from last 3 years are 6.36%, 2.53% and 3.44% respectively. Other ratio analysis
has also been analyzed and the calculations have been given into the appendix. These all
activities assist the company to make a better decision about the performance of the company
(Bromwich & Bhimani, 2005).
Further, the net margin, return on equity, current ratio, quick ratio, receivable
collection period, payable payment period, asset turnover, capital position etc of the company
has been analyzed and the calculations of ratio analysis has been conducted over the comapny
to manage and administer the various activities and financial figures on the basis of their past
performance (Ansari, 2004). These activities and the figures of the company help the
financial analyst and the managers to make a better decision of the company.
6
and administering the entire financial position. The performance and the position of the
company have been analyzed through analyzing the financial figures of the company from
the income statement, balance sheet and cash flow statement (Davies & Crawford, 2011).
Such as the gross profit ratio of the company from last3 3 years are 4.93%, 2.21% and 4.87%
respectively. Other ratio analysis has also been analyzed and the calculations have been given
into the appendix. These all activities assist the company to make a better decision about the
performance of the company.
Further, the net margin, return on equity, current ratio, quick ratio, receivable
collection period, payable payment period, asset turnover, capital position etc of the company
has been analyzed and the calculations of ratio analysis has been conducted over the comapny
to manage and administer the various activities and financial figures on the basis of their past
performance (Warren, Reeve & Duchac, 2011). These activities and the figures of the
company help the financial analyst and the managers to make a better decision of the
company.
General Motors:
The calculations of ratio have been performed over the General Motors to analyze and
administer the performance and position of the company on the various levels. This
evaluation has been done over the comapny to analyze that how this company is managing
and administering the entire financial position. The performance and the position of the
company have been analyzed through analyzing the financial figures of the company from
the income statement, balance sheet and cash flow statement. Such as the net profit ratio of
the company from last 3 years are 6.36%, 2.53% and 3.44% respectively. Other ratio analysis
has also been analyzed and the calculations have been given into the appendix. These all
activities assist the company to make a better decision about the performance of the company
(Bromwich & Bhimani, 2005).
Further, the net margin, return on equity, current ratio, quick ratio, receivable
collection period, payable payment period, asset turnover, capital position etc of the company
has been analyzed and the calculations of ratio analysis has been conducted over the comapny
to manage and administer the various activities and financial figures on the basis of their past
performance (Ansari, 2004). These activities and the figures of the company help the
financial analyst and the managers to make a better decision of the company.
⊘ This is a preview!⊘
Do you want full access?
Subscribe today to unlock all pages.
Trusted by 1+ million students worldwide
ACCT3303
7
Recommendation and Conclusion:
Through the above evaluation, it has been found that both the companies are
performing very well and thus the financial performance of the company is also enhancing
continuously. Further, through the vertical analysis, horizontal analysis and the ratio analysis,
it has been found that the performance of the general Motors is way better than the Fore
motors so the investors are suggested to invest into the General Motors.
Paraphrase This Document
Need a fresh take? Get an instant paraphrase of this document with our AI Paraphraser
ACCT3303
8
References:
Ansari S. (2004). Management Accounting: A Strategic Focus. Houghton Mifflin College
Devision.
Bromwich, M. & Bhimani, A., (2005). Management accounting: Pathways to progress. Cima
publishing.
Davies, T. & Crawford, I., (2011). Business accounting and finance. Pearson.
Garleanu, N. B., & Pedersen, L. H. (2007). Liquidity and risk management (No. w12887).
National Bureau of Economic Research.
Garrison, R. H., Noreen, E. W., Brewer, P. C., & McGowan, A. (2010). Managerial
accounting. Issues in Accounting Education, 25(4), 792-793.
Heisinger K. (2009). Essentials of Managerial Accounting. Cengage learning.
Home. (2017). Ford Motors. Retrieved from https://www.ford.com/ as on 9th Nov 2017.
Home. (2017). General Motors. Retrieved from https://www.gm.com/ as on 9th Nov 2017.
Hoque, Z., (2012). Strategic management accounting. Spiro Press.
Juan García-Teruel, P., & Martinez-Solano, P. (2007). Effects of working capital
management on SME profitability. International Journal of managerial finance, 3(2),
164-177.
Larcker, D.F., Richardson, S.A. & Tuna, I., (2007). Corporate governance, accounting
outcomes, and organizational performance. The Accounting Review, 82(4), pp.963-
1008.
Morningstar. (2017). Ford Motors. Retrieved from
http://beta.morningstar.com/stocks/xnys/f/quote.html as on 9th Nov 2017.
Morningstar. (2017). General Motors. Retrieved from
http://beta.morningstar.com/stocks/XNYS/GM/quote.html as on 9th Nov 2017.
Warren C., Reeve J. & Duchac J. (2011). Financial and Managerail Accounting. Cengage
Learning.
ACCT3303
9
Weygandt, J. J., Kimmel, P. D., & Kieso, D. E. (2015). Financial & Managerial Accounting.
John Wiley & Sons.
9
Weygandt, J. J., Kimmel, P. D., & Kieso, D. E. (2015). Financial & Managerial Accounting.
John Wiley & Sons.
⊘ This is a preview!⊘
Do you want full access?
Subscribe today to unlock all pages.
Trusted by 1+ million students worldwide
ACCT3303
10
Appendix:
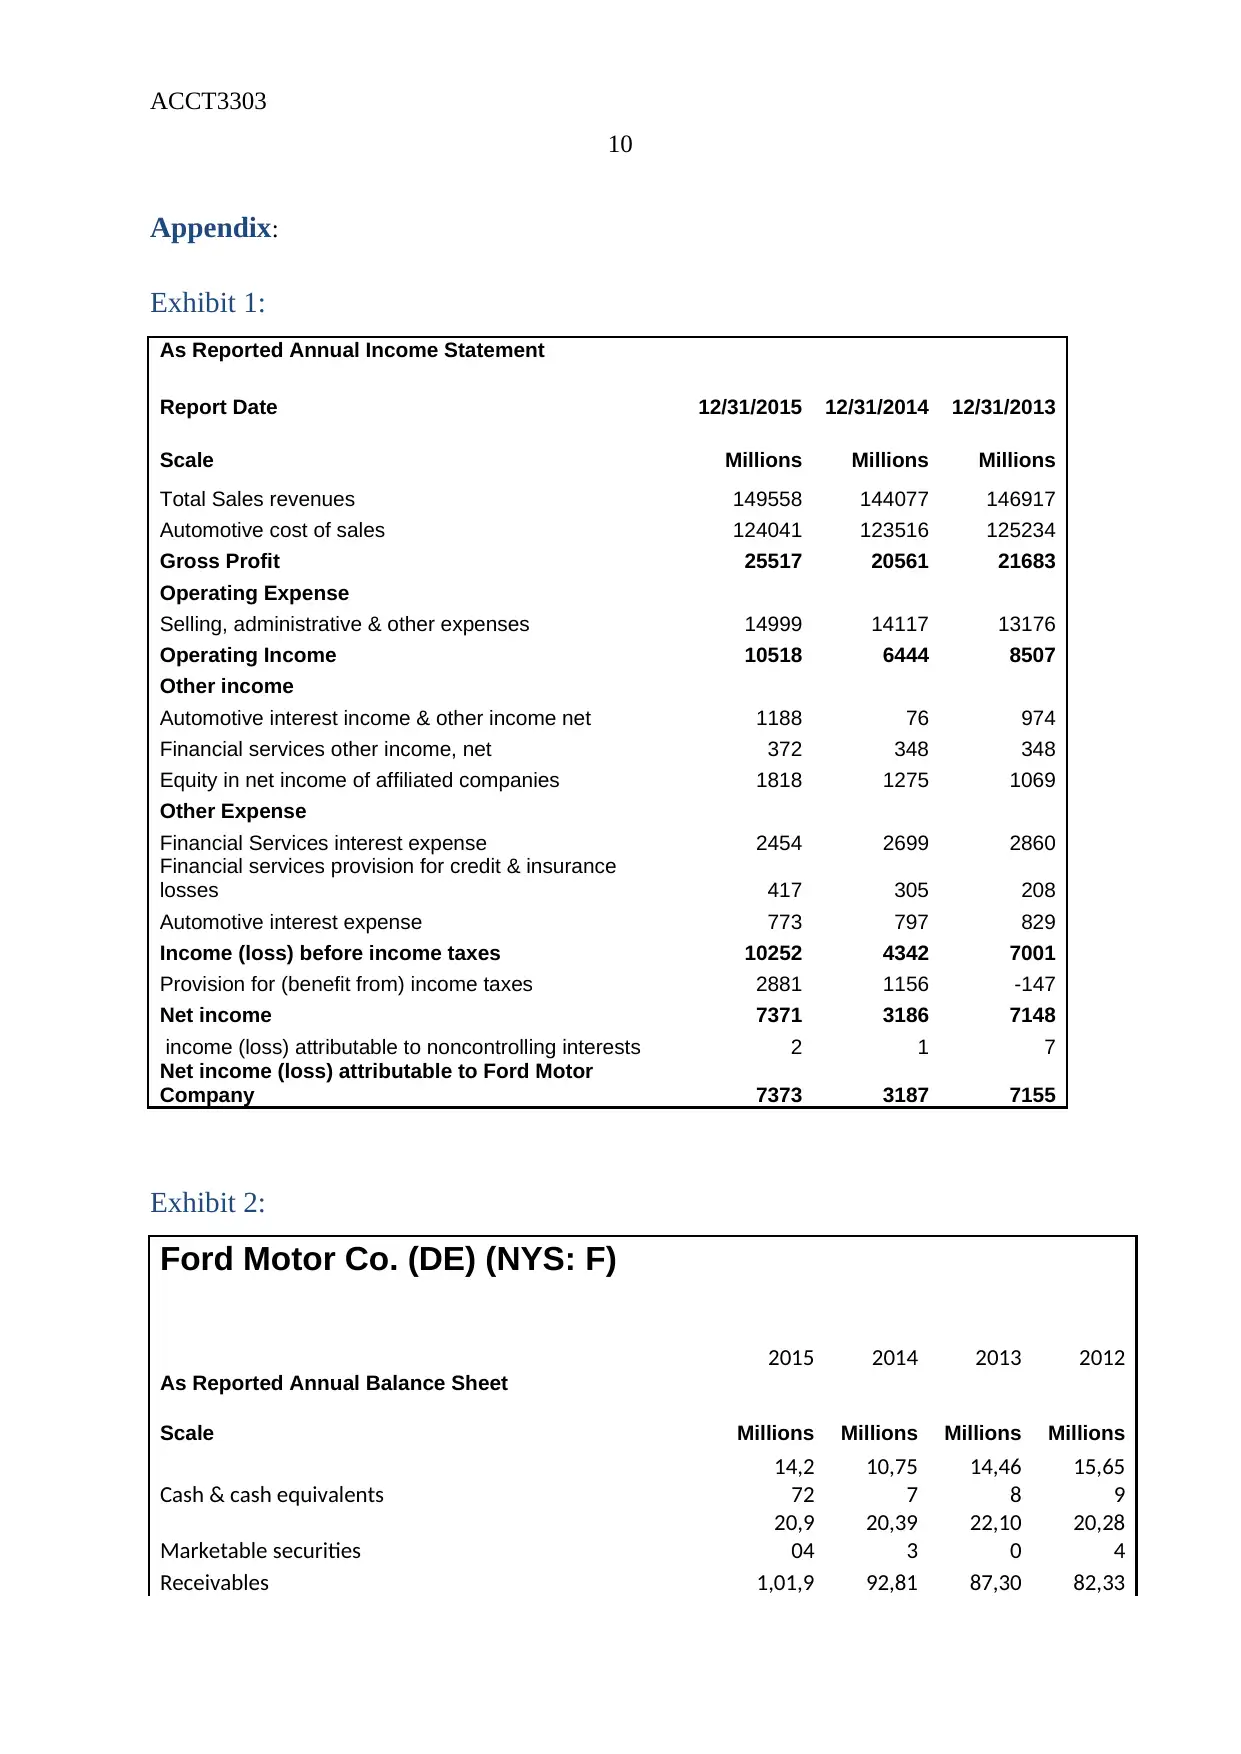
Exhibit 1:
As Reported Annual Income Statement
Report Date 12/31/2015 12/31/2014 12/31/2013
Scale Millions Millions Millions
Total Sales revenues 149558 144077 146917
Automotive cost of sales 124041 123516 125234
Gross Profit 25517 20561 21683
Operating Expense
Selling, administrative & other expenses 14999 14117 13176
Operating Income 10518 6444 8507
Other income
Automotive interest income & other income net 1188 76 974
Financial services other income, net 372 348 348
Equity in net income of affiliated companies 1818 1275 1069
Other Expense
Financial Services interest expense 2454 2699 2860
Financial services provision for credit & insurance
losses 417 305 208
Automotive interest expense 773 797 829
Income (loss) before income taxes 10252 4342 7001
Provision for (benefit from) income taxes 2881 1156 -147
Net income 7371 3186 7148
income (loss) attributable to noncontrolling interests 2 1 7
Net income (loss) attributable to Ford Motor
Company 7373 3187 7155
Exhibit 2:
Ford Motor Co. (DE) (NYS: F)
2015 2014 2013 2012
As Reported Annual Balance Sheet
Scale Millions Millions Millions Millions
Cash & cash equivalents
14,2
72
10,75
7
14,46
8
15,65
9
Marketable securities
20,9
04
20,39
3
22,10
0
20,28
4
Receivables 1,01,9 92,81 87,30 82,33
10
Appendix:
Exhibit 1:
As Reported Annual Income Statement
Report Date 12/31/2015 12/31/2014 12/31/2013
Scale Millions Millions Millions
Total Sales revenues 149558 144077 146917
Automotive cost of sales 124041 123516 125234
Gross Profit 25517 20561 21683
Operating Expense
Selling, administrative & other expenses 14999 14117 13176
Operating Income 10518 6444 8507
Other income
Automotive interest income & other income net 1188 76 974
Financial services other income, net 372 348 348
Equity in net income of affiliated companies 1818 1275 1069
Other Expense
Financial Services interest expense 2454 2699 2860
Financial services provision for credit & insurance
losses 417 305 208
Automotive interest expense 773 797 829
Income (loss) before income taxes 10252 4342 7001
Provision for (benefit from) income taxes 2881 1156 -147
Net income 7371 3186 7148
income (loss) attributable to noncontrolling interests 2 1 7
Net income (loss) attributable to Ford Motor
Company 7373 3187 7155
Exhibit 2:
Ford Motor Co. (DE) (NYS: F)
2015 2014 2013 2012
As Reported Annual Balance Sheet
Scale Millions Millions Millions Millions
Cash & cash equivalents
14,2
72
10,75
7
14,46
8
15,65
9
Marketable securities
20,9
04
20,39
3
22,10
0
20,28
4
Receivables 1,01,9 92,81 87,30 82,33
Paraphrase This Document
Need a fresh take? Get an instant paraphrase of this document with our AI Paraphraser
ACCT3303
11
75 9 9 8
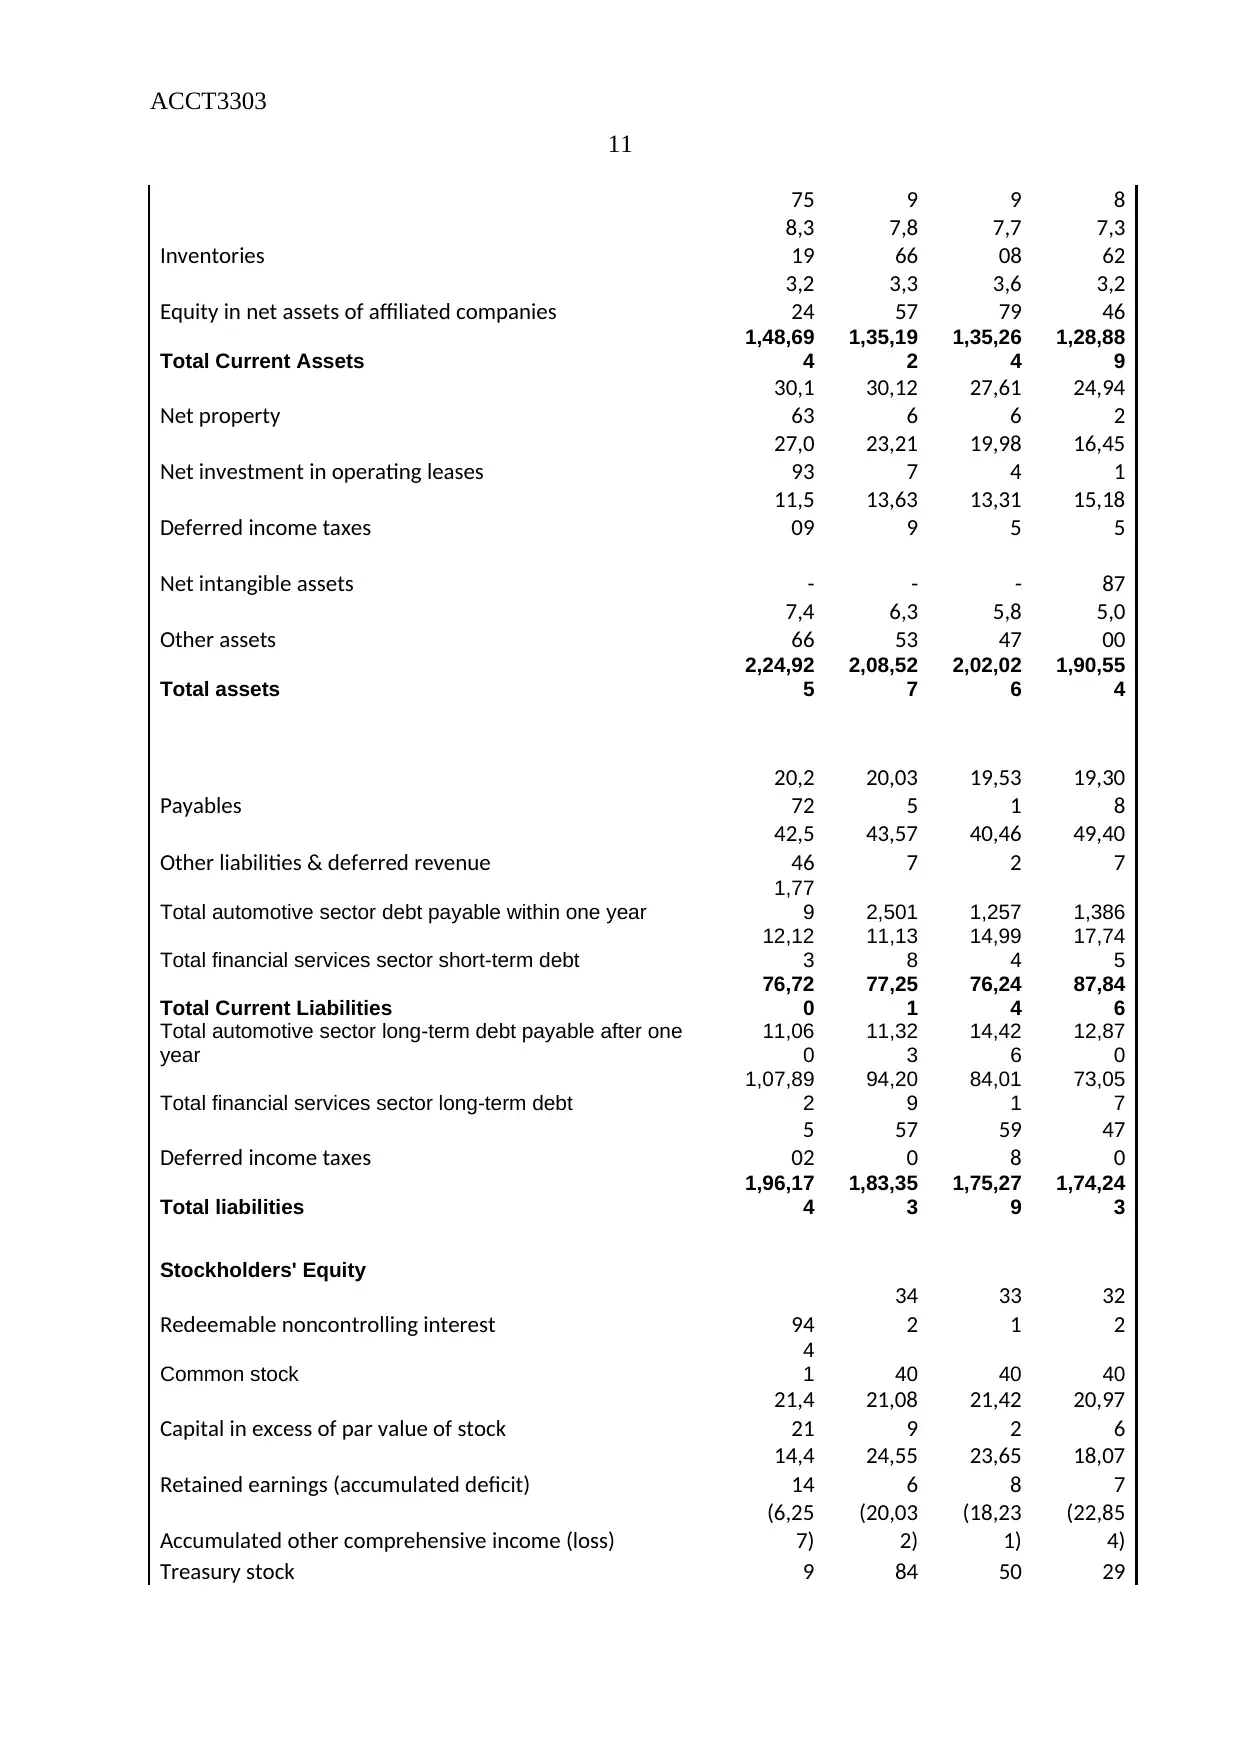
Inventories
8,3
19
7,8
66
7,7
08
7,3
62
Equity in net assets of affiliated companies
3,2
24
3,3
57
3,6
79
3,2
46
Total Current Assets
1,48,69
4
1,35,19
2
1,35,26
4
1,28,88
9
Net property
30,1
63
30,12
6
27,61
6
24,94
2
Net investment in operating leases
27,0
93
23,21
7
19,98
4
16,45
1
Deferred income taxes
11,5
09
13,63
9
13,31
5
15,18
5
Net intangible assets - - - 87
Other assets
7,4
66
6,3
53
5,8
47
5,0
00
Total assets
2,24,92
5
2,08,52
7
2,02,02
6
1,90,55
4
Payables
20,2
72
20,03
5
19,53
1
19,30
8
Other liabilities & deferred revenue
42,5
46
43,57
7
40,46
2
49,40
7
Total automotive sector debt payable within one year
1,77
9 2,501 1,257 1,386
Total financial services sector short-term debt
12,12
3
11,13
8
14,99
4
17,74
5
Total Current Liabilities
76,72
0
77,25
1
76,24
4
87,84
6
Total automotive sector long-term debt payable after one
year
11,06
0
11,32
3
14,42
6
12,87
0
Total financial services sector long-term debt
1,07,89
2
94,20
9
84,01
1
73,05
7
Deferred income taxes
5
02
57
0
59
8
47
0
Total liabilities
1,96,17
4
1,83,35
3
1,75,27
9
1,74,24
3
Stockholders' Equity
Redeemable noncontrolling interest 94
34
2
33
1
32
2
Common stock
4
1 40 40 40
Capital in excess of par value of stock
21,4
21
21,08
9
21,42
2
20,97
6
Retained earnings (accumulated deficit)
14,4
14
24,55
6
23,65
8
18,07
7
Accumulated other comprehensive income (loss)
(6,25
7)
(20,03
2)
(18,23
1)
(22,85
4)
Treasury stock 9 84 50 29
11
75 9 9 8
Inventories
8,3
19
7,8
66
7,7
08
7,3
62
Equity in net assets of affiliated companies
3,2
24
3,3
57
3,6
79
3,2
46
Total Current Assets
1,48,69
4
1,35,19
2
1,35,26
4
1,28,88
9
Net property
30,1
63
30,12
6
27,61
6
24,94
2
Net investment in operating leases
27,0
93
23,21
7
19,98
4
16,45
1
Deferred income taxes
11,5
09
13,63
9
13,31
5
15,18
5
Net intangible assets - - - 87
Other assets
7,4
66
6,3
53
5,8
47
5,0
00
Total assets
2,24,92
5
2,08,52
7
2,02,02
6
1,90,55
4
Payables
20,2
72
20,03
5
19,53
1
19,30
8
Other liabilities & deferred revenue
42,5
46
43,57
7
40,46
2
49,40
7
Total automotive sector debt payable within one year
1,77
9 2,501 1,257 1,386
Total financial services sector short-term debt
12,12
3
11,13
8
14,99
4
17,74
5
Total Current Liabilities
76,72
0
77,25
1
76,24
4
87,84
6
Total automotive sector long-term debt payable after one
year
11,06
0
11,32
3
14,42
6
12,87
0
Total financial services sector long-term debt
1,07,89
2
94,20
9
84,01
1
73,05
7
Deferred income taxes
5
02
57
0
59
8
47
0
Total liabilities
1,96,17
4
1,83,35
3
1,75,27
9
1,74,24
3
Stockholders' Equity
Redeemable noncontrolling interest 94
34
2
33
1
32
2
Common stock
4
1 40 40 40
Capital in excess of par value of stock
21,4
21
21,08
9
21,42
2
20,97
6
Retained earnings (accumulated deficit)
14,4
14
24,55
6
23,65
8
18,07
7
Accumulated other comprehensive income (loss)
(6,25
7)
(20,03
2)
(18,23
1)
(22,85
4)
Treasury stock 9 84 50 29
ACCT3303
12
77 8 6 2
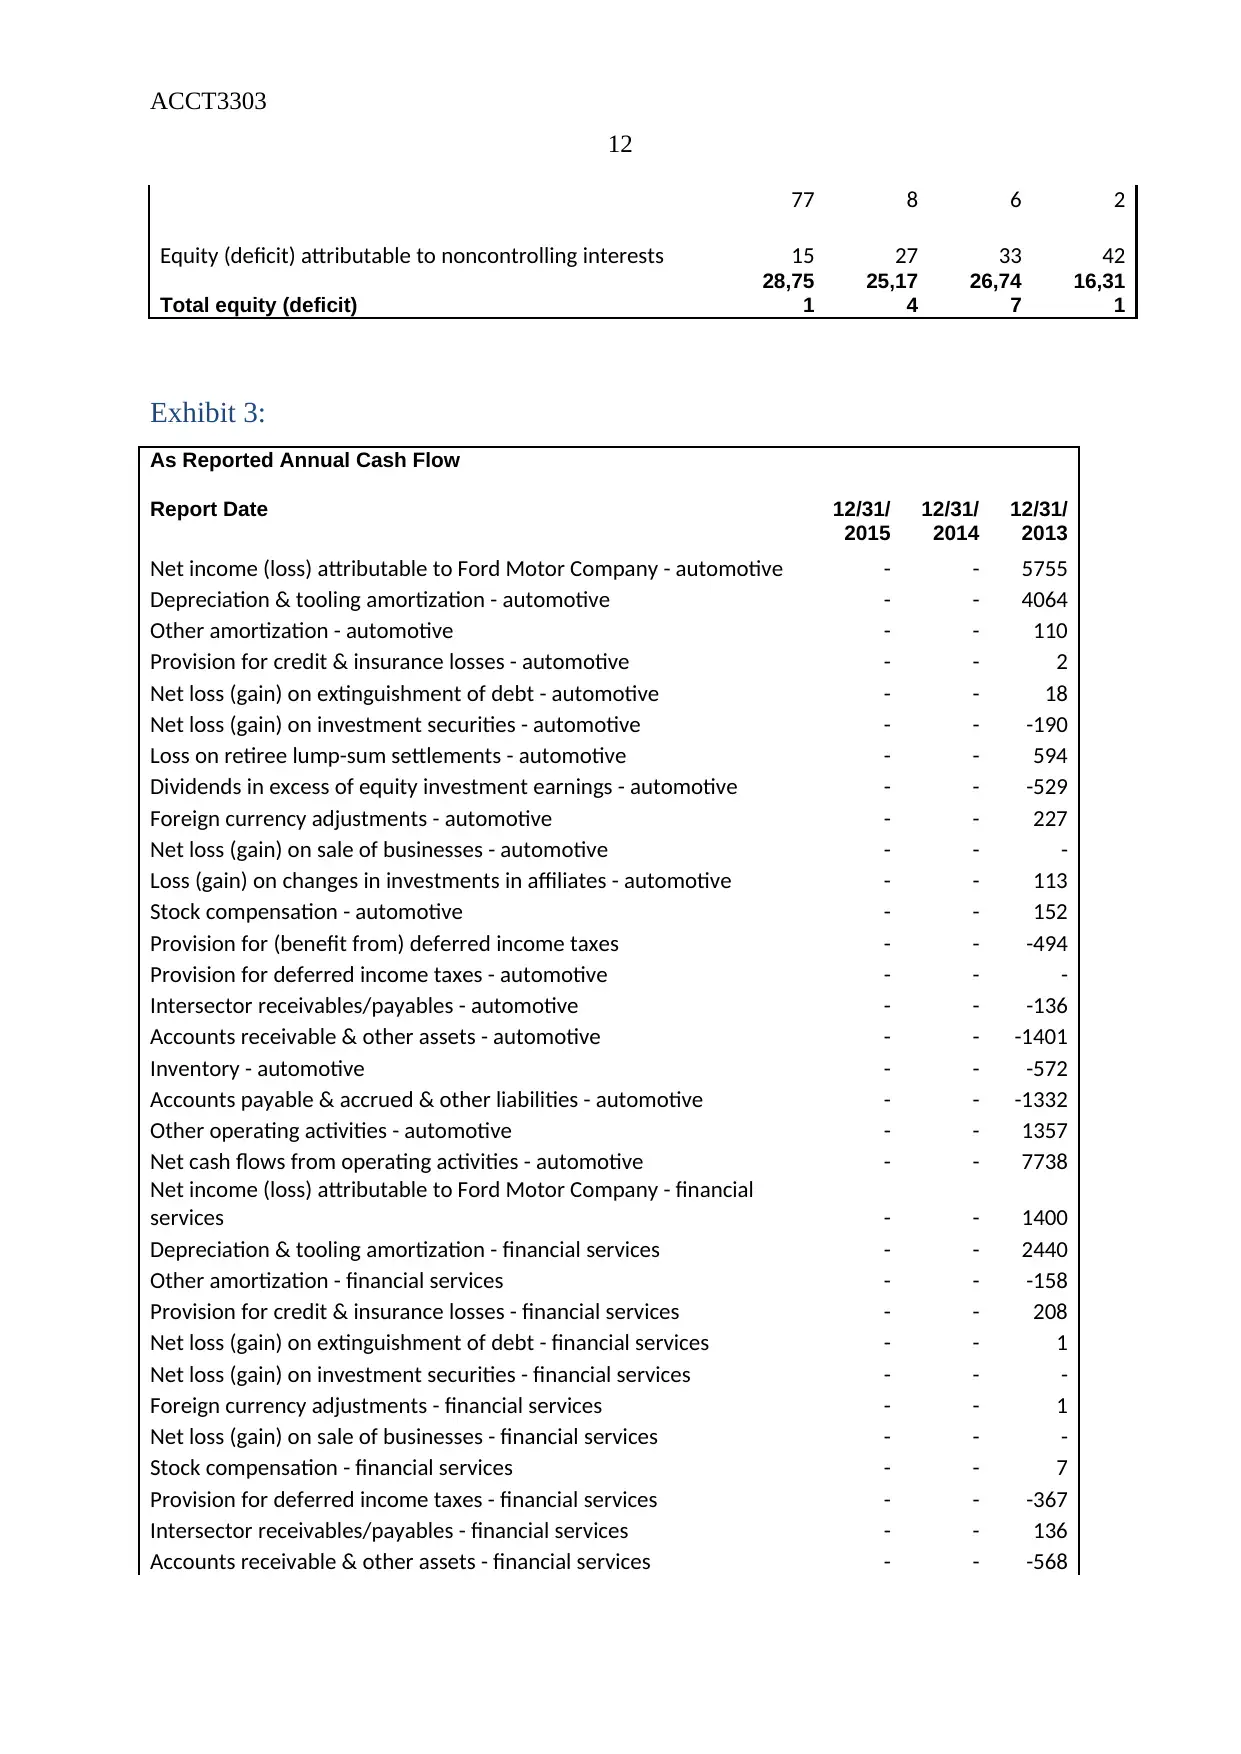
Equity (deficit) attributable to noncontrolling interests 15 27 33 42
Total equity (deficit)
28,75
1
25,17
4
26,74
7
16,31
1
Exhibit 3:
As Reported Annual Cash Flow
Report Date 12/31/
2015
12/31/
2014
12/31/
2013
Net income (loss) attributable to Ford Motor Company - automotive - - 5755
Depreciation & tooling amortization - automotive - - 4064
Other amortization - automotive - - 110
Provision for credit & insurance losses - automotive - - 2
Net loss (gain) on extinguishment of debt - automotive - - 18
Net loss (gain) on investment securities - automotive - - -190
Loss on retiree lump-sum settlements - automotive - - 594
Dividends in excess of equity investment earnings - automotive - - -529
Foreign currency adjustments - automotive - - 227
Net loss (gain) on sale of businesses - automotive - - -
Loss (gain) on changes in investments in affiliates - automotive - - 113
Stock compensation - automotive - - 152
Provision for (benefit from) deferred income taxes - - -494
Provision for deferred income taxes - automotive - - -
Intersector receivables/payables - automotive - - -136
Accounts receivable & other assets - automotive - - -1401
Inventory - automotive - - -572
Accounts payable & accrued & other liabilities - automotive - - -1332
Other operating activities - automotive - - 1357
Net cash flows from operating activities - automotive - - 7738
Net income (loss) attributable to Ford Motor Company - financial
services - - 1400
Depreciation & tooling amortization - financial services - - 2440
Other amortization - financial services - - -158
Provision for credit & insurance losses - financial services - - 208
Net loss (gain) on extinguishment of debt - financial services - - 1
Net loss (gain) on investment securities - financial services - - -
Foreign currency adjustments - financial services - - 1
Net loss (gain) on sale of businesses - financial services - - -
Stock compensation - financial services - - 7
Provision for deferred income taxes - financial services - - -367
Intersector receivables/payables - financial services - - 136
Accounts receivable & other assets - financial services - - -568
12
77 8 6 2
Equity (deficit) attributable to noncontrolling interests 15 27 33 42
Total equity (deficit)
28,75
1
25,17
4
26,74
7
16,31
1
Exhibit 3:
As Reported Annual Cash Flow
Report Date 12/31/
2015
12/31/
2014
12/31/
2013
Net income (loss) attributable to Ford Motor Company - automotive - - 5755
Depreciation & tooling amortization - automotive - - 4064
Other amortization - automotive - - 110
Provision for credit & insurance losses - automotive - - 2
Net loss (gain) on extinguishment of debt - automotive - - 18
Net loss (gain) on investment securities - automotive - - -190
Loss on retiree lump-sum settlements - automotive - - 594
Dividends in excess of equity investment earnings - automotive - - -529
Foreign currency adjustments - automotive - - 227
Net loss (gain) on sale of businesses - automotive - - -
Loss (gain) on changes in investments in affiliates - automotive - - 113
Stock compensation - automotive - - 152
Provision for (benefit from) deferred income taxes - - -494
Provision for deferred income taxes - automotive - - -
Intersector receivables/payables - automotive - - -136
Accounts receivable & other assets - automotive - - -1401
Inventory - automotive - - -572
Accounts payable & accrued & other liabilities - automotive - - -1332
Other operating activities - automotive - - 1357
Net cash flows from operating activities - automotive - - 7738
Net income (loss) attributable to Ford Motor Company - financial
services - - 1400
Depreciation & tooling amortization - financial services - - 2440
Other amortization - financial services - - -158
Provision for credit & insurance losses - financial services - - 208
Net loss (gain) on extinguishment of debt - financial services - - 1
Net loss (gain) on investment securities - financial services - - -
Foreign currency adjustments - financial services - - 1
Net loss (gain) on sale of businesses - financial services - - -
Stock compensation - financial services - - 7
Provision for deferred income taxes - financial services - - -367
Intersector receivables/payables - financial services - - 136
Accounts receivable & other assets - financial services - - -568
⊘ This is a preview!⊘
Do you want full access?
Subscribe today to unlock all pages.
Trusted by 1+ million students worldwide
1 out of 32
Related Documents


Your All-in-One AI-Powered Toolkit for Academic Success.
+13062052269
info@desklib.com
Available 24*7 on WhatsApp / Email
![[object Object]](/_next/static/media/star-bottom.7253800d.svg)
Unlock your academic potential
Copyright © 2020–2026 A2Z Services. All Rights Reserved. Developed and managed by ZUCOL.