Ford Motors Company: Financial Analysis, Market Position, and Culture
VerifiedAdded on 2023/04/21
|11
|2138
|131
Report
AI Summary
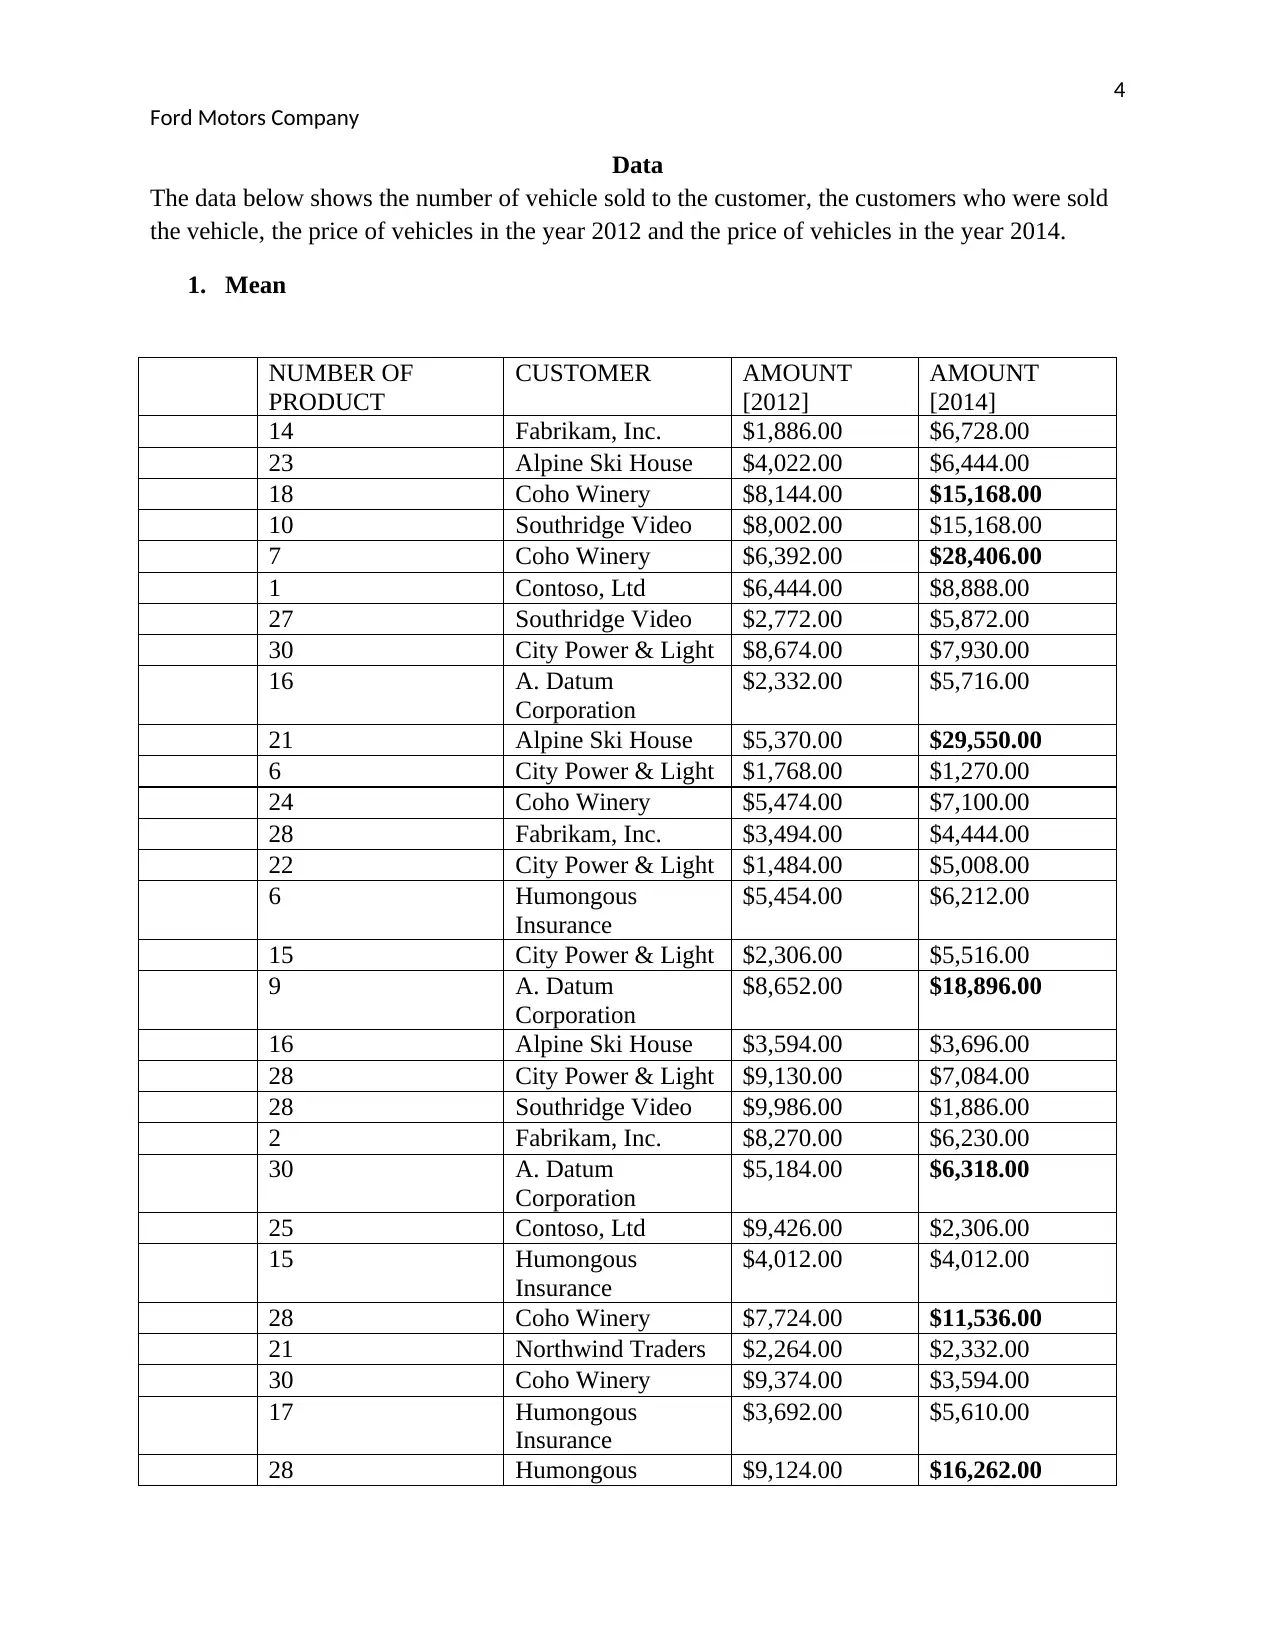
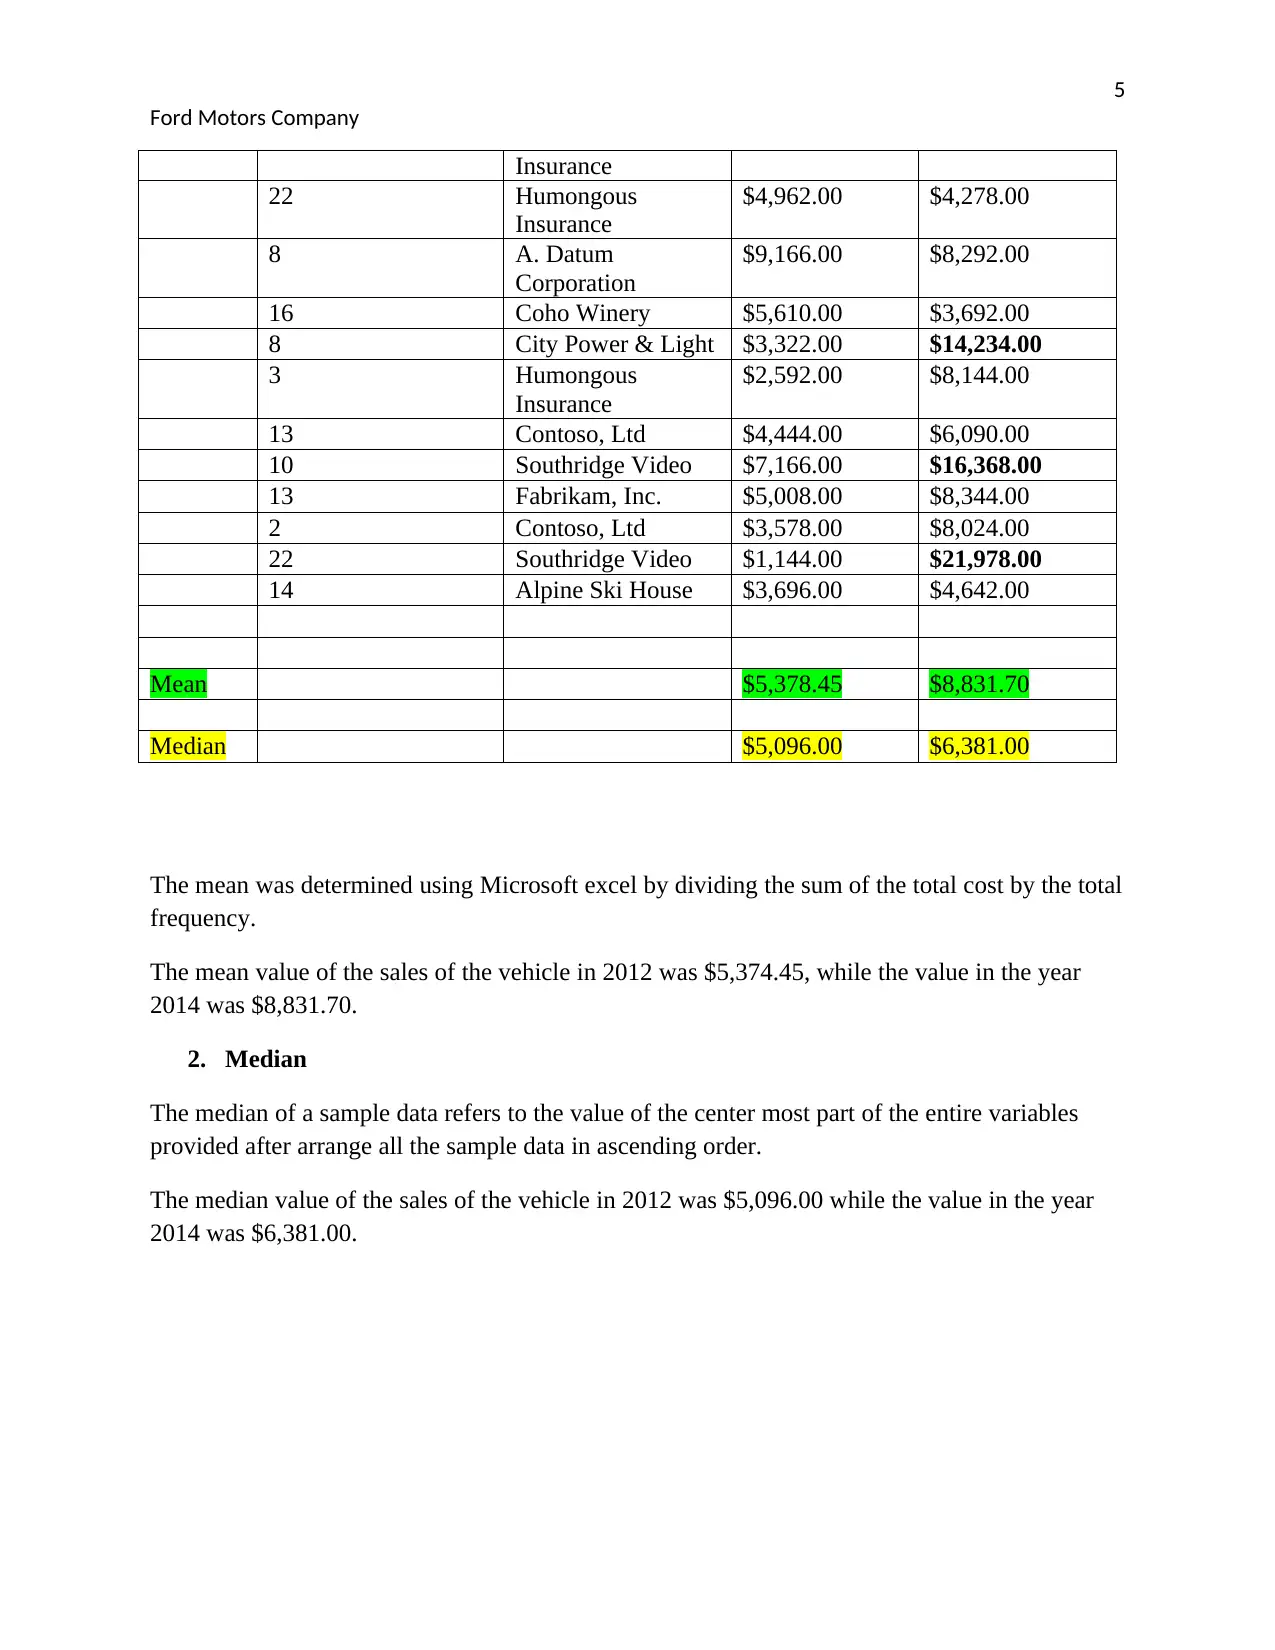
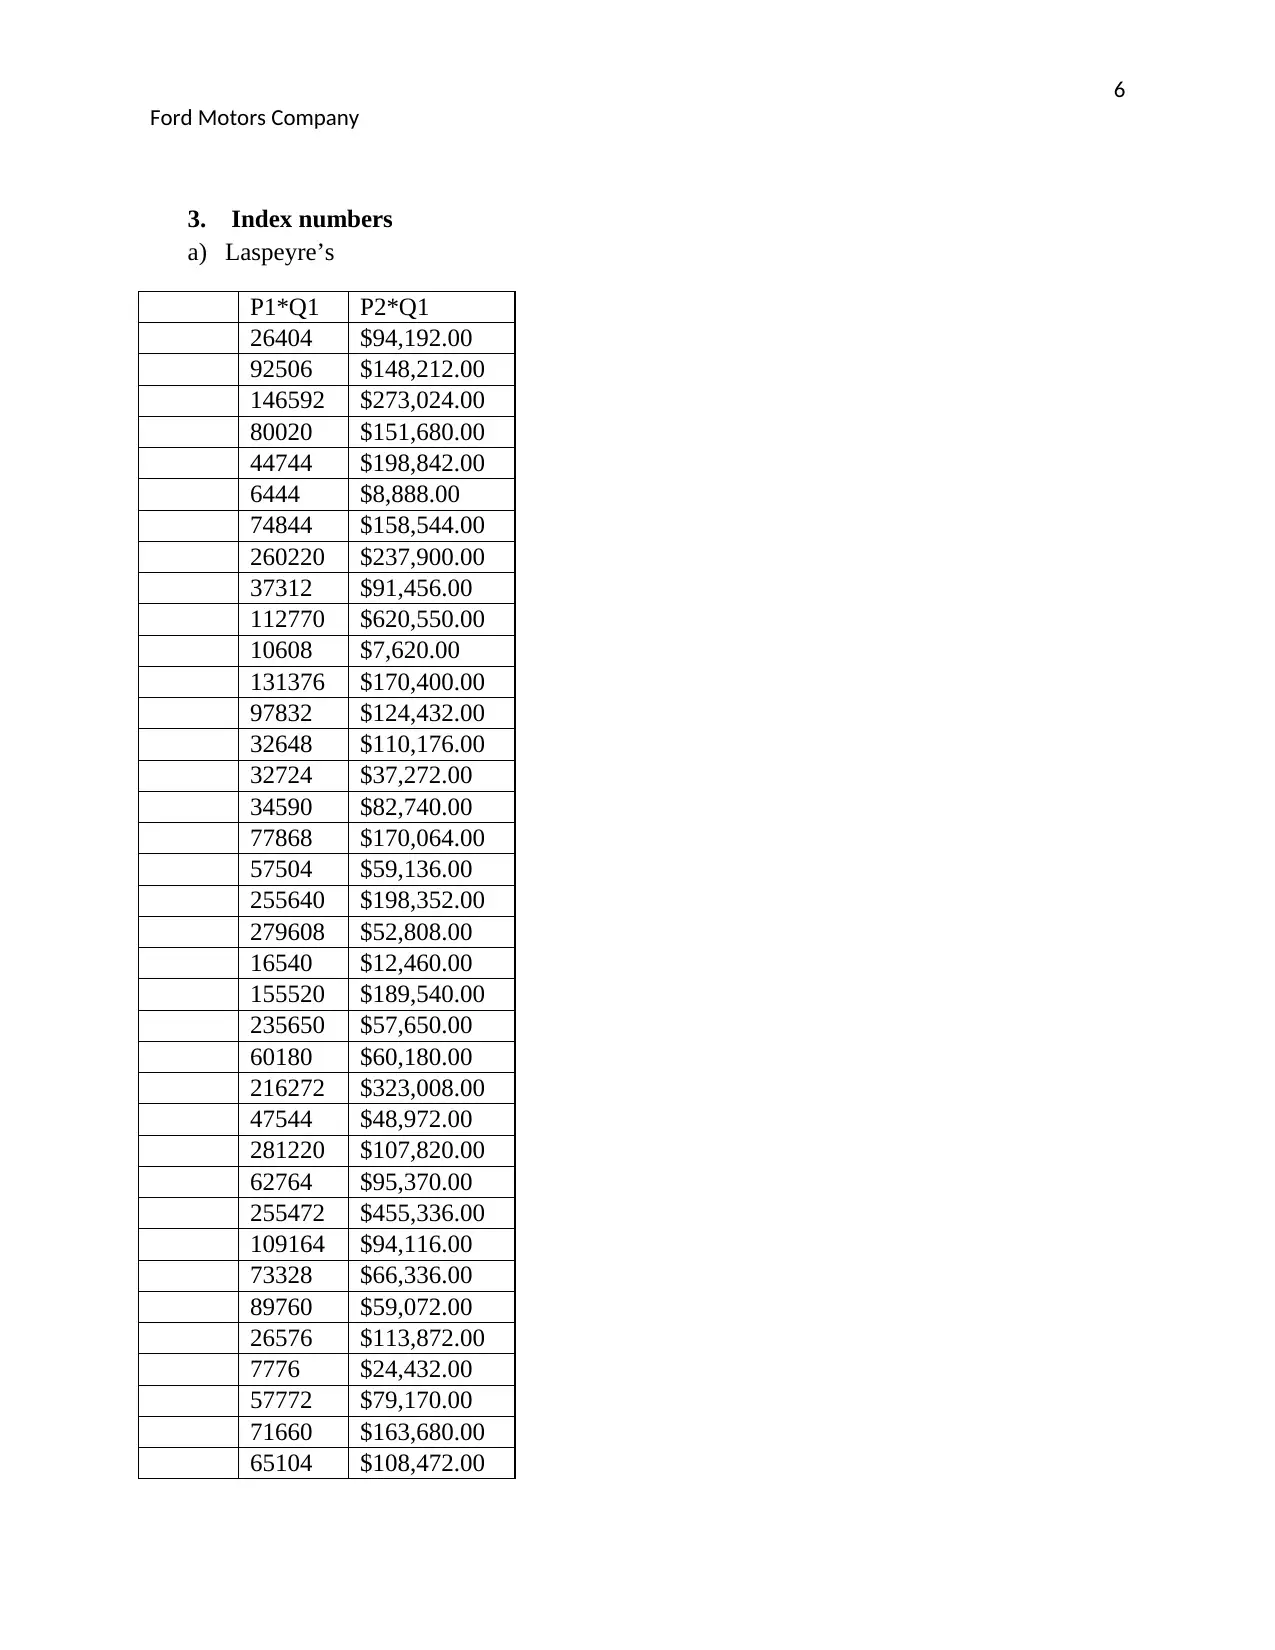
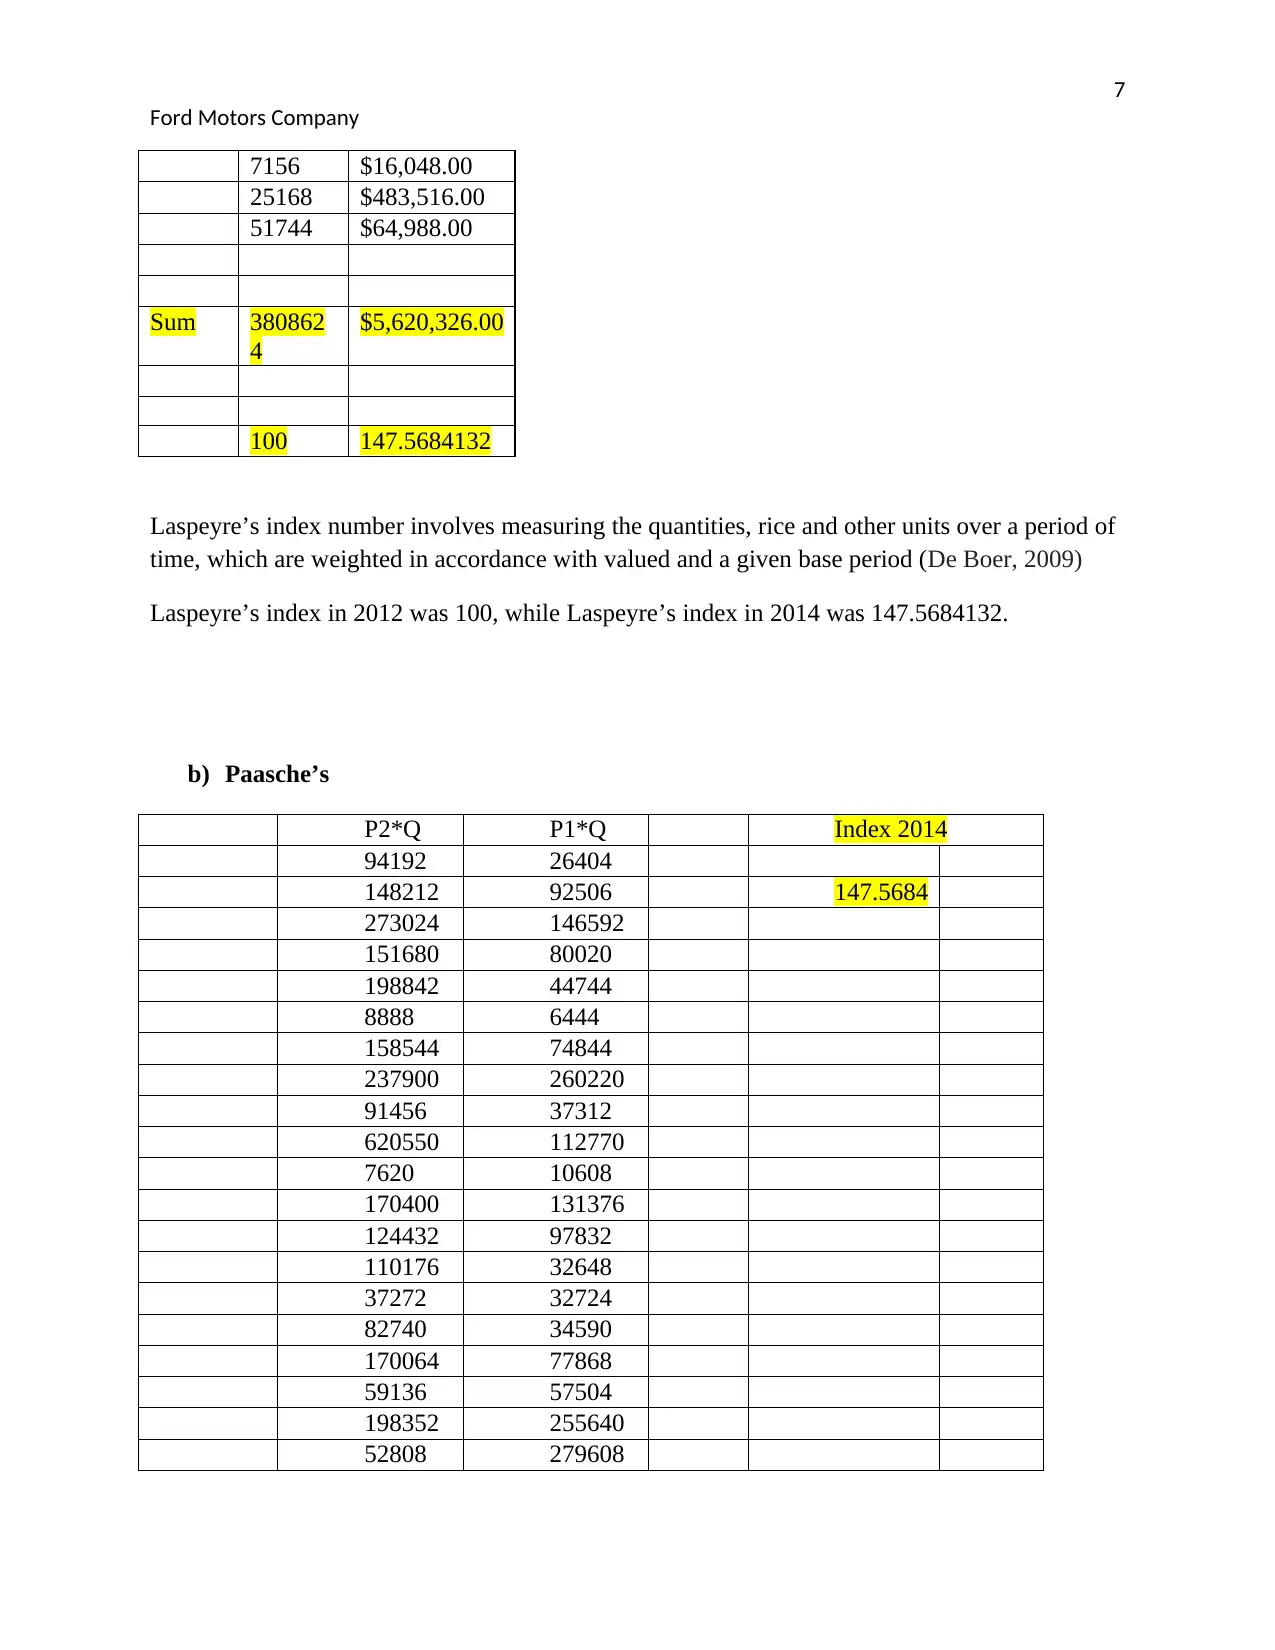
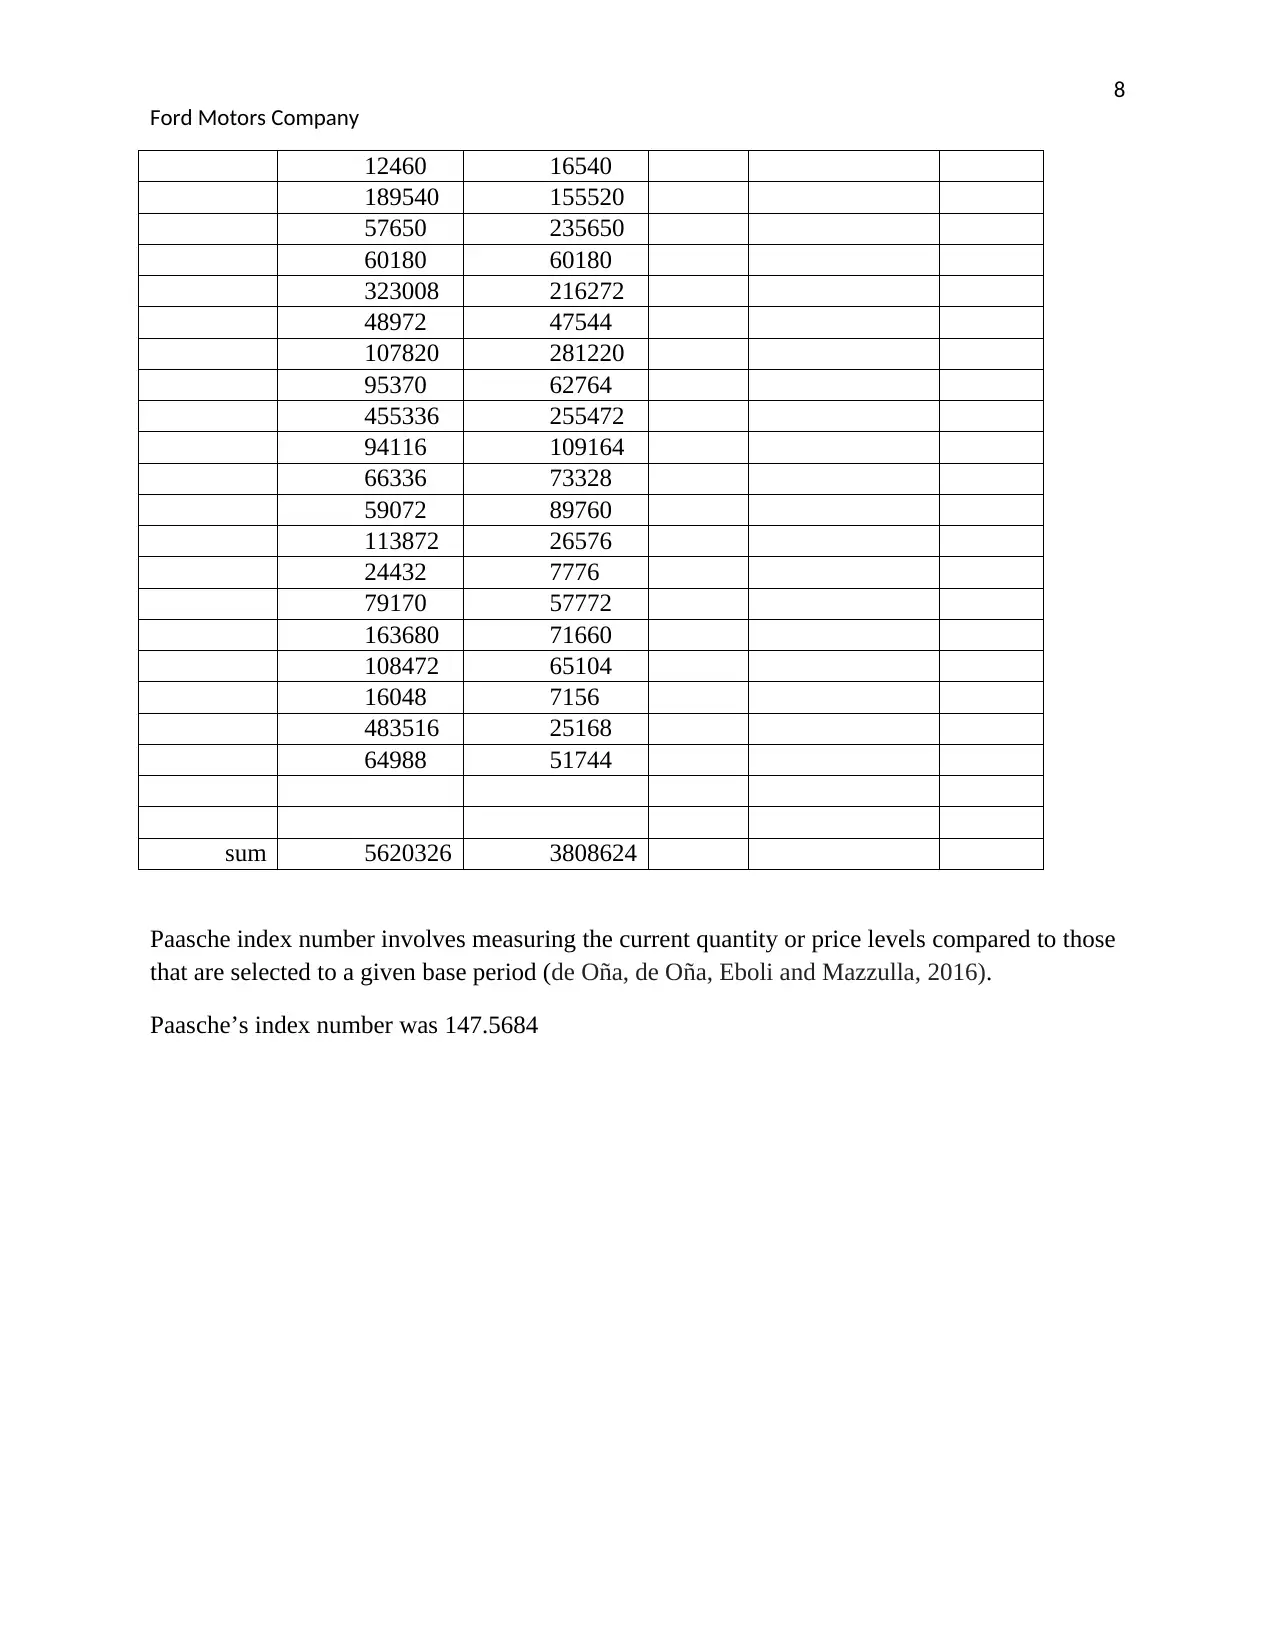
This report provides a comprehensive analysis of Ford Motors Company, focusing on its sales, revenue, market share, and organizational culture. It begins with an introduction to Ford, highlighting its history, products, and global presence. The report then delves into the company's market and market share, examining sales data and revenue figures from 2012 and 2014. Statistical analysis, including the calculation of mean, median, and index numbers (Laspeyre's and Paasche's), is performed to evaluate the company's financial performance. Furthermore, the report discusses Ford's organizational culture, emphasizing its values, employee inclusion, and leadership programs. The analysis concludes that Ford's revenue increased from 2012 to 2014, and the report suggests maintaining or developing the strategies used in 2014 to achieve the company's objectives. Desklib provides access to similar reports and solved assignments for students.

1
Ford Motors Company
Ford Motors Company
First name Last name
Institution
Ford Motors Company
Ford Motors Company
First name Last name
Institution
Paraphrase This Document
Need a fresh take? Get an instant paraphrase of this document with our AI Paraphraser

2
Ford Motors Company
Introduction
Ford motors headquarter is located in Dearborn, its sole responsibility is to manufacture and
distribute automobiles. The company is one of the leading automobile manufacturers in the
United State of America. The founder of this company was Henry Ford, whose first model was
known as T- model back and was introduced to the market in 1908. Ford motors were classified
as the second biggest automaker in US and fifth largest company in the world according to 2010
vehicle sales reports. The company has 65 branches worldwide and employed more than 171,000
employees; in addition its brands include Lincoln and Ford (Wee and Wu, 2009)
Product and Services
The company has ability to sell a wide range of Ford marque types of automobiles worldwide,
with a variety of range luxurious Lincoln marque automobiles in US. The products produced by
Ford could be traced back from 1908. The market of North America in 1970s experienced the
use of an F-series type of Ford as light base trucks. The earlier history of Ford Company
indicates that the company was involved in manufacturing complete buses, but currently the
company involves too in providing financial services.
Market and Market Share
Ford motors have a worldwide spread market that covers across Europe, North America, South
America, Asia Pacific and Middle East. The percentage sell of Ford in U.S was about 14.3% in
2011 when compared to 2010 (Sturgeon and Van Biesebroeck, 2011). Ford shares was about
16.5% in 2011 and this was about 0.1% more than the value recorded in 2010 and an equivalence
of about 2.3 points above the value in 2008 (Forte and Pena, 2009).
Sales and Revenue
The value of revenue recorded in 2012 was stronger, since the company achieved 14 quarters of
profit and a positive net income. The revenue recorded was about $6.3 billion before taxation
from the automobile sector. At the end of 2012 financial year Ford credit was about 5,200
Lincoln and Ford dealers. The reported revenue achieved from Ford credit was about $2.4 billion
before taxation (Hiraide and Chakraborty, 2012).
Organization culture
The culture value of Ford motor defines its personality and characteristic. This was achieved
through supporting participative culture and open system of communication. The company holds
a strong culture with its key values widely shared. The company has been encouraging;
Inclusion for its success through creation of new product by its employees
Orientation: Since the company unveils adaptive products, the managers have the
responsibility to orient their clients, employees and stock holders on this products

3
Ford Motors Company
The role that employees play in Ford Company was treated with high esteem and always
encouraged.
Ford employees opinions were always listened to and organization always given them
chance to address their opinion for consideration.
The company motivates its future leaders through running a leadership program that is
able to reach to its 2000 managers across the globe.
Aggressiveness: The implementation of employees plan enhances competitiveness among
the employees. This was achieved by identifying and promoting factors that would
motivate the employees, like taking top performers to seminars and training program to
further enhance their skills.
The company encourages all the aspects that emphasize the essentials of working together to
achieve a strong and effective leadership. Although there are many different department all are
coordinated to work on achieving a common goal of better and efficient leadership throughout
the globe.
Ford Company has been trying on its level best to provide quality services and products even if it
would consume the profit achieved.
The views laid down by employees were frequently valued and launched for exhibition of new
products that depicts a high innovative degree.
⊘ This is a preview!⊘
Do you want full access?
Subscribe today to unlock all pages.

Trusted by 1+ million students worldwide

4
Ford Motors Company
Data
The data below shows the number of vehicle sold to the customer, the customers who were sold
the vehicle, the price of vehicles in the year 2012 and the price of vehicles in the year 2014.
1. Mean
NUMBER OF
PRODUCT
CUSTOMER AMOUNT
[2012]
AMOUNT
[2014]
14 Fabrikam, Inc. $1,886.00 $6,728.00
23 Alpine Ski House $4,022.00 $6,444.00
18 Coho Winery $8,144.00 $15,168.00
10 Southridge Video $8,002.00 $15,168.00
7 Coho Winery $6,392.00 $28,406.00
1 Contoso, Ltd $6,444.00 $8,888.00
27 Southridge Video $2,772.00 $5,872.00
30 City Power & Light $8,674.00 $7,930.00
16 A. Datum
Corporation
$2,332.00 $5,716.00
21 Alpine Ski House $5,370.00 $29,550.00
6 City Power & Light $1,768.00 $1,270.00
24 Coho Winery $5,474.00 $7,100.00
28 Fabrikam, Inc. $3,494.00 $4,444.00
22 City Power & Light $1,484.00 $5,008.00
6 Humongous
Insurance
$5,454.00 $6,212.00
15 City Power & Light $2,306.00 $5,516.00
9 A. Datum
Corporation
$8,652.00 $18,896.00
16 Alpine Ski House $3,594.00 $3,696.00
28 City Power & Light $9,130.00 $7,084.00
28 Southridge Video $9,986.00 $1,886.00
2 Fabrikam, Inc. $8,270.00 $6,230.00
30 A. Datum
Corporation
$5,184.00 $6,318.00
25 Contoso, Ltd $9,426.00 $2,306.00
15 Humongous
Insurance
$4,012.00 $4,012.00
28 Coho Winery $7,724.00 $11,536.00
21 Northwind Traders $2,264.00 $2,332.00
30 Coho Winery $9,374.00 $3,594.00
17 Humongous
Insurance
$3,692.00 $5,610.00
28 Humongous $9,124.00 $16,262.00
Paraphrase This Document
Need a fresh take? Get an instant paraphrase of this document with our AI Paraphraser

5
Ford Motors Company
Insurance
22 Humongous
Insurance
$4,962.00 $4,278.00
8 A. Datum
Corporation
$9,166.00 $8,292.00
16 Coho Winery $5,610.00 $3,692.00
8 City Power & Light $3,322.00 $14,234.00
3 Humongous
Insurance
$2,592.00 $8,144.00
13 Contoso, Ltd $4,444.00 $6,090.00
10 Southridge Video $7,166.00 $16,368.00
13 Fabrikam, Inc. $5,008.00 $8,344.00
2 Contoso, Ltd $3,578.00 $8,024.00
22 Southridge Video $1,144.00 $21,978.00
14 Alpine Ski House $3,696.00 $4,642.00
Mean $5,378.45 $8,831.70
Median $5,096.00 $6,381.00
The mean was determined using Microsoft excel by dividing the sum of the total cost by the total
frequency.
The mean value of the sales of the vehicle in 2012 was $5,374.45, while the value in the year
2014 was $8,831.70.
2. Median
The median of a sample data refers to the value of the center most part of the entire variables
provided after arrange all the sample data in ascending order.
The median value of the sales of the vehicle in 2012 was $5,096.00 while the value in the year
2014 was $6,381.00.

6
Ford Motors Company
3. Index numbers
a) Laspeyre’s
P1*Q1 P2*Q1
26404 $94,192.00
92506 $148,212.00
146592 $273,024.00
80020 $151,680.00
44744 $198,842.00
6444 $8,888.00
74844 $158,544.00
260220 $237,900.00
37312 $91,456.00
112770 $620,550.00
10608 $7,620.00
131376 $170,400.00
97832 $124,432.00
32648 $110,176.00
32724 $37,272.00
34590 $82,740.00
77868 $170,064.00
57504 $59,136.00
255640 $198,352.00
279608 $52,808.00
16540 $12,460.00
155520 $189,540.00
235650 $57,650.00
60180 $60,180.00
216272 $323,008.00
47544 $48,972.00
281220 $107,820.00
62764 $95,370.00
255472 $455,336.00
109164 $94,116.00
73328 $66,336.00
89760 $59,072.00
26576 $113,872.00
7776 $24,432.00
57772 $79,170.00
71660 $163,680.00
65104 $108,472.00
⊘ This is a preview!⊘
Do you want full access?
Subscribe today to unlock all pages.

Trusted by 1+ million students worldwide

7
Ford Motors Company
7156 $16,048.00
25168 $483,516.00
51744 $64,988.00
Sum 380862
4
$5,620,326.00
100 147.5684132
Laspeyre’s index number involves measuring the quantities, rice and other units over a period of
time, which are weighted in accordance with valued and a given base period (De Boer, 2009)
Laspeyre’s index in 2012 was 100, while Laspeyre’s index in 2014 was 147.5684132.
b) Paasche’s
P2*Q P1*Q Index 2014
94192 26404
148212 92506 147.5684
273024 146592
151680 80020
198842 44744
8888 6444
158544 74844
237900 260220
91456 37312
620550 112770
7620 10608
170400 131376
124432 97832
110176 32648
37272 32724
82740 34590
170064 77868
59136 57504
198352 255640
52808 279608
Paraphrase This Document
Need a fresh take? Get an instant paraphrase of this document with our AI Paraphraser

8
Ford Motors Company
12460 16540
189540 155520
57650 235650
60180 60180
323008 216272
48972 47544
107820 281220
95370 62764
455336 255472
94116 109164
66336 73328
59072 89760
113872 26576
24432 7776
79170 57772
163680 71660
108472 65104
16048 7156
483516 25168
64988 51744
sum 5620326 3808624
Paasche index number involves measuring the current quantity or price levels compared to those
that are selected to a given base period (de Oña, de Oña, Eboli and Mazzulla, 2016).
Paasche’s index number was 147.5684

9
Ford Motors Company
Analysis
The mean value of the sales of the vehicle in 2012 was $5,374.45, while the value in the year
2014 was $8,831.70. This was a clear indication that the revenue released in 2014 was higher
compared to that recorded in 2014.
The median value of the sales of the vehicle in 2012 was $5,096.00 while the value in the year
2014 was $6,381.00. This showed that the separation of higher half and lower half by the median
in 2014 was higher than that of 2012; this was as a result of greater revenues that were realized
in 2014.
The Laspeyre’s that was determined in Microsoft excel involved dividing the sum of the product
between the price of 2014 by quantities, this was divided by sum of the product between the
price of 2012 by quantities and was equivalent to 100 in 2012 and 147.5684132 in 2014.
The Paasche’s index that was determined in Microsoft excel involved dividing the sum of the
product between the price of 2014 by quantities in the same year, this was divided by sum of the
product between the price of 2012 by quantities and was equivalent to 147.5684 in 2014.
⊘ This is a preview!⊘
Do you want full access?
Subscribe today to unlock all pages.

Trusted by 1+ million students worldwide

10
Ford Motors Company
Conclusion
The value of mean and median showed clearly that the revenue that was recorded in year 2014
was higher than that recorded in 2012. This may be used as a projector to ensure that the same
strategies that were applied in 2014 are either maintained or developed further in order to
achieve a full objective of the company.
The value of Laspeyre-s and Paasche’s showed what was supposed to be down in order to
increase the sales of the vehicles and maximize the profits.
References
Baker, C. R. (2015). Organizational change at Ford Motor Company in the face of international
financial crisis. Recherches en Sciences de Gestion, (5), 23-35.
Paraphrase This Document
Need a fresh take? Get an instant paraphrase of this document with our AI Paraphraser

11
Ford Motors Company
De Boer, P. (2009). Multiplicative decomposition and index number theory: an empirical
application of the Sato–Vartia decomposition. Economic Systems Research, 21(2), 163-
174.
de Oña, J., de Oña, R., Eboli, L., & Mazzulla, G. (2016). Index numbers for monitoring transit
service quality. Transportation Research Part A: Policy and Practice, 84, 18-30.
Forte, S., & Pena, J. I. (2009). Credit spreads: An empirical analysis on the informational content
of stocks, bonds, and CDS. Journal of Banking & Finance, 33(11), 2013-2025.
Hiraide, N., & Chakraborty, K. (2012). Surviving the global recession and the demand for auto
industry in the US–a case for ford motor company. International Journal of Economics
and Finance, 4(5), 85.
Wee, H. M., & Wu, S. (2009). Lean supply chain and its effect on product cost and quality: a
case study on Ford Motor Company. Supply Chain Management: An International
Journal, 14(5), 335-341.
Sturgeon, T. J., & Van Biesebroeck, J. (2011). Global value chains in the automotive industry: an
enhanced role for developing countries?. International Journal of Technological
Learning, Innovation and Development, 4(1-3), 181-205.
1 out of 11
Related Documents
Your All-in-One AI-Powered Toolkit for Academic Success.
+13062052269
info@desklib.com
Available 24*7 on WhatsApp / Email
Unlock your academic potential
Copyright © 2020–2025 A2Z Services. All Rights Reserved. Developed and managed by ZUCOL.


