Ford Motors Balance Sheet Analysis and Financial Performance Report

Verified

Added on  2022/09/07

|6
|670
|17
Report
AI Summary
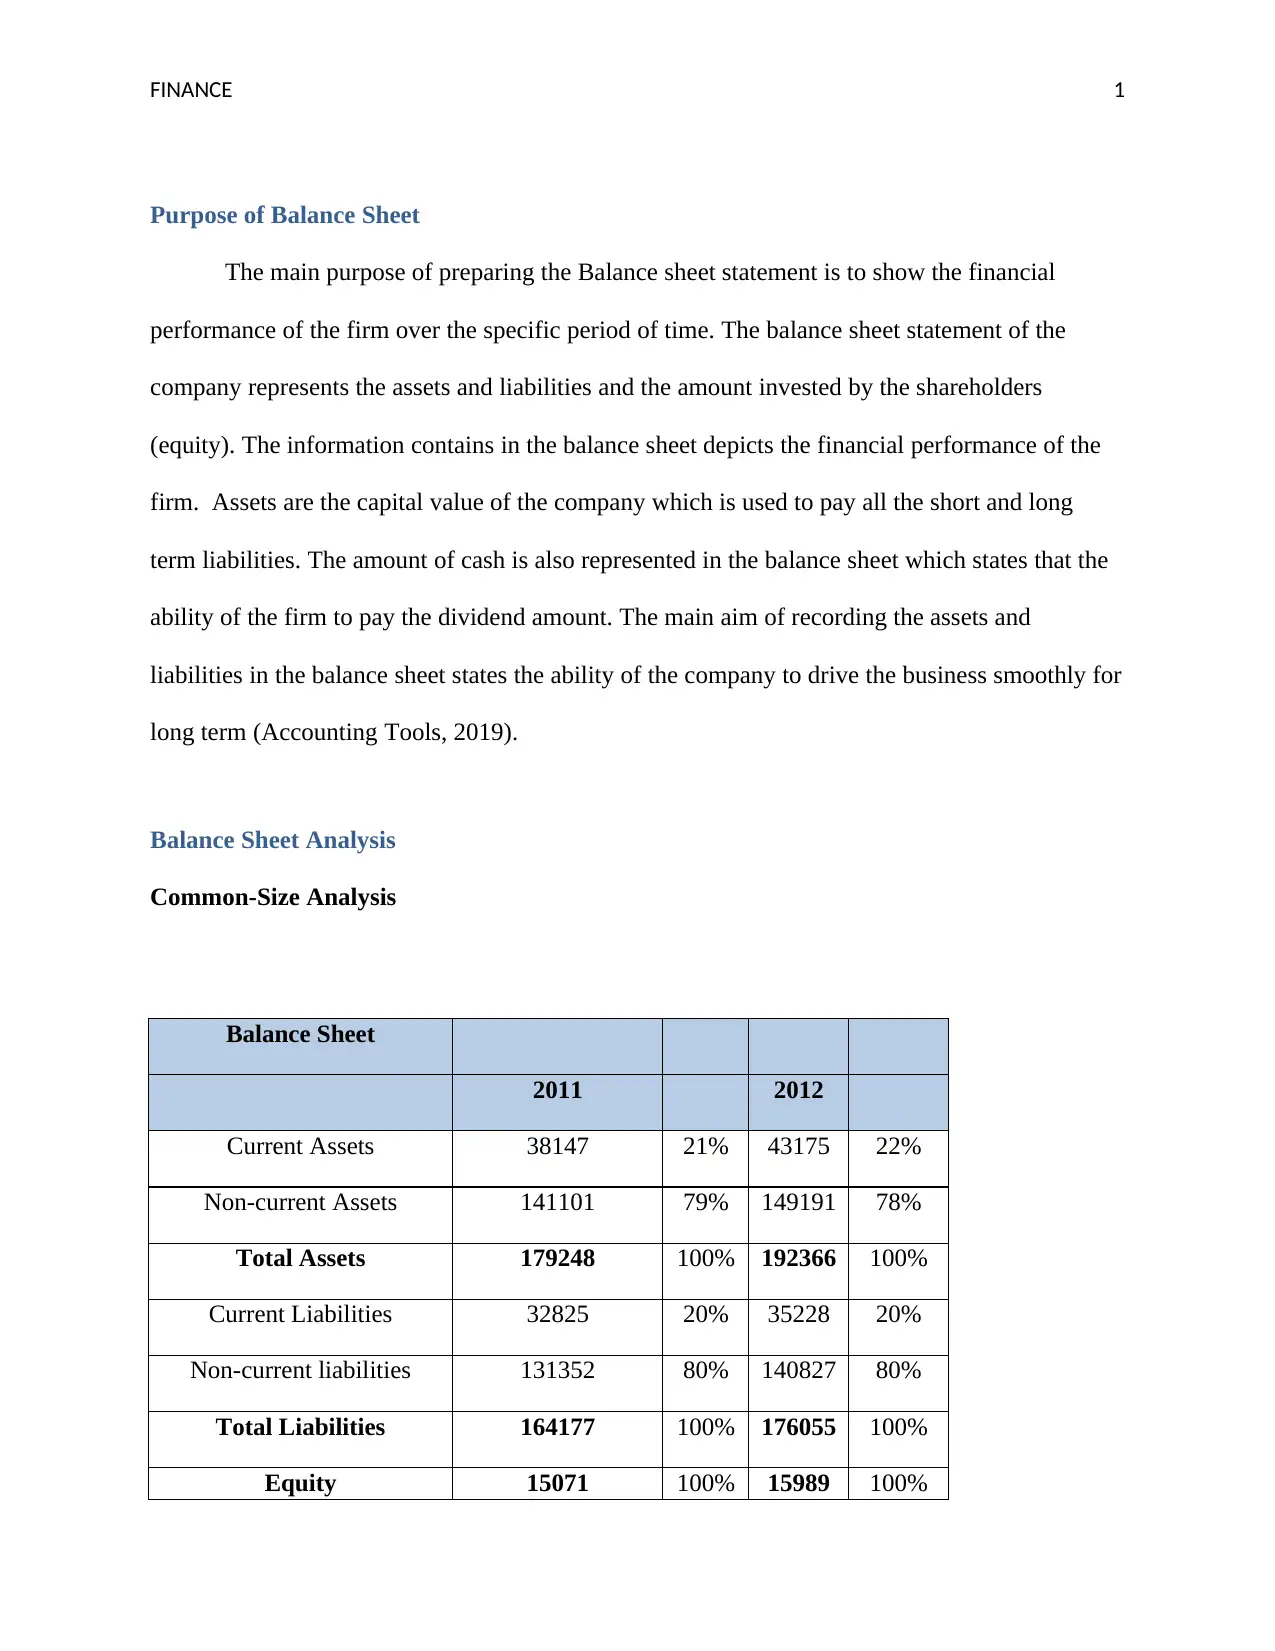
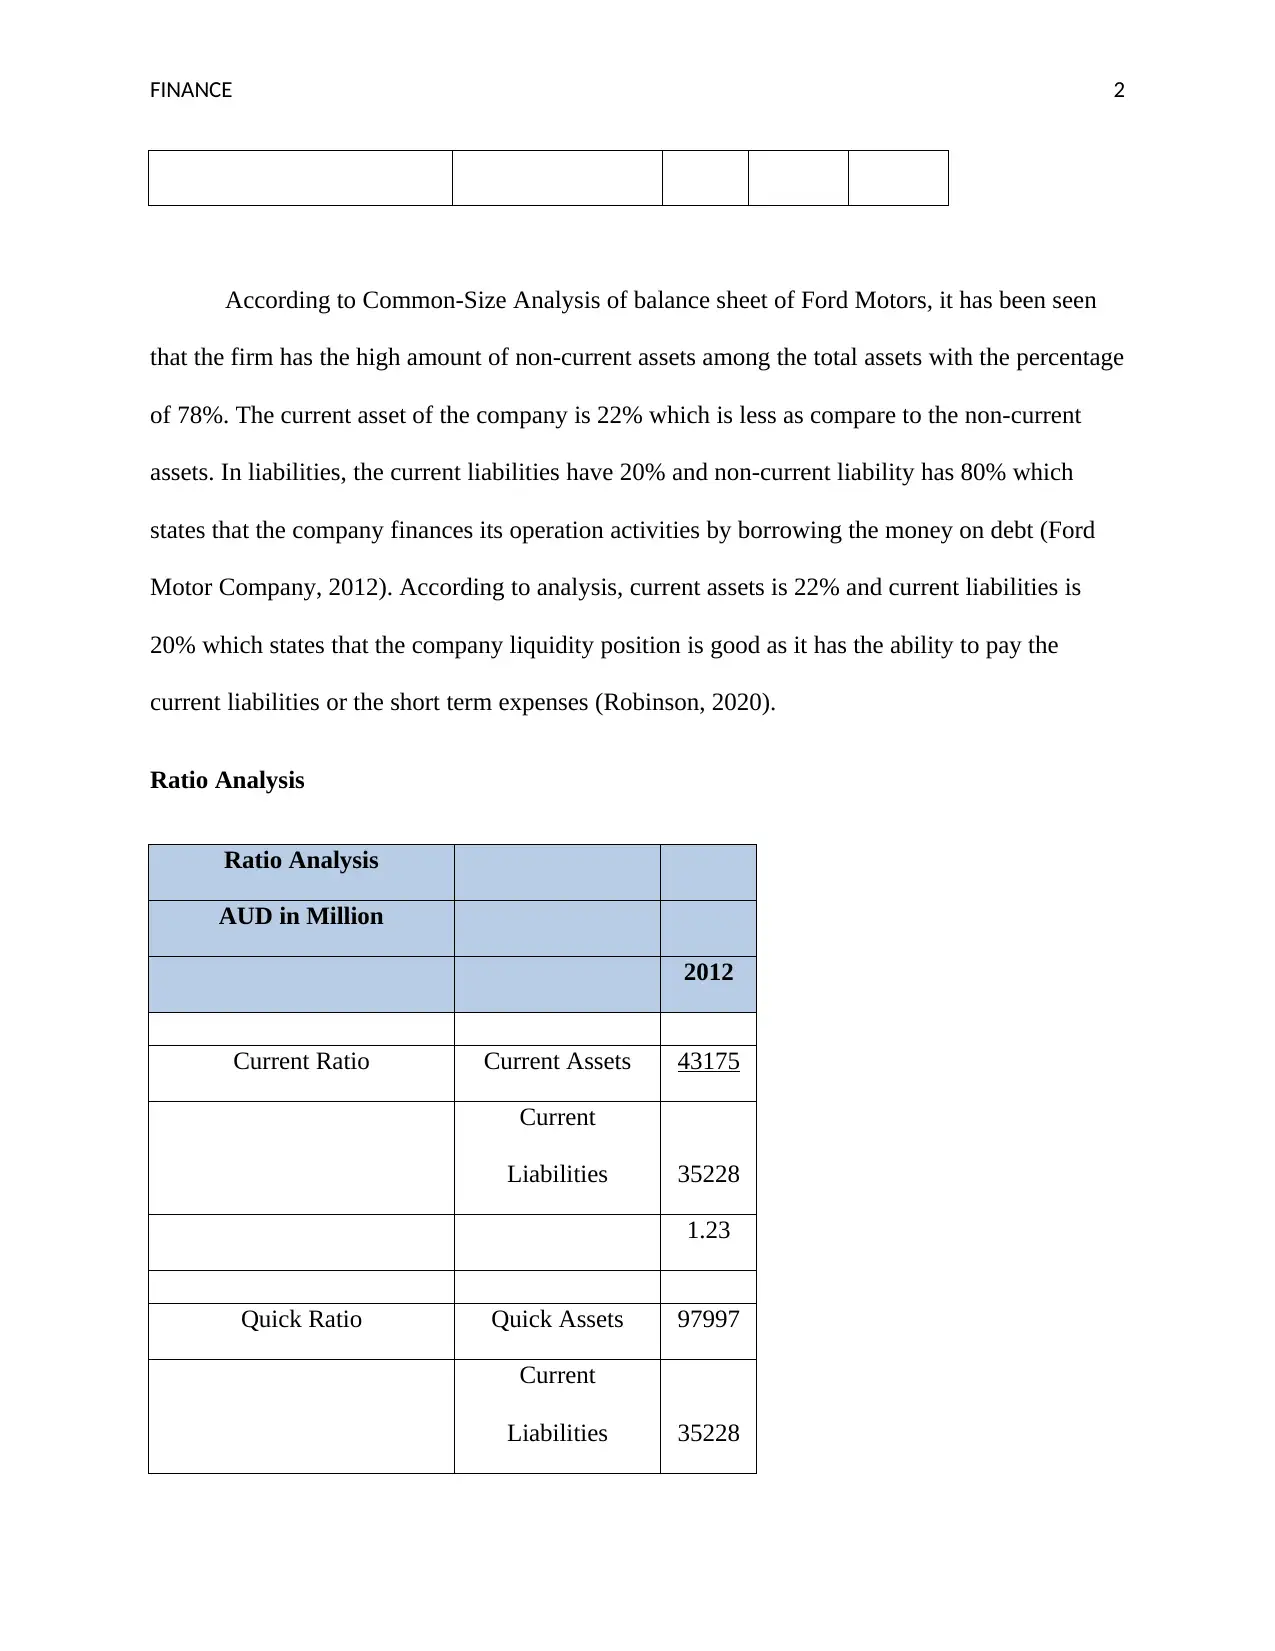
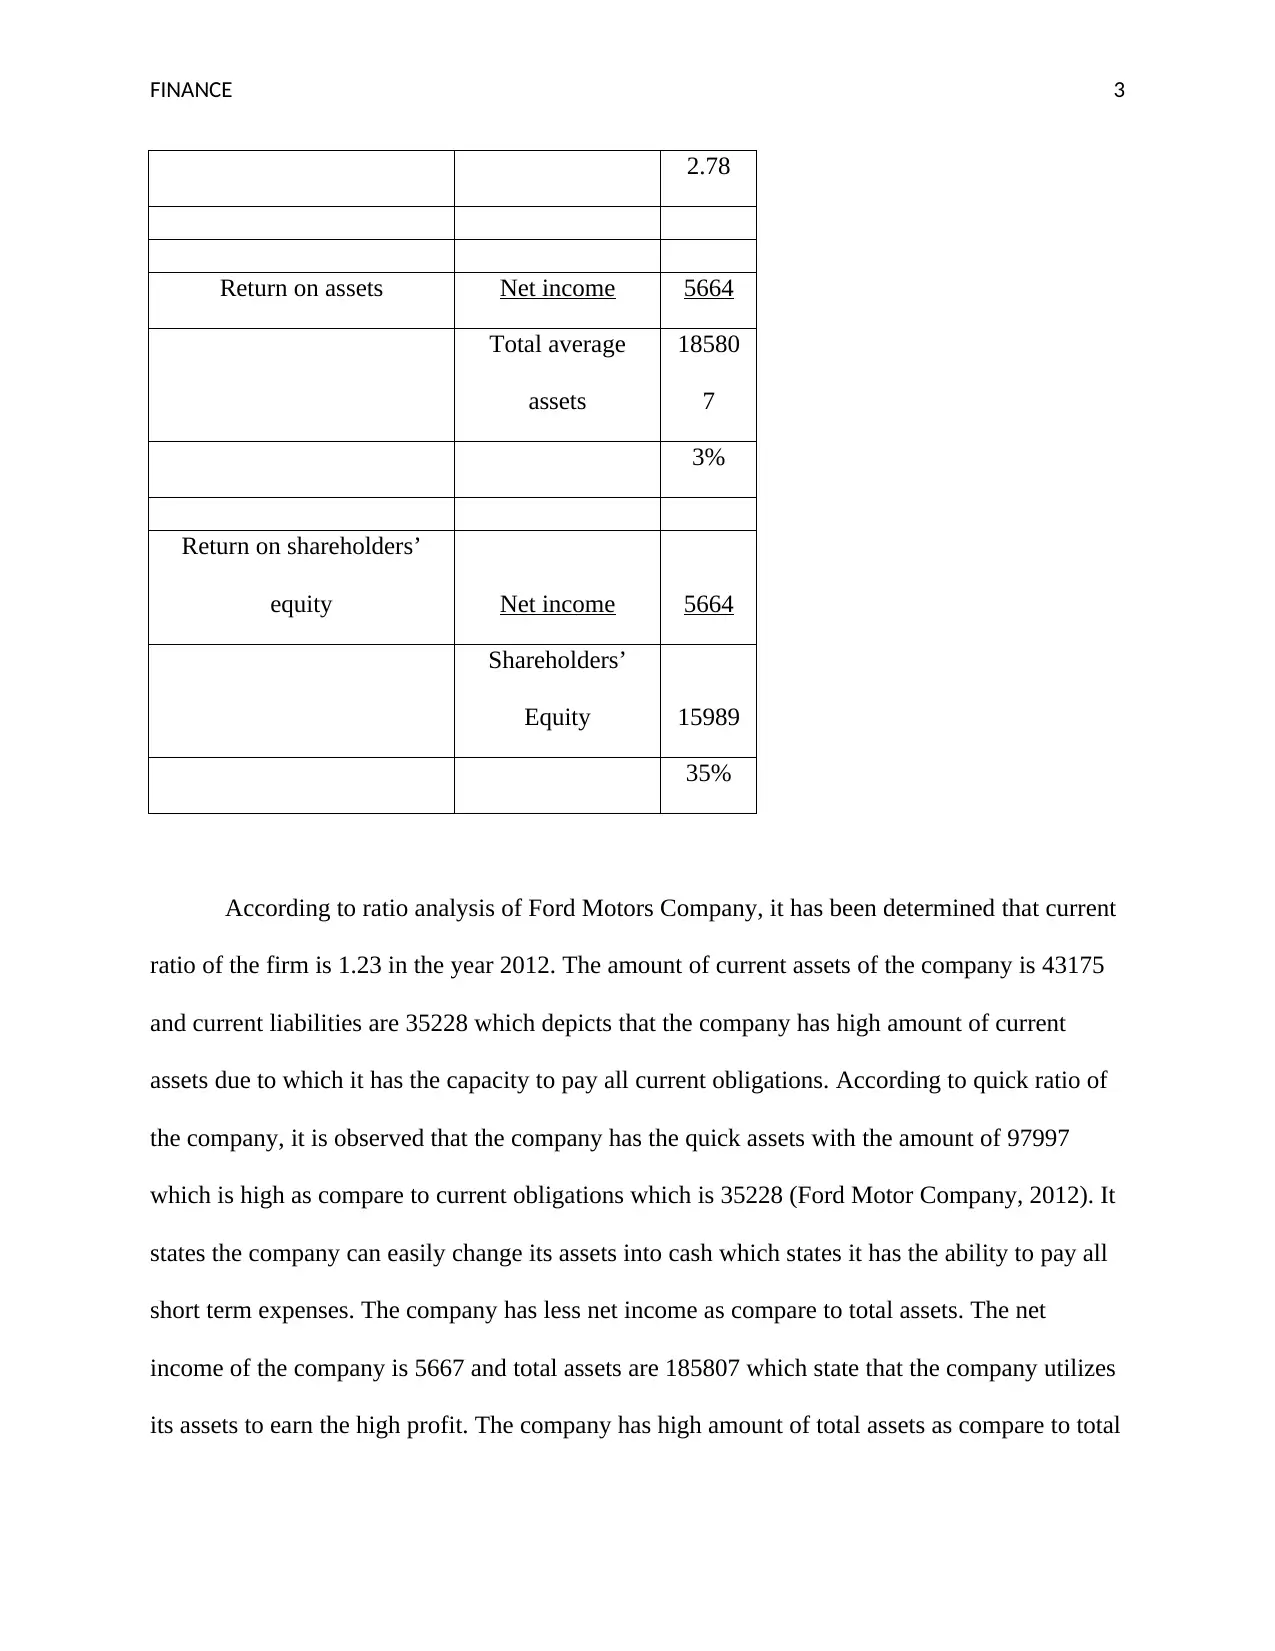
This report provides an analysis of Ford Motors' balance sheet, focusing on its financial performance. It begins by explaining the purpose of a balance sheet and its role in depicting a firm's financial health, including assets, liabilities, and equity. The report then presents a common-size analysis of Ford Motors' balance sheet from 2011 to 2012, highlighting the proportions of current and non-current assets and liabilities. Furthermore, the report includes a ratio analysis, calculating and interpreting the current ratio, quick ratio, return on assets, and return on shareholders' equity for the year 2012. These ratios provide insights into the company's liquidity, ability to convert assets to cash, and profitability. The analysis concludes that Ford Motors maintains a good liquidity position and utilizes its assets effectively, ensuring its ability to meet its financial obligations and sustain its operations. The report references relevant sources such as Accounting Tools and Ford Motor Company's annual reports to support its findings.
Document Page
Balance Sheet
tabler-icon-diamond-filled.svg

Paraphrase This Document

Need a fresh take? Get an instant paraphrase of this document with our AI Paraphraser
Document Page
FINANCE 1
Purpose of Balance Sheet
The main purpose of preparing the Balance sheet statement is to show the financial
performance of the firm over the specific period of time. The balance sheet statement of the
company represents the assets and liabilities and the amount invested by the shareholders
(equity). The information contains in the balance sheet depicts the financial performance of the
firm. Assets are the capital value of the company which is used to pay all the short and long
term liabilities. The amount of cash is also represented in the balance sheet which states that the
ability of the firm to pay the dividend amount. The main aim of recording the assets and
liabilities in the balance sheet states the ability of the company to drive the business smoothly for
long term (Accounting Tools, 2019).
Balance Sheet Analysis
Common-Size Analysis
Balance Sheet
2011 2012
Current Assets 38147 21% 43175 22%
Non-current Assets 141101 79% 149191 78%
Total Assets 179248 100% 192366 100%
Current Liabilities 32825 20% 35228 20%
Non-current liabilities 131352 80% 140827 80%
Total Liabilities 164177 100% 176055 100%
Equity 15071 100% 15989 100%
Document Page
FINANCE 2
According to Common-Size Analysis of balance sheet of Ford Motors, it has been seen
that the firm has the high amount of non-current assets among the total assets with the percentage
of 78%. The current asset of the company is 22% which is less as compare to the non-current
assets. In liabilities, the current liabilities have 20% and non-current liability has 80% which
states that the company finances its operation activities by borrowing the money on debt (Ford
Motor Company, 2012). According to analysis, current assets is 22% and current liabilities is
20% which states that the company liquidity position is good as it has the ability to pay the
current liabilities or the short term expenses (Robinson, 2020).
Ratio Analysis
Ratio Analysis
AUD in Million
2012
Current Ratio Current Assets 43175
Current
Liabilities 35228
1.23
Quick Ratio Quick Assets 97997
Current
Liabilities 35228
Document Page
FINANCE 3
2.78
Return on assets Net income 5664
Total average
assets
18580
7
3%
Return on shareholders’
equity Net income 5664
Shareholders’
Equity 15989
35%
According to ratio analysis of Ford Motors Company, it has been determined that current
ratio of the firm is 1.23 in the year 2012. The amount of current assets of the company is 43175
and current liabilities are 35228 which depicts that the company has high amount of current
assets due to which it has the capacity to pay all current obligations. According to quick ratio of
the company, it is observed that the company has the quick assets with the amount of 97997
which is high as compare to current obligations which is 35228 (Ford Motor Company, 2012). It
states the company can easily change its assets into cash which states it has the ability to pay all
short term expenses. The company has less net income as compare to total assets. The net
income of the company is 5667 and total assets are 185807 which state that the company utilizes
its assets to earn the high profit. The company has high amount of total assets as compare to total
tabler-icon-diamond-filled.svg

Paraphrase This Document

Need a fresh take? Get an instant paraphrase of this document with our AI Paraphraser
Document Page
FINANCE 4
liabilities which describes that the company can operate the business without any challenges
related to financial position in the future.
Document Page
FINANCE 5
References
Accounting Tools. (2019). The purpose of the balance sheet. Retrieved From:
https://www.accountingtools.com/articles/the-purpose-of-the-balance-sheet.html
Ford Motor Company. (2012). Ford Motor Company 2012 Annual Report. Retrieved From:
http://www.annualreports.com/HostedData/AnnualReportArchive/f/NYSE_F_201
2.pdf
Robinson, T. R. (2020). International financial statement analysis. John Wiley & Sons.
chevron_up_icon
1 out of 6
circle_padding
hide_on_mobile
zoom_out_icon
[object Object]