Ford Motors Financial Report: Ratio Analysis & Economic Impact
VerifiedAdded on 2023/06/15
|27
|7137
|312
Report
AI Summary
This report provides a financial analysis of Ford Motors, examining its performance through ratio analysis, economic environment considerations, and a long-term perspective. The analysis includes liquidity, profitability, solvency, and efficiency ratios, comparing Ford Motors to General Motors to assess its competitive position. The report finds that Ford Motors has shown improvements in some areas, such as liquidity and profitability, but needs to manage its debt and equity levels more effectively. The economic environment and investor analysis are also considered to provide a comprehensive view of the company's financial health and future prospects. Desklib provides similar solved assignments for students.
Running Head: Management accounting
1
Project Report: Management Accounting
1
Project Report: Management Accounting
Paraphrase This Document
Need a fresh take? Get an instant paraphrase of this document with our AI Paraphraser
Management accounting
2
Contents
Introduction.......................................................................................................................3
Company Overview..........................................................................................................3
Ratio analysis....................................................................................................................4
Liquidity Ratios............................................................................................................4
Profitability ratios.........................................................................................................6
Solvency Ratios............................................................................................................8
Efficiency ratios..........................................................................................................10
Economic environment consideration............................................................................12
Investor analysis.............................................................................................................13
Long term perspective....................................................................................................13
References.......................................................................................................................14
Appendix.........................................................................................................................16
Management accounting
3
Introduction:
This report has been presented to analyze the financial performance of Ford Motors.
This report depicts that how many changes have taken place into the performance and the
position of the company. Financial analysis is a study which is performed by the chief
financial officer, top level management, financial analyst and the stakeholders to analyze the
performance of the company (Schlichting, 2013). Financial analysis is a procedure which
evaluates the budgets, projects, businesses and other financial related factors of the company
to evaluate the performance and the suitability of the company. Normally, financial analysis
is a study which is used by the companies to determine the liquid, stable, solvent and
profitable position of the company (Palicka, 2011).
Financial performance of a company depicts about the strength and position of the
company as well as it also depict about the performance of the company. It evaluates the
trend, changes and the financial policies of the comapny and makes a better decision about
the investment, changes, strategies, policies etc accordingly (Madhura, 2014). More, it has
been found that it is requisite for the companies to analyze the performance to enhance the
performance in near future.
In this report, the study has been done over the ratio analysis, economic environment
consideration, and annual report of the company to analyze the performance of the company
and depict the user about the long term perspective of the company. Further, for analyzing the
performance of the company, competitor analysis has also been done so that a better decision
could be made.
Company Overview:
Ford motors are operating its business in American market. This company has
registered itself into US stock exchange. The main office of the company is in Dearborn,
Michigan, America. Ford Motors has come into existence in 1903. The main operations of
the company is manufacturing, designing and distributing the vehicles i.e. commercial
vehicles and automobile vehicles under the brand of “FORD”. Further, it has been found that
the luxurious cars are manufactured by this company and it is sold by the company under the
brand of “Lincoln” (Home, 2017). According to the current reports of automotive industry, it
has been found that around 8% of the market share is held by Ford Motors and the growth
rate of the company is also enhancing rapidly.
⊘ This is a preview!⊘
Do you want full access?
Subscribe today to unlock all pages.
Trusted by 1+ million students worldwide
Management accounting
4
For analyzing the performance of the ford Motors in a better way, competitive
analysis has also been done and for competitive analysis, General Motors has been taken into
consideration. This company is also operating its business in American market. The main
office of the company is in Dearborn, Michigan, America. General Motors has come into
existence in 1908 (Home, 2017). The main operations of the company is manufacturing,
designing and distributing the vehicles i.e. commercial vehicles and automobile vehicles.
Further, it has been found that the plants of this company are in 35 countries. According to
the current reports of automotive industry, it has been found that this company was the largest
vehicle manufacturing company worldwide.
Ratio analysis:
Firstly, for analyzing the performance of the company in a better way, the ratio
analysis study has been performed. Ratio analysis study depict the management and chief
financial officer about the liquid performance, profitability performance, solvency
performance, debt structure performance, market performance etc. (Kruth, 2013). Following
are the study of ratio analysis of Ford Motors:
Liquidity Ratios:
Liquidity ratios evaluate the ability of the company to pay debt obligation and the
margin of safety of the company by calculating the metrics which contains the quick ratio and
current ratio of a company. Current liabilities are evaluated in context to the liquid ratios to
calculate the coverage of short term debts (Krantz, 2016). These ratios are quite useful to
identify and manage the performance of the company. Further, this analysis could also be
performed through internal and external aspects. This study expresses the better result when it
is used as a comparative ratio. Further, it has been found that the liquid ratios are quite useful
for the financial management to analyze the risk and return factors of the company and
enhance the level of the working capital management.
Firstly, the study has been done over the current assets and current liabilities of the
company to analyze the performance of the company. Current ratios and quick ratios of the
company have been calculated to enhance the level of the liquid position of the company
(Kinsky, 2011). Current ratios take a concern of current assets and liabilities and depict the
user about the position of the company.
Paraphrase This Document
Need a fresh take? Get an instant paraphrase of this document with our AI Paraphraser
Management accounting
5
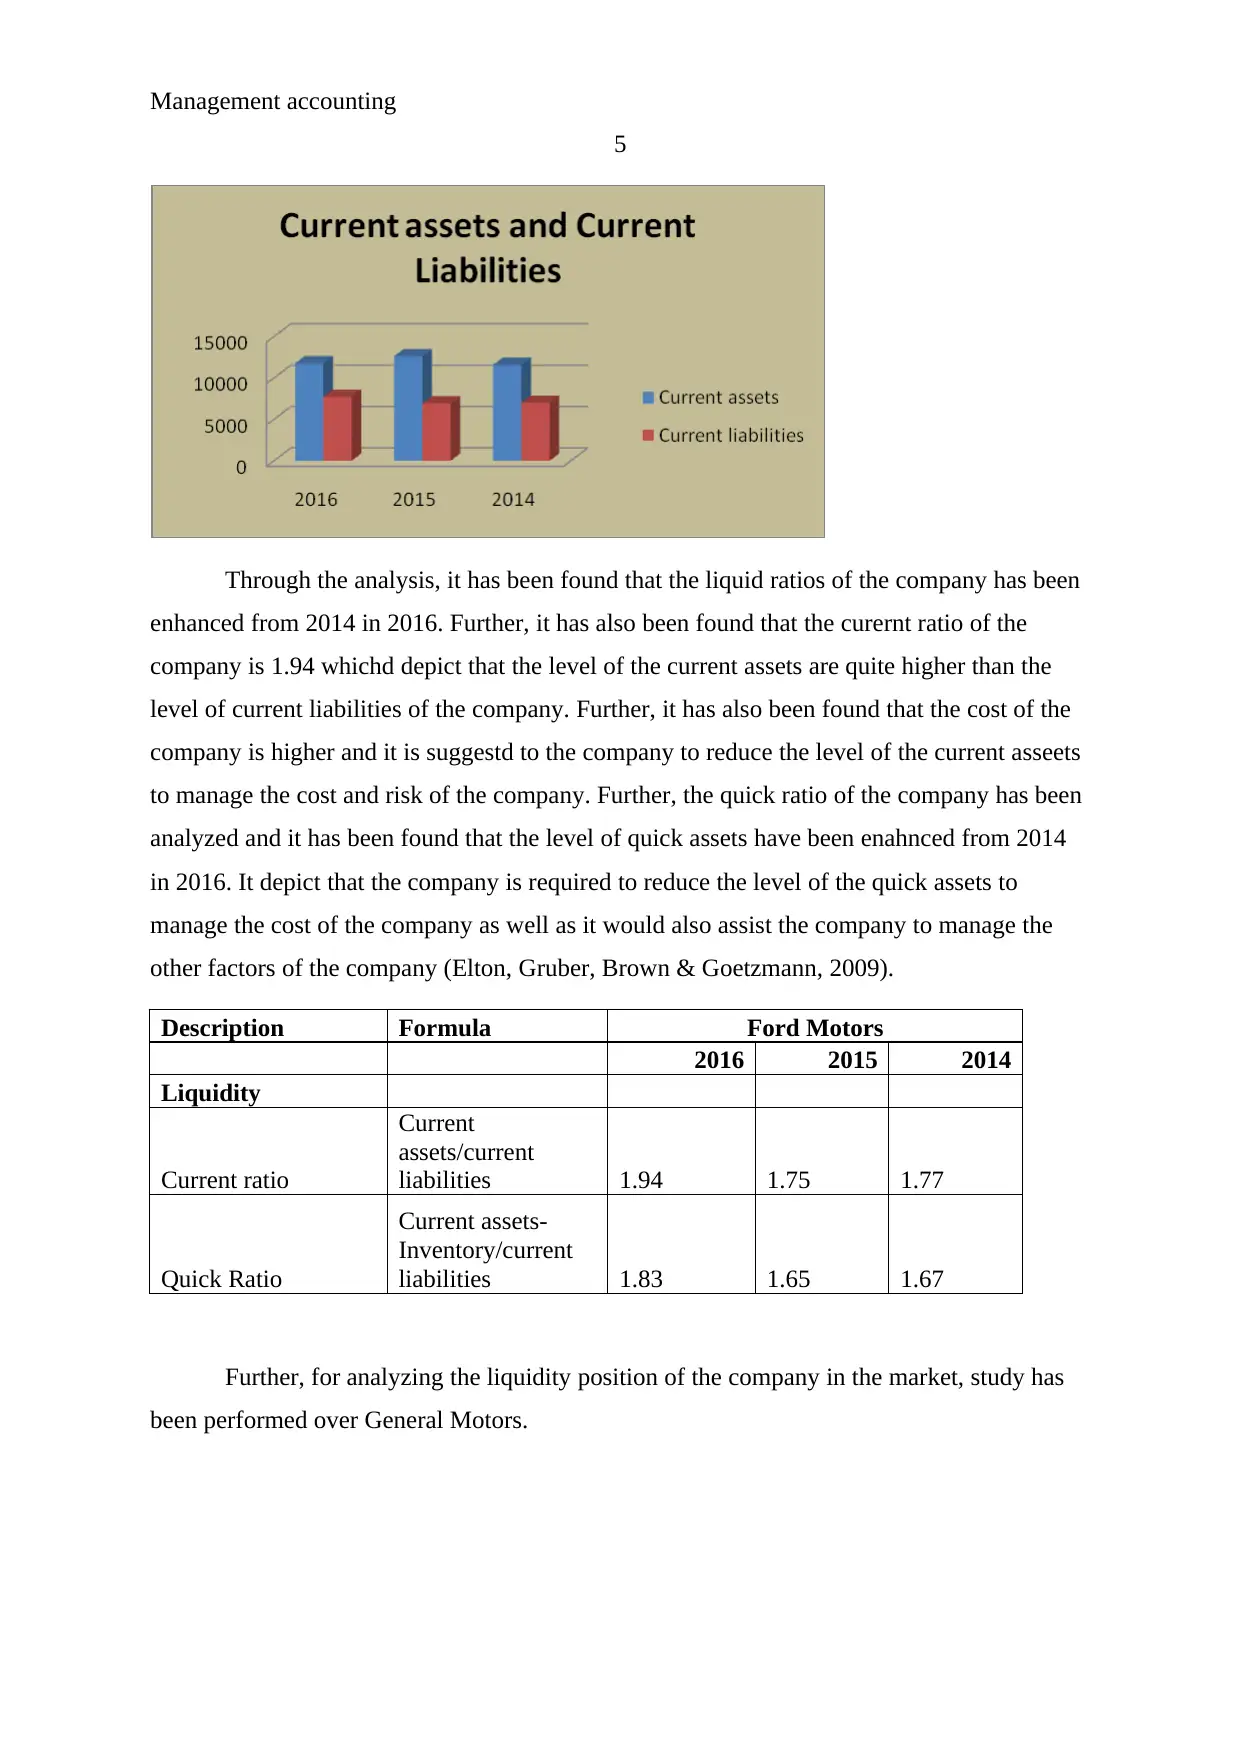
Through the analysis, it has been found that the liquid ratios of the company has been
enhanced from 2014 in 2016. Further, it has also been found that the curernt ratio of the
company is 1.94 whichd depict that the level of the current assets are quite higher than the
level of current liabilities of the company. Further, it has also been found that the cost of the
company is higher and it is suggestd to the company to reduce the level of the current asseets
to manage the cost and risk of the company. Further, the quick ratio of the company has been
analyzed and it has been found that the level of quick assets have been enahnced from 2014
in 2016. It depict that the company is required to reduce the level of the quick assets to
manage the cost of the company as well as it would also assist the company to manage the
other factors of the company (Elton, Gruber, Brown & Goetzmann, 2009).
Description Formula Ford Motors
2016 2015 2014
Liquidity
Current ratio
Current
assets/current
liabilities 1.94 1.75 1.77
Quick Ratio
Current assets-
Inventory/current
liabilities 1.83 1.65 1.67
Further, for analyzing the liquidity position of the company in the market, study has
been performed over General Motors.
5
Through the analysis, it has been found that the liquid ratios of the company has been
enhanced from 2014 in 2016. Further, it has also been found that the curernt ratio of the
company is 1.94 whichd depict that the level of the current assets are quite higher than the
level of current liabilities of the company. Further, it has also been found that the cost of the
company is higher and it is suggestd to the company to reduce the level of the current asseets
to manage the cost and risk of the company. Further, the quick ratio of the company has been
analyzed and it has been found that the level of quick assets have been enahnced from 2014
in 2016. It depict that the company is required to reduce the level of the quick assets to
manage the cost of the company as well as it would also assist the company to manage the
other factors of the company (Elton, Gruber, Brown & Goetzmann, 2009).
Description Formula Ford Motors
2016 2015 2014
Liquidity
Current ratio
Current
assets/current
liabilities 1.94 1.75 1.77
Quick Ratio
Current assets-
Inventory/current
liabilities 1.83 1.65 1.67
Further, for analyzing the liquidity position of the company in the market, study has
been performed over General Motors.
Management accounting
6
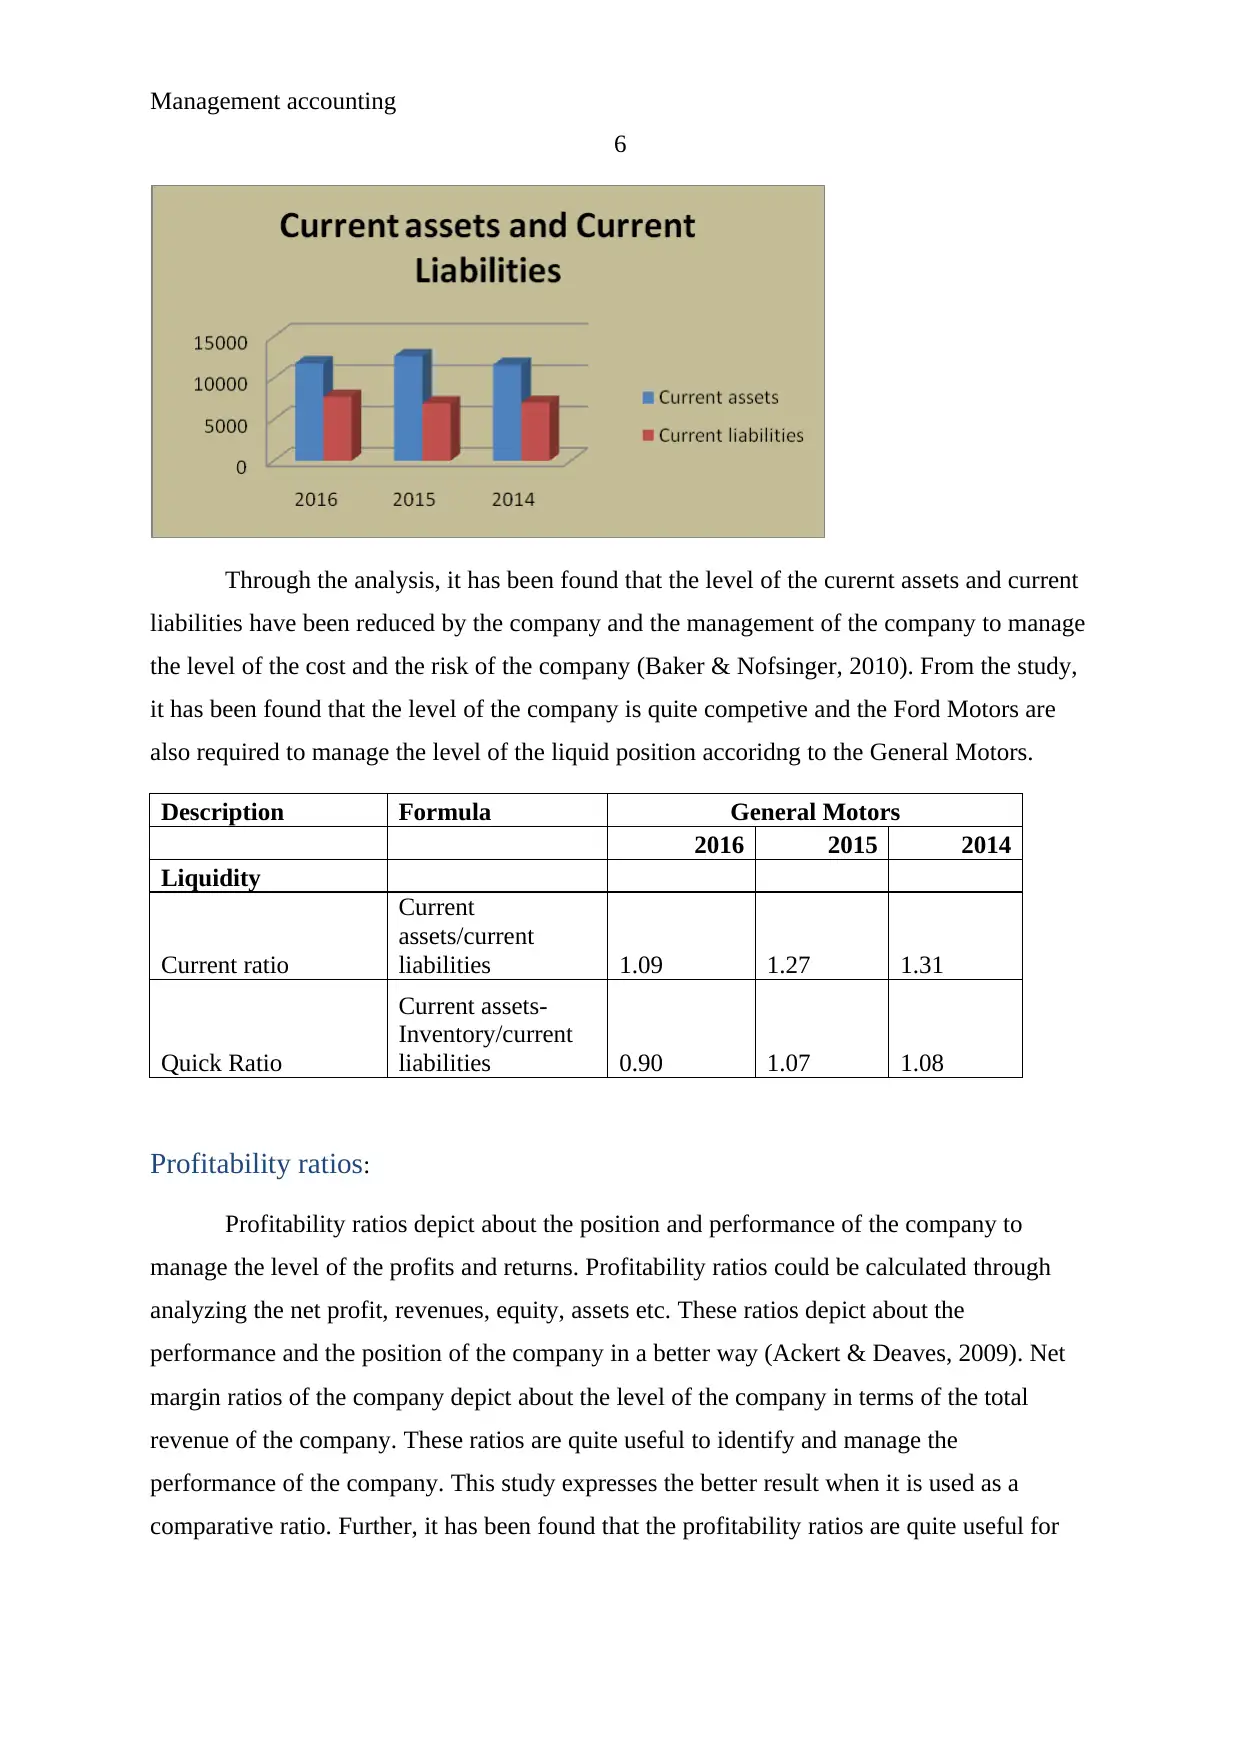
Through the analysis, it has been found that the level of the curernt assets and current
liabilities have been reduced by the company and the management of the company to manage
the level of the cost and the risk of the company (Baker & Nofsinger, 2010). From the study,
it has been found that the level of the company is quite competive and the Ford Motors are
also required to manage the level of the liquid position accoridng to the General Motors.
Description Formula General Motors
2016 2015 2014
Liquidity
Current ratio
Current
assets/current
liabilities 1.09 1.27 1.31
Quick Ratio
Current assets-
Inventory/current
liabilities 0.90 1.07 1.08
Profitability ratios:
Profitability ratios depict about the position and performance of the company to
manage the level of the profits and returns. Profitability ratios could be calculated through
analyzing the net profit, revenues, equity, assets etc. These ratios depict about the
performance and the position of the company in a better way (Ackert & Deaves, 2009). Net
margin ratios of the company depict about the level of the company in terms of the total
revenue of the company. These ratios are quite useful to identify and manage the
performance of the company. This study expresses the better result when it is used as a
comparative ratio. Further, it has been found that the profitability ratios are quite useful for
6
Through the analysis, it has been found that the level of the curernt assets and current
liabilities have been reduced by the company and the management of the company to manage
the level of the cost and the risk of the company (Baker & Nofsinger, 2010). From the study,
it has been found that the level of the company is quite competive and the Ford Motors are
also required to manage the level of the liquid position accoridng to the General Motors.
Description Formula General Motors
2016 2015 2014
Liquidity
Current ratio
Current
assets/current
liabilities 1.09 1.27 1.31
Quick Ratio
Current assets-
Inventory/current
liabilities 0.90 1.07 1.08
Profitability ratios:
Profitability ratios depict about the position and performance of the company to
manage the level of the profits and returns. Profitability ratios could be calculated through
analyzing the net profit, revenues, equity, assets etc. These ratios depict about the
performance and the position of the company in a better way (Ackert & Deaves, 2009). Net
margin ratios of the company depict about the level of the company in terms of the total
revenue of the company. These ratios are quite useful to identify and manage the
performance of the company. This study expresses the better result when it is used as a
comparative ratio. Further, it has been found that the profitability ratios are quite useful for
⊘ This is a preview!⊘
Do you want full access?
Subscribe today to unlock all pages.
Trusted by 1+ million students worldwide
Management accounting
7
the financial management to analyze the risk and return factors of the company and enhance
the level of the efficiency of the company.
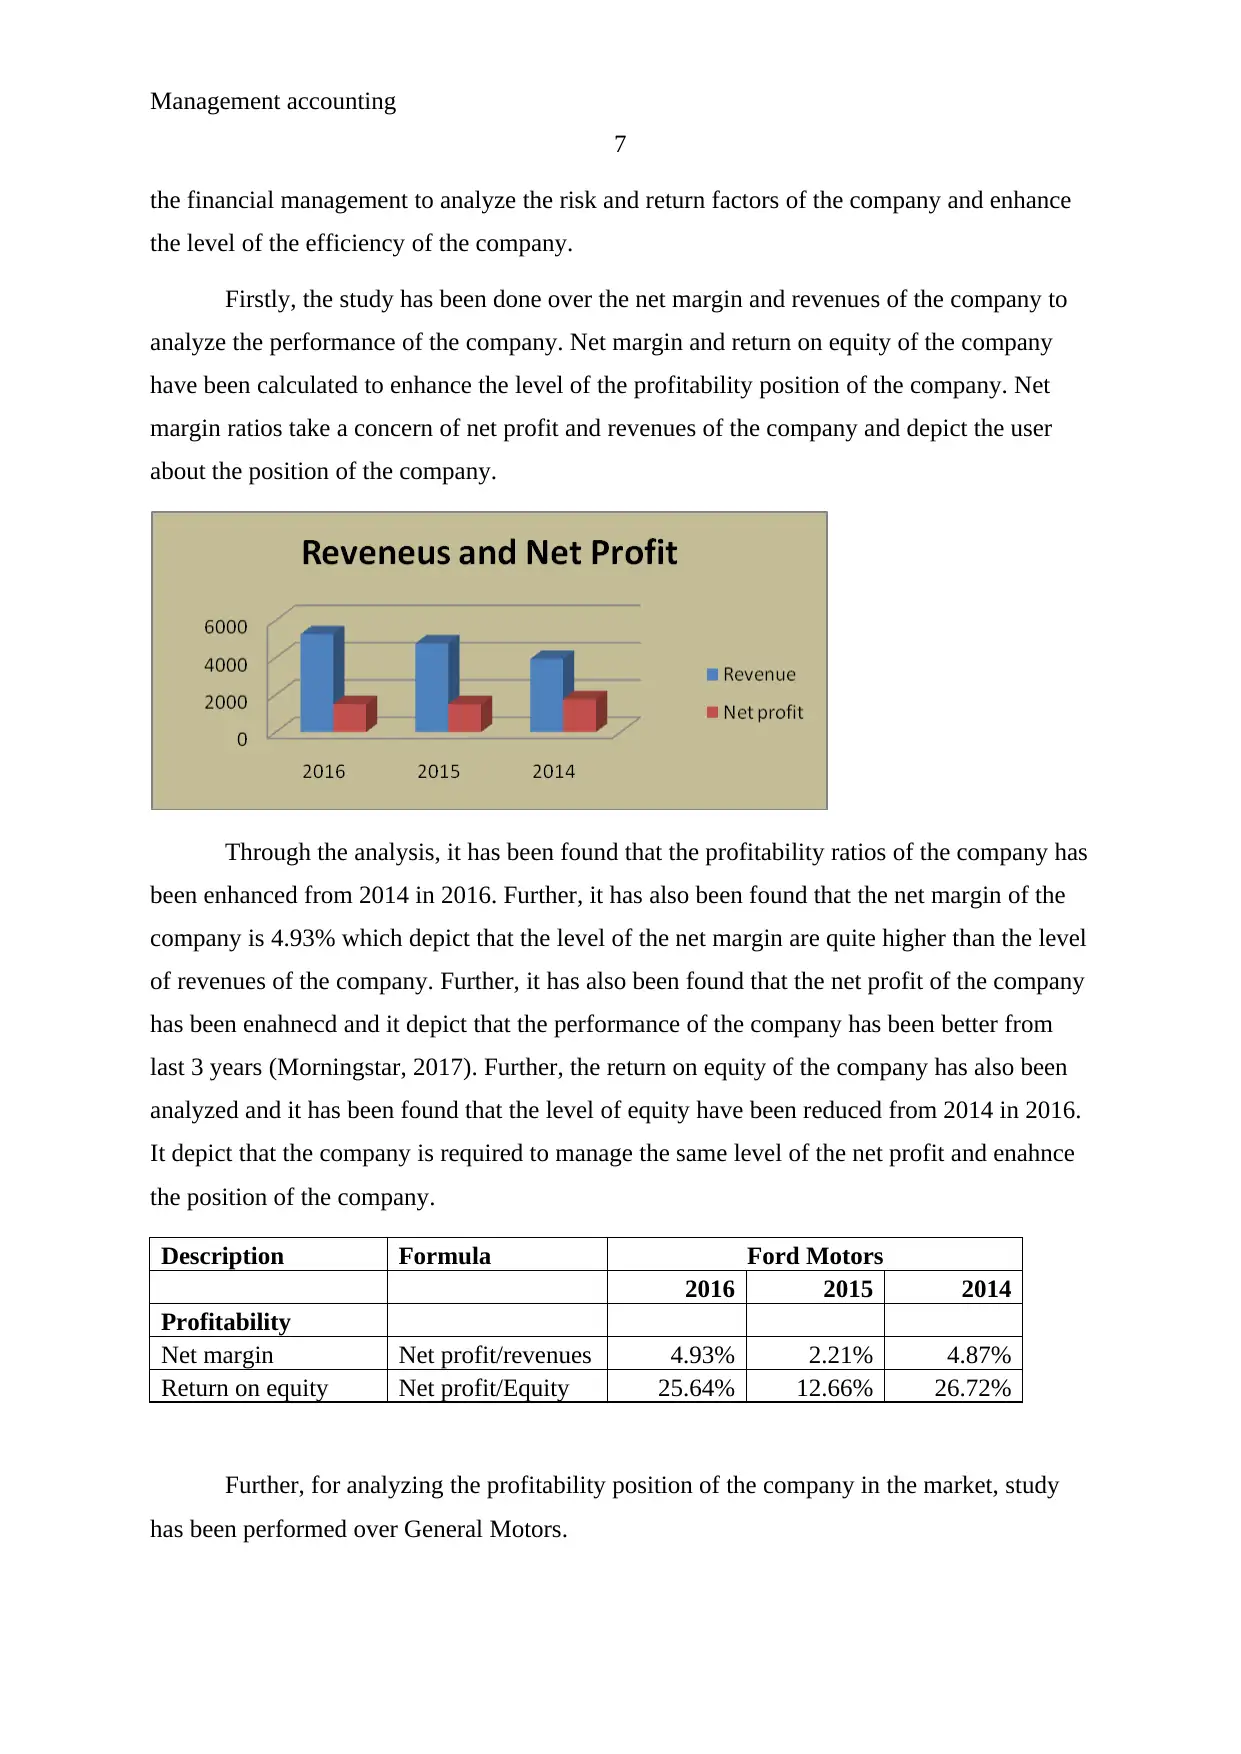
Firstly, the study has been done over the net margin and revenues of the company to
analyze the performance of the company. Net margin and return on equity of the company
have been calculated to enhance the level of the profitability position of the company. Net
margin ratios take a concern of net profit and revenues of the company and depict the user
about the position of the company.
Through the analysis, it has been found that the profitability ratios of the company has
been enhanced from 2014 in 2016. Further, it has also been found that the net margin of the
company is 4.93% which depict that the level of the net margin are quite higher than the level
of revenues of the company. Further, it has also been found that the net profit of the company
has been enahnecd and it depict that the performance of the company has been better from
last 3 years (Morningstar, 2017). Further, the return on equity of the company has also been
analyzed and it has been found that the level of equity have been reduced from 2014 in 2016.
It depict that the company is required to manage the same level of the net profit and enahnce
the position of the company.
Description Formula Ford Motors
2016 2015 2014
Profitability
Net margin Net profit/revenues 4.93% 2.21% 4.87%
Return on equity Net profit/Equity 25.64% 12.66% 26.72%
Further, for analyzing the profitability position of the company in the market, study
has been performed over General Motors.
7
the financial management to analyze the risk and return factors of the company and enhance
the level of the efficiency of the company.
Firstly, the study has been done over the net margin and revenues of the company to
analyze the performance of the company. Net margin and return on equity of the company
have been calculated to enhance the level of the profitability position of the company. Net
margin ratios take a concern of net profit and revenues of the company and depict the user
about the position of the company.
Through the analysis, it has been found that the profitability ratios of the company has
been enhanced from 2014 in 2016. Further, it has also been found that the net margin of the
company is 4.93% which depict that the level of the net margin are quite higher than the level
of revenues of the company. Further, it has also been found that the net profit of the company
has been enahnecd and it depict that the performance of the company has been better from
last 3 years (Morningstar, 2017). Further, the return on equity of the company has also been
analyzed and it has been found that the level of equity have been reduced from 2014 in 2016.
It depict that the company is required to manage the same level of the net profit and enahnce
the position of the company.
Description Formula Ford Motors
2016 2015 2014
Profitability
Net margin Net profit/revenues 4.93% 2.21% 4.87%
Return on equity Net profit/Equity 25.64% 12.66% 26.72%
Further, for analyzing the profitability position of the company in the market, study
has been performed over General Motors.
Paraphrase This Document
Need a fresh take? Get an instant paraphrase of this document with our AI Paraphraser
Management accounting
8
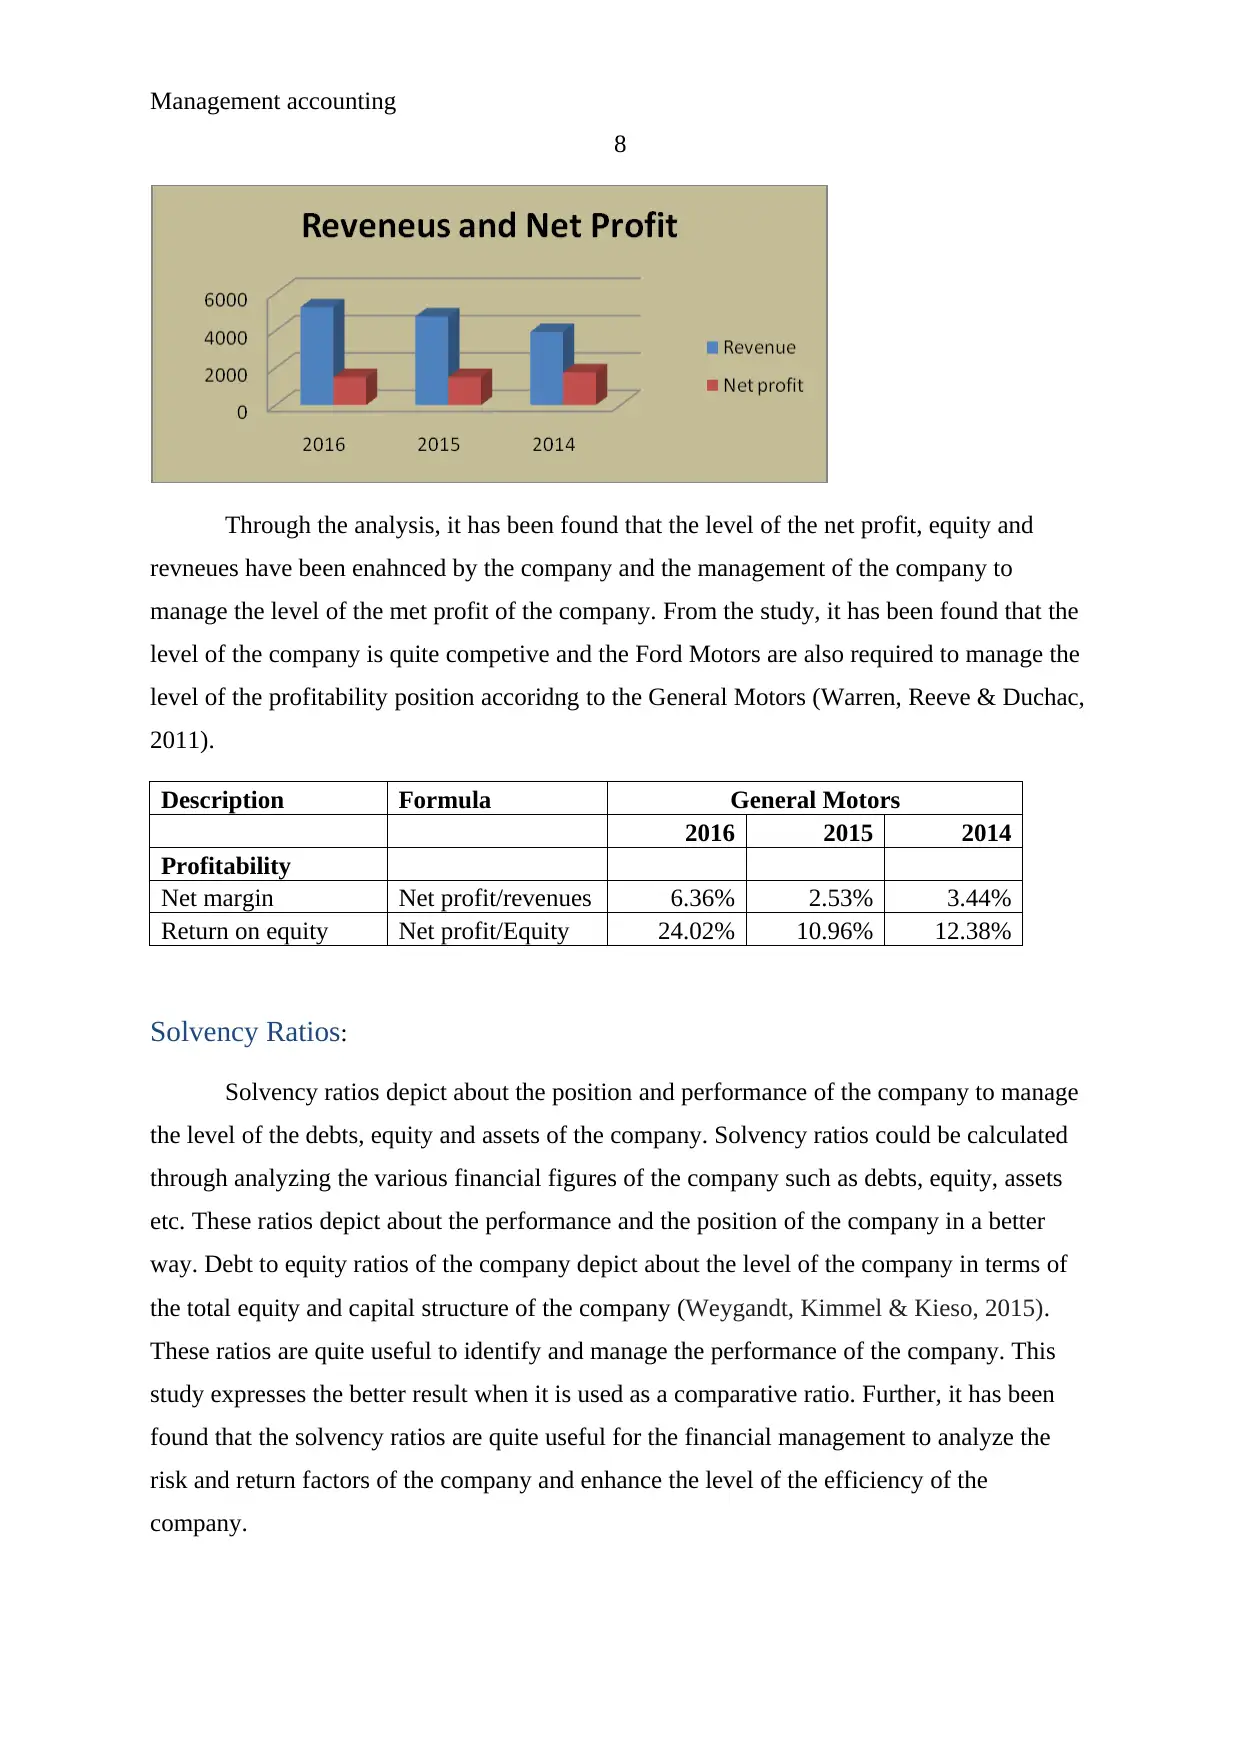
Through the analysis, it has been found that the level of the net profit, equity and
revneues have been enahnced by the company and the management of the company to
manage the level of the met profit of the company. From the study, it has been found that the
level of the company is quite competive and the Ford Motors are also required to manage the
level of the profitability position accoridng to the General Motors (Warren, Reeve & Duchac,
2011).
Description Formula General Motors
2016 2015 2014
Profitability
Net margin Net profit/revenues 6.36% 2.53% 3.44%
Return on equity Net profit/Equity 24.02% 10.96% 12.38%
Solvency Ratios:
Solvency ratios depict about the position and performance of the company to manage
the level of the debts, equity and assets of the company. Solvency ratios could be calculated
through analyzing the various financial figures of the company such as debts, equity, assets
etc. These ratios depict about the performance and the position of the company in a better
way. Debt to equity ratios of the company depict about the level of the company in terms of
the total equity and capital structure of the company (Weygandt, Kimmel & Kieso, 2015).
These ratios are quite useful to identify and manage the performance of the company. This
study expresses the better result when it is used as a comparative ratio. Further, it has been
found that the solvency ratios are quite useful for the financial management to analyze the
risk and return factors of the company and enhance the level of the efficiency of the
company.
8
Through the analysis, it has been found that the level of the net profit, equity and
revneues have been enahnced by the company and the management of the company to
manage the level of the met profit of the company. From the study, it has been found that the
level of the company is quite competive and the Ford Motors are also required to manage the
level of the profitability position accoridng to the General Motors (Warren, Reeve & Duchac,
2011).
Description Formula General Motors
2016 2015 2014
Profitability
Net margin Net profit/revenues 6.36% 2.53% 3.44%
Return on equity Net profit/Equity 24.02% 10.96% 12.38%
Solvency Ratios:
Solvency ratios depict about the position and performance of the company to manage
the level of the debts, equity and assets of the company. Solvency ratios could be calculated
through analyzing the various financial figures of the company such as debts, equity, assets
etc. These ratios depict about the performance and the position of the company in a better
way. Debt to equity ratios of the company depict about the level of the company in terms of
the total equity and capital structure of the company (Weygandt, Kimmel & Kieso, 2015).
These ratios are quite useful to identify and manage the performance of the company. This
study expresses the better result when it is used as a comparative ratio. Further, it has been
found that the solvency ratios are quite useful for the financial management to analyze the
risk and return factors of the company and enhance the level of the efficiency of the
company.
Management accounting
9
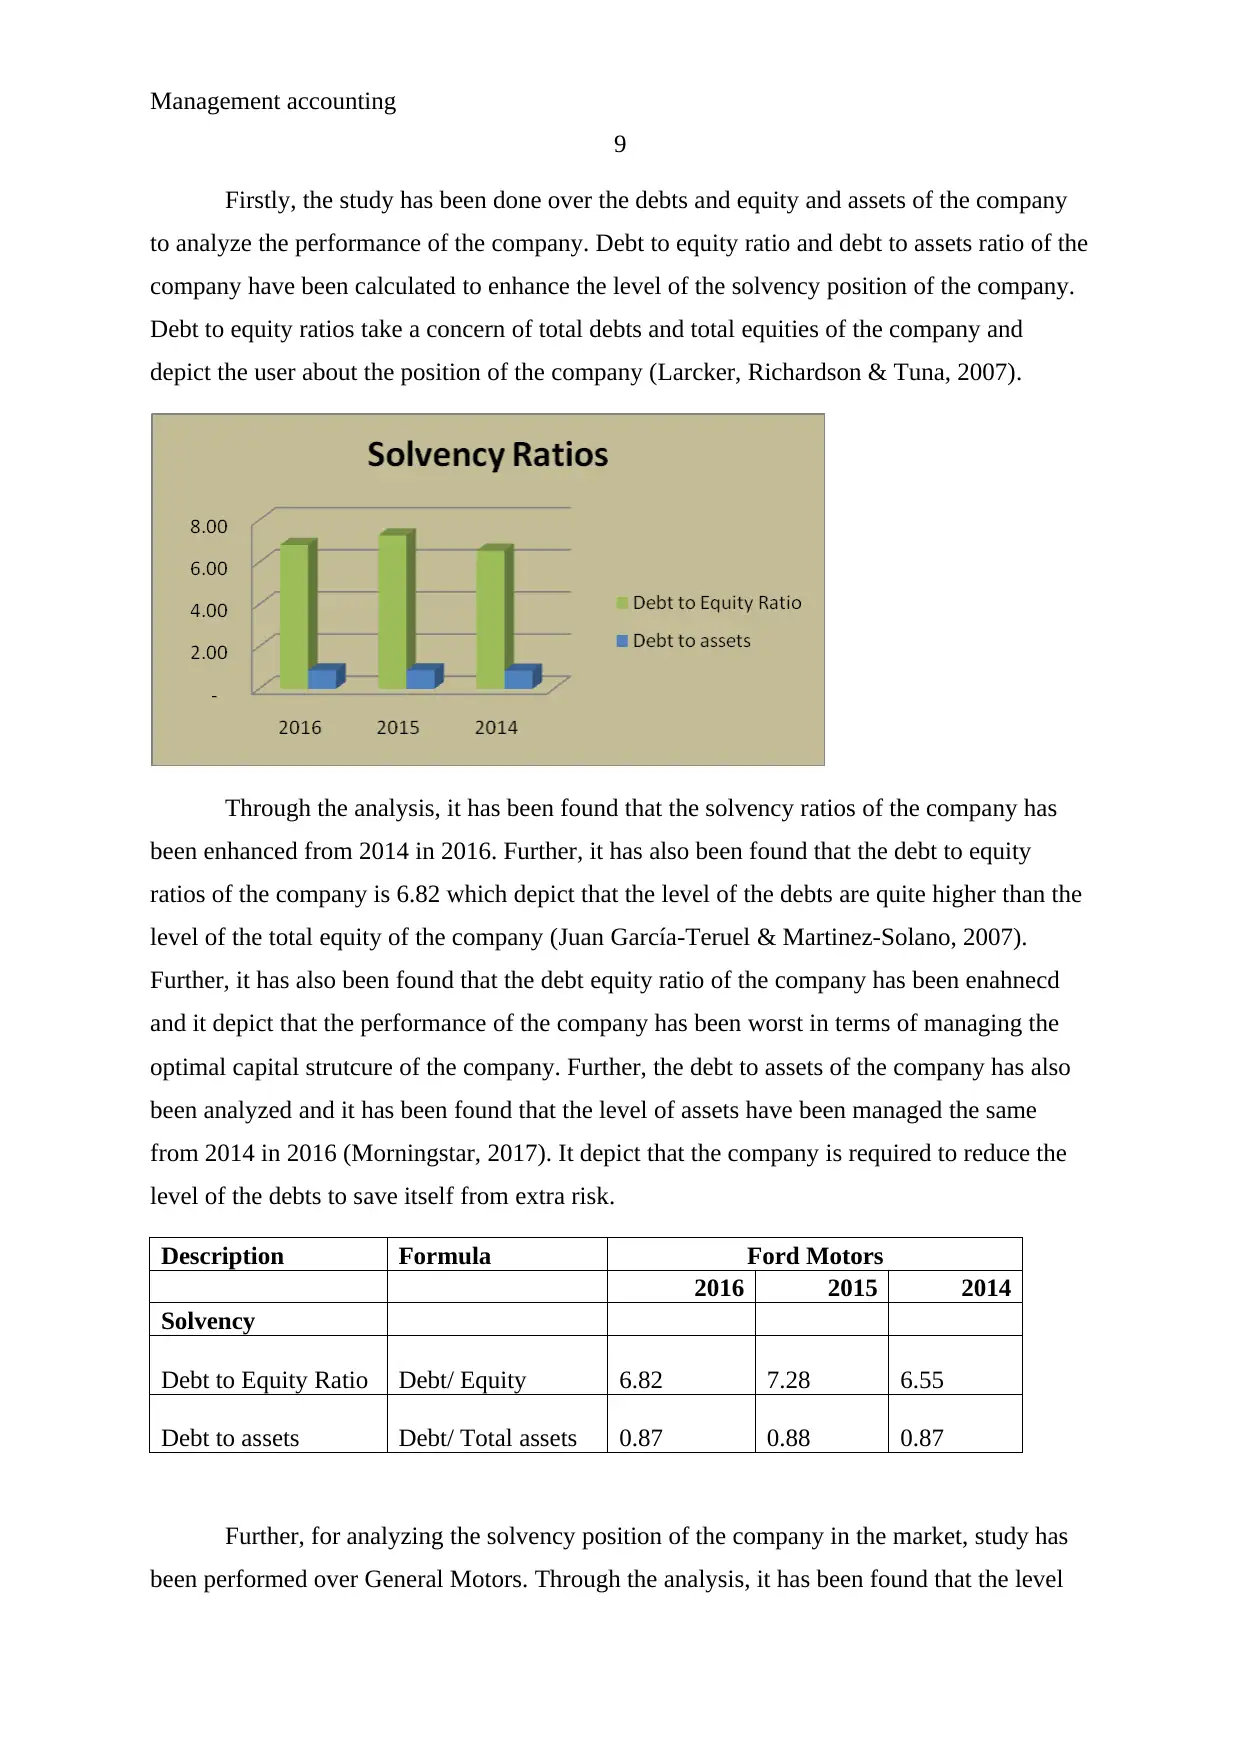
Firstly, the study has been done over the debts and equity and assets of the company
to analyze the performance of the company. Debt to equity ratio and debt to assets ratio of the
company have been calculated to enhance the level of the solvency position of the company.
Debt to equity ratios take a concern of total debts and total equities of the company and
depict the user about the position of the company (Larcker, Richardson & Tuna, 2007).
Through the analysis, it has been found that the solvency ratios of the company has
been enhanced from 2014 in 2016. Further, it has also been found that the debt to equity
ratios of the company is 6.82 which depict that the level of the debts are quite higher than the
level of the total equity of the company (Juan García-Teruel & Martinez-Solano, 2007).
Further, it has also been found that the debt equity ratio of the company has been enahnecd
and it depict that the performance of the company has been worst in terms of managing the
optimal capital strutcure of the company. Further, the debt to assets of the company has also
been analyzed and it has been found that the level of assets have been managed the same
from 2014 in 2016 (Morningstar, 2017). It depict that the company is required to reduce the
level of the debts to save itself from extra risk.
Description Formula Ford Motors
2016 2015 2014
Solvency
Debt to Equity Ratio Debt/ Equity 6.82 7.28 6.55
Debt to assets Debt/ Total assets 0.87 0.88 0.87
Further, for analyzing the solvency position of the company in the market, study has
been performed over General Motors. Through the analysis, it has been found that the level
9
Firstly, the study has been done over the debts and equity and assets of the company
to analyze the performance of the company. Debt to equity ratio and debt to assets ratio of the
company have been calculated to enhance the level of the solvency position of the company.
Debt to equity ratios take a concern of total debts and total equities of the company and
depict the user about the position of the company (Larcker, Richardson & Tuna, 2007).
Through the analysis, it has been found that the solvency ratios of the company has
been enhanced from 2014 in 2016. Further, it has also been found that the debt to equity
ratios of the company is 6.82 which depict that the level of the debts are quite higher than the
level of the total equity of the company (Juan García-Teruel & Martinez-Solano, 2007).
Further, it has also been found that the debt equity ratio of the company has been enahnecd
and it depict that the performance of the company has been worst in terms of managing the
optimal capital strutcure of the company. Further, the debt to assets of the company has also
been analyzed and it has been found that the level of assets have been managed the same
from 2014 in 2016 (Morningstar, 2017). It depict that the company is required to reduce the
level of the debts to save itself from extra risk.
Description Formula Ford Motors
2016 2015 2014
Solvency
Debt to Equity Ratio Debt/ Equity 6.82 7.28 6.55
Debt to assets Debt/ Total assets 0.87 0.88 0.87
Further, for analyzing the solvency position of the company in the market, study has
been performed over General Motors. Through the analysis, it has been found that the level
⊘ This is a preview!⊘
Do you want full access?
Subscribe today to unlock all pages.
Trusted by 1+ million students worldwide
Management accounting
10
of the total debts, total equity and total assets have been enahnced by the company and the
management of the company to manage the level of the debt and equity of the company.
From the study, it has been found that the level of the company is quite competive and the
Ford Motors are also required to manage the level of the solvency position accoridng to the
General Motors (Hoque, 2012).
Description Formula General Motors
2016 2015 2014
Solvency
Debt to Equity Ratio Debt/ Equity 3.82 3.93 2.85
Debt to assets Debt/ Total assets 0.79 0.80 0.74
Efficiency ratios:
Lastly, the study has been done over the efficiency ratios which depict about the
position and performance of the company to manage the level of the cash conversion cycle of
the company. Efficiency ratios could be calculated through analyzing the various financial
figures of the company such as total debtors, total creditors and assets of the company. These
ratios depict about the performance and the position of the company in a better way. Ratios
are quite useful to identify and manage the performance of the company. This study
expresses the better result when it is used as a comparative ratio. Further, it has been found
that the efficiency ratios are quite useful for the financial management to analyze the risk
factors of the company (Heisinger, 2009).
Firstly, the study has been done over the total debtors, total creditors and total assets
of the company. These ratios depict about the cash conversion cycle of the company. This
study helps the company to manage and identify the level of total cost and risk.
Paraphrase This Document
Need a fresh take? Get an instant paraphrase of this document with our AI Paraphraser
Management accounting
11
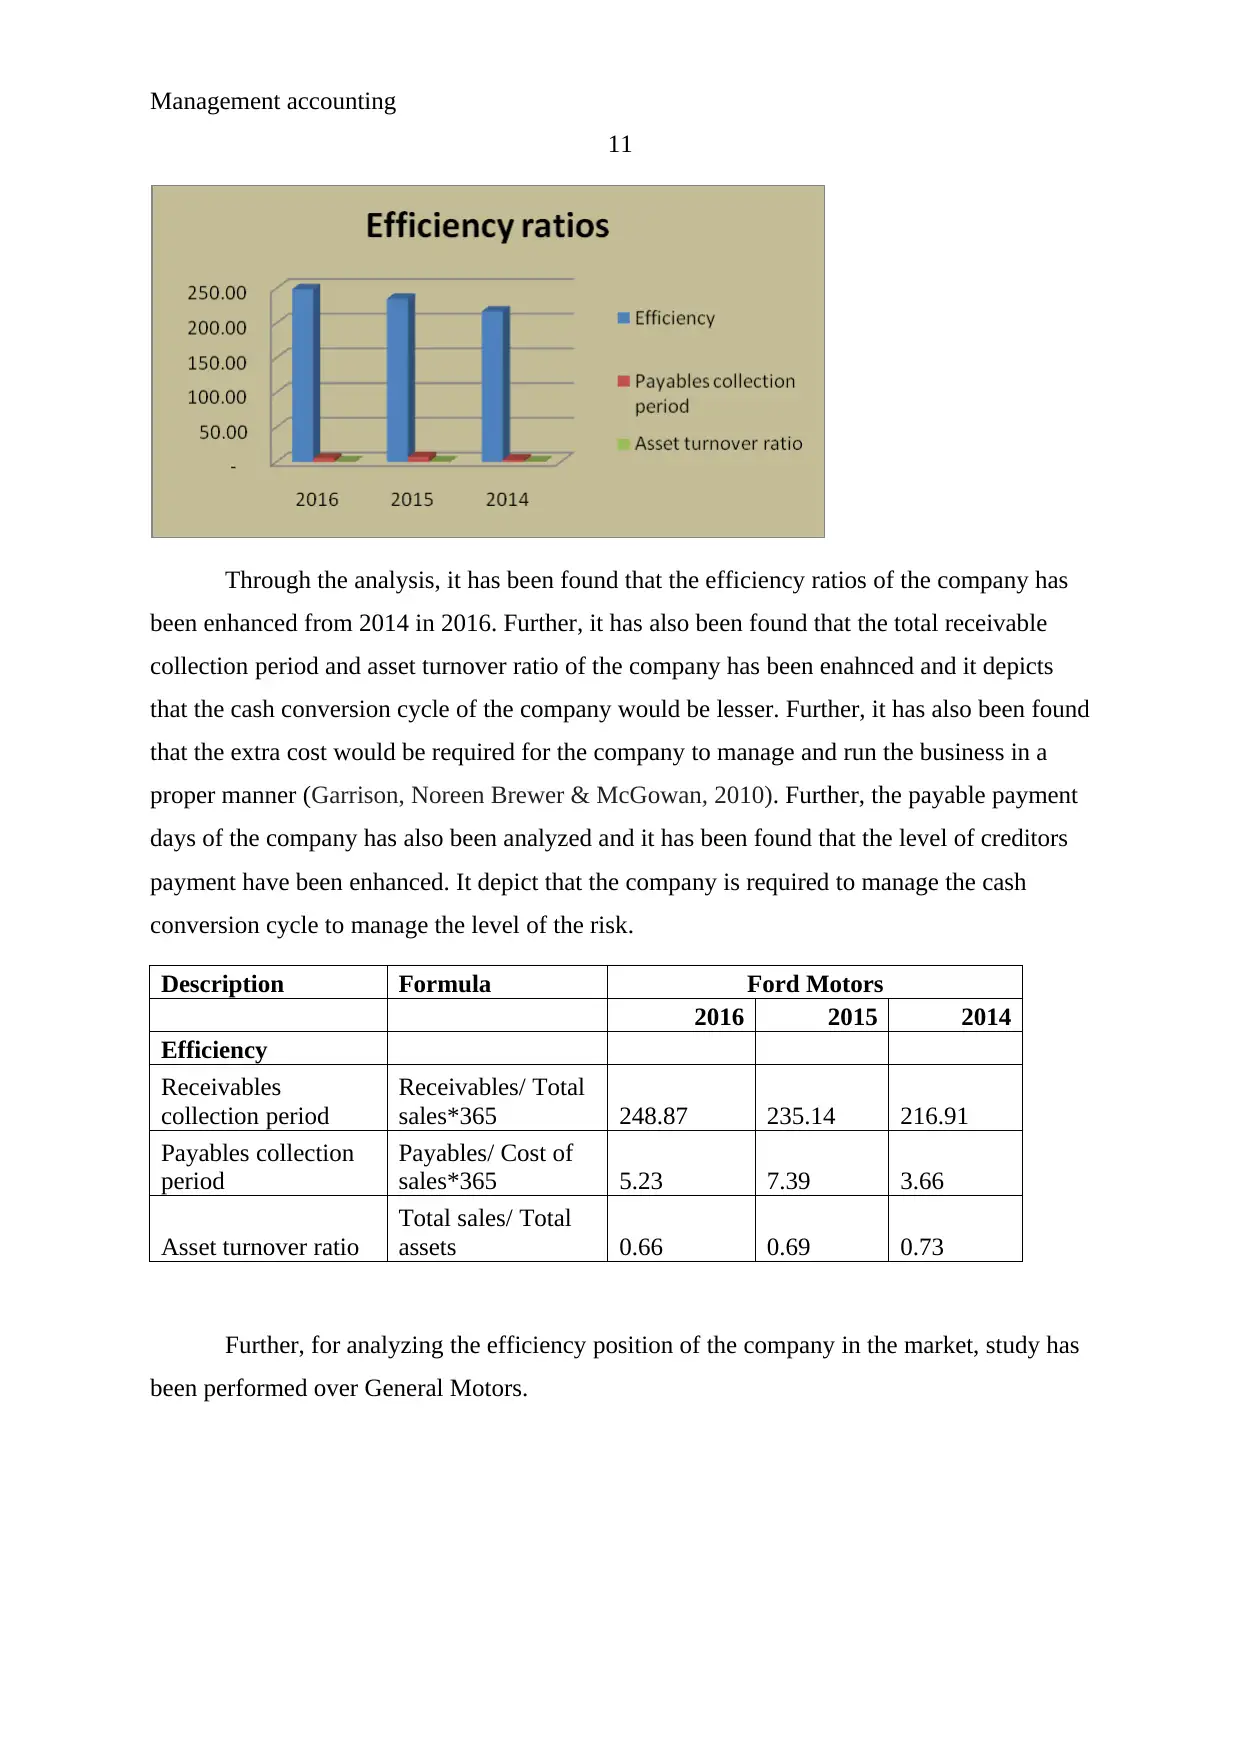
Through the analysis, it has been found that the efficiency ratios of the company has
been enhanced from 2014 in 2016. Further, it has also been found that the total receivable
collection period and asset turnover ratio of the company has been enahnced and it depicts
that the cash conversion cycle of the company would be lesser. Further, it has also been found
that the extra cost would be required for the company to manage and run the business in a
proper manner (Garrison, Noreen Brewer & McGowan, 2010). Further, the payable payment
days of the company has also been analyzed and it has been found that the level of creditors
payment have been enhanced. It depict that the company is required to manage the cash
conversion cycle to manage the level of the risk.
Description Formula Ford Motors
2016 2015 2014
Efficiency
Receivables
collection period
Receivables/ Total
sales*365 248.87 235.14 216.91
Payables collection
period
Payables/ Cost of
sales*365 5.23 7.39 3.66
Asset turnover ratio
Total sales/ Total
assets 0.66 0.69 0.73
Further, for analyzing the efficiency position of the company in the market, study has
been performed over General Motors.
11
Through the analysis, it has been found that the efficiency ratios of the company has
been enhanced from 2014 in 2016. Further, it has also been found that the total receivable
collection period and asset turnover ratio of the company has been enahnced and it depicts
that the cash conversion cycle of the company would be lesser. Further, it has also been found
that the extra cost would be required for the company to manage and run the business in a
proper manner (Garrison, Noreen Brewer & McGowan, 2010). Further, the payable payment
days of the company has also been analyzed and it has been found that the level of creditors
payment have been enhanced. It depict that the company is required to manage the cash
conversion cycle to manage the level of the risk.
Description Formula Ford Motors
2016 2015 2014
Efficiency
Receivables
collection period
Receivables/ Total
sales*365 248.87 235.14 216.91
Payables collection
period
Payables/ Cost of
sales*365 5.23 7.39 3.66
Asset turnover ratio
Total sales/ Total
assets 0.66 0.69 0.73
Further, for analyzing the efficiency position of the company in the market, study has
been performed over General Motors.
Management accounting
12
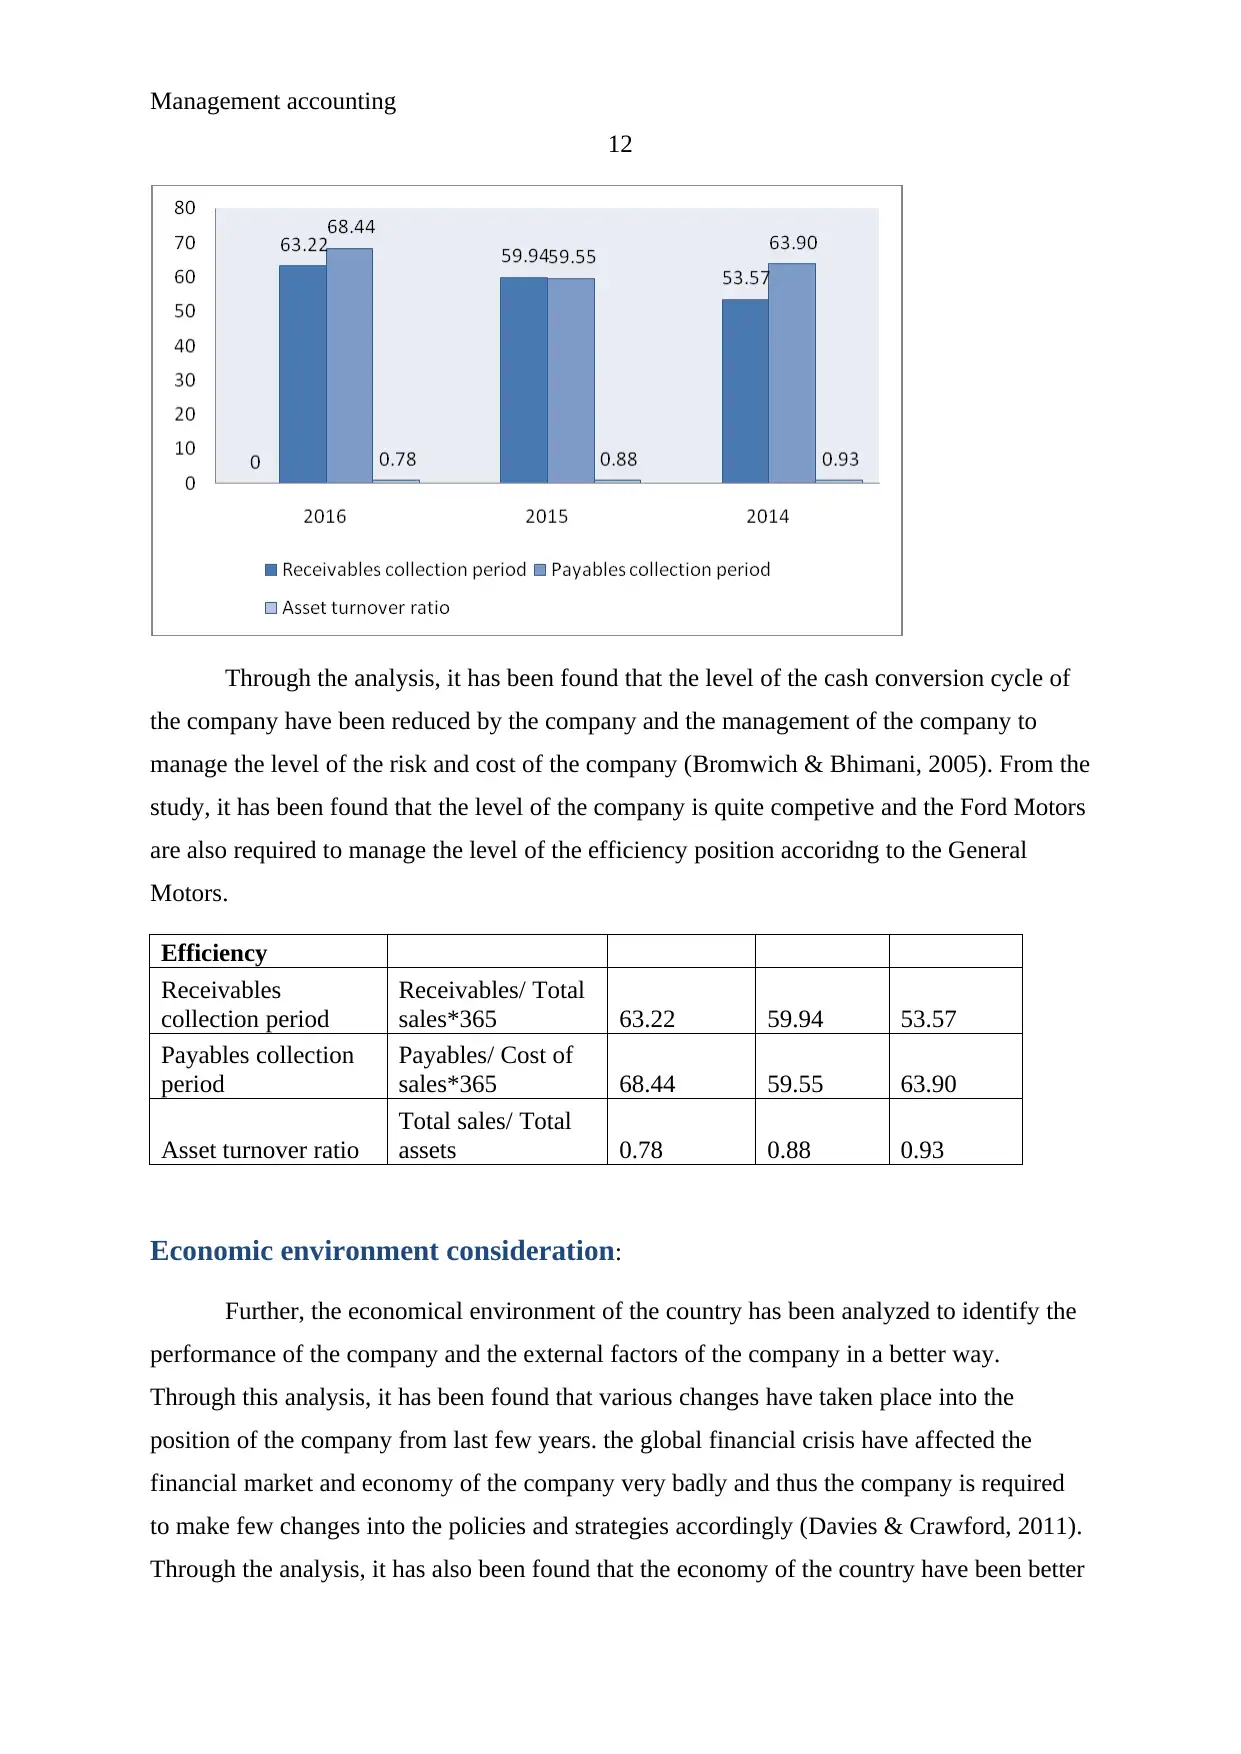
Through the analysis, it has been found that the level of the cash conversion cycle of
the company have been reduced by the company and the management of the company to
manage the level of the risk and cost of the company (Bromwich & Bhimani, 2005). From the
study, it has been found that the level of the company is quite competive and the Ford Motors
are also required to manage the level of the efficiency position accoridng to the General
Motors.
Efficiency
Receivables
collection period
Receivables/ Total
sales*365 63.22 59.94 53.57
Payables collection
period
Payables/ Cost of
sales*365 68.44 59.55 63.90
Asset turnover ratio
Total sales/ Total
assets 0.78 0.88 0.93
Economic environment consideration:
Further, the economical environment of the country has been analyzed to identify the
performance of the company and the external factors of the company in a better way.
Through this analysis, it has been found that various changes have taken place into the
position of the company from last few years. the global financial crisis have affected the
financial market and economy of the company very badly and thus the company is required
to make few changes into the policies and strategies accordingly (Davies & Crawford, 2011).
Through the analysis, it has also been found that the economy of the country have been better
12
Through the analysis, it has been found that the level of the cash conversion cycle of
the company have been reduced by the company and the management of the company to
manage the level of the risk and cost of the company (Bromwich & Bhimani, 2005). From the
study, it has been found that the level of the company is quite competive and the Ford Motors
are also required to manage the level of the efficiency position accoridng to the General
Motors.
Efficiency
Receivables
collection period
Receivables/ Total
sales*365 63.22 59.94 53.57
Payables collection
period
Payables/ Cost of
sales*365 68.44 59.55 63.90
Asset turnover ratio
Total sales/ Total
assets 0.78 0.88 0.93
Economic environment consideration:
Further, the economical environment of the country has been analyzed to identify the
performance of the company and the external factors of the company in a better way.
Through this analysis, it has been found that various changes have taken place into the
position of the company from last few years. the global financial crisis have affected the
financial market and economy of the company very badly and thus the company is required
to make few changes into the policies and strategies accordingly (Davies & Crawford, 2011).
Through the analysis, it has also been found that the economy of the country have been better
⊘ This is a preview!⊘
Do you want full access?
Subscribe today to unlock all pages.
Trusted by 1+ million students worldwide
1 out of 27
Related Documents


Your All-in-One AI-Powered Toolkit for Academic Success.
+13062052269
info@desklib.com
Available 24*7 on WhatsApp / Email
![[object Object]](/_next/static/media/star-bottom.7253800d.svg)
Unlock your academic potential
Copyright © 2020–2026 A2Z Services. All Rights Reserved. Developed and managed by ZUCOL.