Ford Motor Company: Financial Analysis of Stockholders' Equity Report

Verified

Added on  2022/09/06

|4
|662
|14
Report
AI Summary
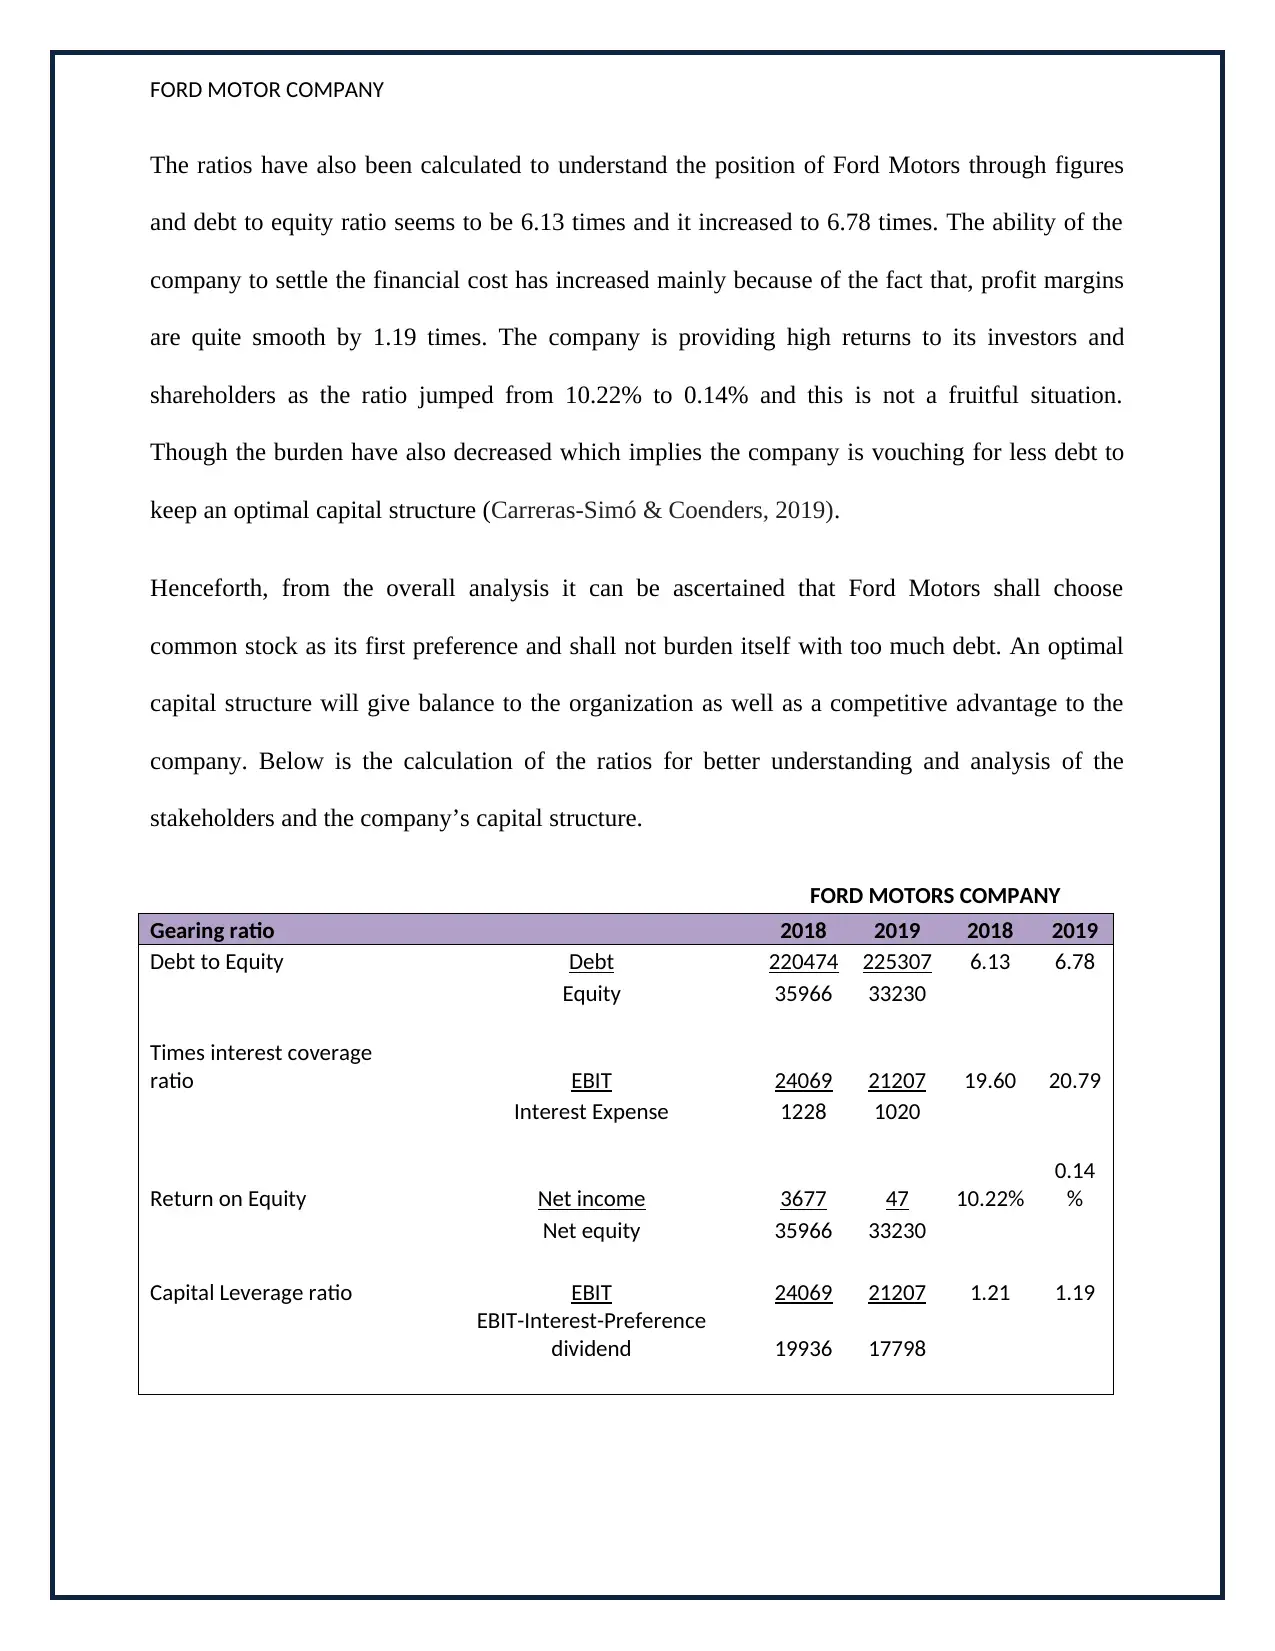
This memorandum analyzes the financial aspects of Ford Motor Company, focusing on stockholders' equity to recommend strategies for cash generation. The analysis includes the types of stock (common and treasury), debt versus equity, and the impact of treasury stock. Key financial ratios, such as debt-to-equity, times interest coverage, capital leverage, and return on equity, are calculated and analyzed to assess the company's financial position. The analysis reveals that Ford should prioritize common stock and maintain an optimal capital structure. The report suggests that the company's ability to manage its financial costs has improved, while also highlighting the need for careful consideration of debt levels and their impact on the company's credit rating and shareholder value. The overall recommendation is to balance financial decisions to maintain competitive advantage and provide value to stakeholders.
Document Page
Running Head: FORD MOTOR COMPANY 1
FORD MOTOR COMPANY
tabler-icon-diamond-filled.svg

Paraphrase This Document

Need a fresh take? Get an instant paraphrase of this document with our AI Paraphraser
Document Page
FORD MOTOR COMPANY
Memorandum
To, CFO
Date: 30/03/2020
Subject: Understanding the financial aspect of Ford Motors Company
Sir,
This is to inform you that there are different types of the stock which are available are common
stock and treasury stock as it can be observed from the balance sheet. The company has acquired
the long term liabilities as well to support the operations of the business. As per the current
balance sheet analysis it can be seen that Capital in the form of the common stock remained at
$40 million whereas the treasury stock decreased from $1417 to $1613 respectively. The mindset
of the company is to acquire funds from the outside parties and this is because of the benefits
associated with it (Ford Motors Company, 2019).
The debt is a good source of finance as it allows the owners to avail the benefit of the tax
advantage on the interest on the loan amount taken. The debt financing allows the owners to
retain their powers within themselves. The drawback that is associated with repayment is that the
amount is required to be paid even when there is a shortage of money. Levering up looks easy at
times, yet each time the loan is taken, the credibility is assessed and it also affects the credit
rating. The issue of common stock is also one of the methods that can be used for financing as it
is a less expensive route and it is free from making the regular payments, but the risk associated
is quite high. Lastly the company also has an option to fund through treasury stock, which helps
in increasing the shareholders’ value but ties up the cash of the company (Campbell, 2017).
Document Page
FORD MOTOR COMPANY
The ratios have also been calculated to understand the position of Ford Motors through figures
and debt to equity ratio seems to be 6.13 times and it increased to 6.78 times. The ability of the
company to settle the financial cost has increased mainly because of the fact that, profit margins
are quite smooth by 1.19 times. The company is providing high returns to its investors and
shareholders as the ratio jumped from 10.22% to 0.14% and this is not a fruitful situation.
Though the burden have also decreased which implies the company is vouching for less debt to
keep an optimal capital structure (Carreras-Simó & Coenders, 2019).
Henceforth, from the overall analysis it can be ascertained that Ford Motors shall choose
common stock as its first preference and shall not burden itself with too much debt. An optimal
capital structure will give balance to the organization as well as a competitive advantage to the
company. Below is the calculation of the ratios for better understanding and analysis of the
stakeholders and the company’s capital structure.
FORD MOTORS COMPANY
Gearing ratio 2018 2019 2018 2019
Debt to Equity Debt 220474 225307 6.13 6.78
Equity 35966 33230
Times interest coverage
ratio EBIT 24069 21207 19.60 20.79
Interest Expense 1228 1020
Return on Equity Net income 3677 47 10.22%
0.14
%
Net equity 35966 33230
Capital Leverage ratio EBIT 24069 21207 1.21 1.19
EBIT-Interest-Preference
dividend 19936 17798
Document Page
FORD MOTOR COMPANY
References
Campbell, B. (2017). Why Such a Focus on External Sources of Funds to Finance
Development?. Mondes en développement, (2), 77-92.
Carreras-Simó, M., & Coenders, G. (2019). Principal component analysis of financial statements.
A compositional approach. Revista de Métodos Cuantitativos para la Economía y la
Empresa, 29.
Ford Motors Company, (2019). Annual Report. Retrieved from
https://sec.report/Document/0000037996-20-000010/f1231201910-
k.htm#sAC1CCB2F49095CC68D89F57AA887F4D8
chevron_up_icon
1 out of 4
circle_padding
hide_on_mobile
zoom_out_icon
[object Object]