Forecasting Project 1: Data Description and Examination in Economics

Verified

Added on  2021/02/21

|14
|1328
|45
Project
AI Summary
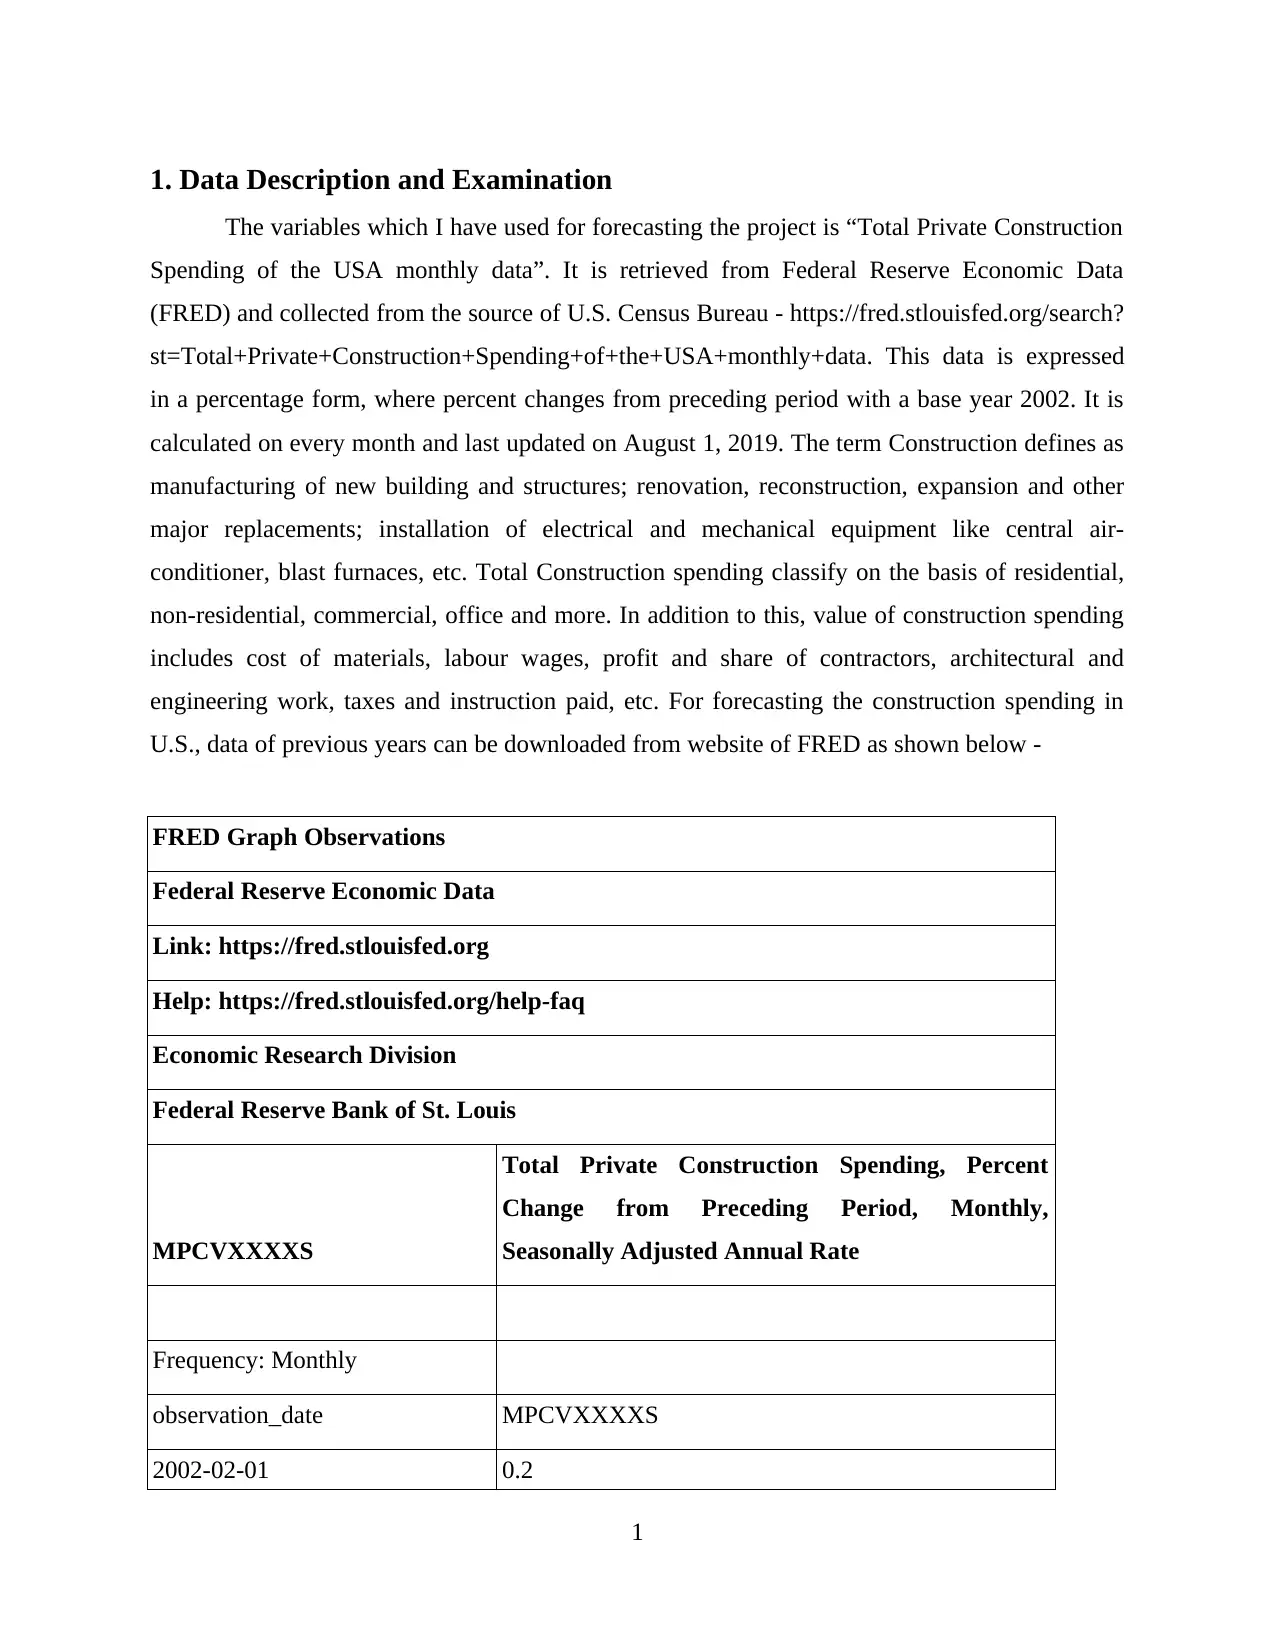
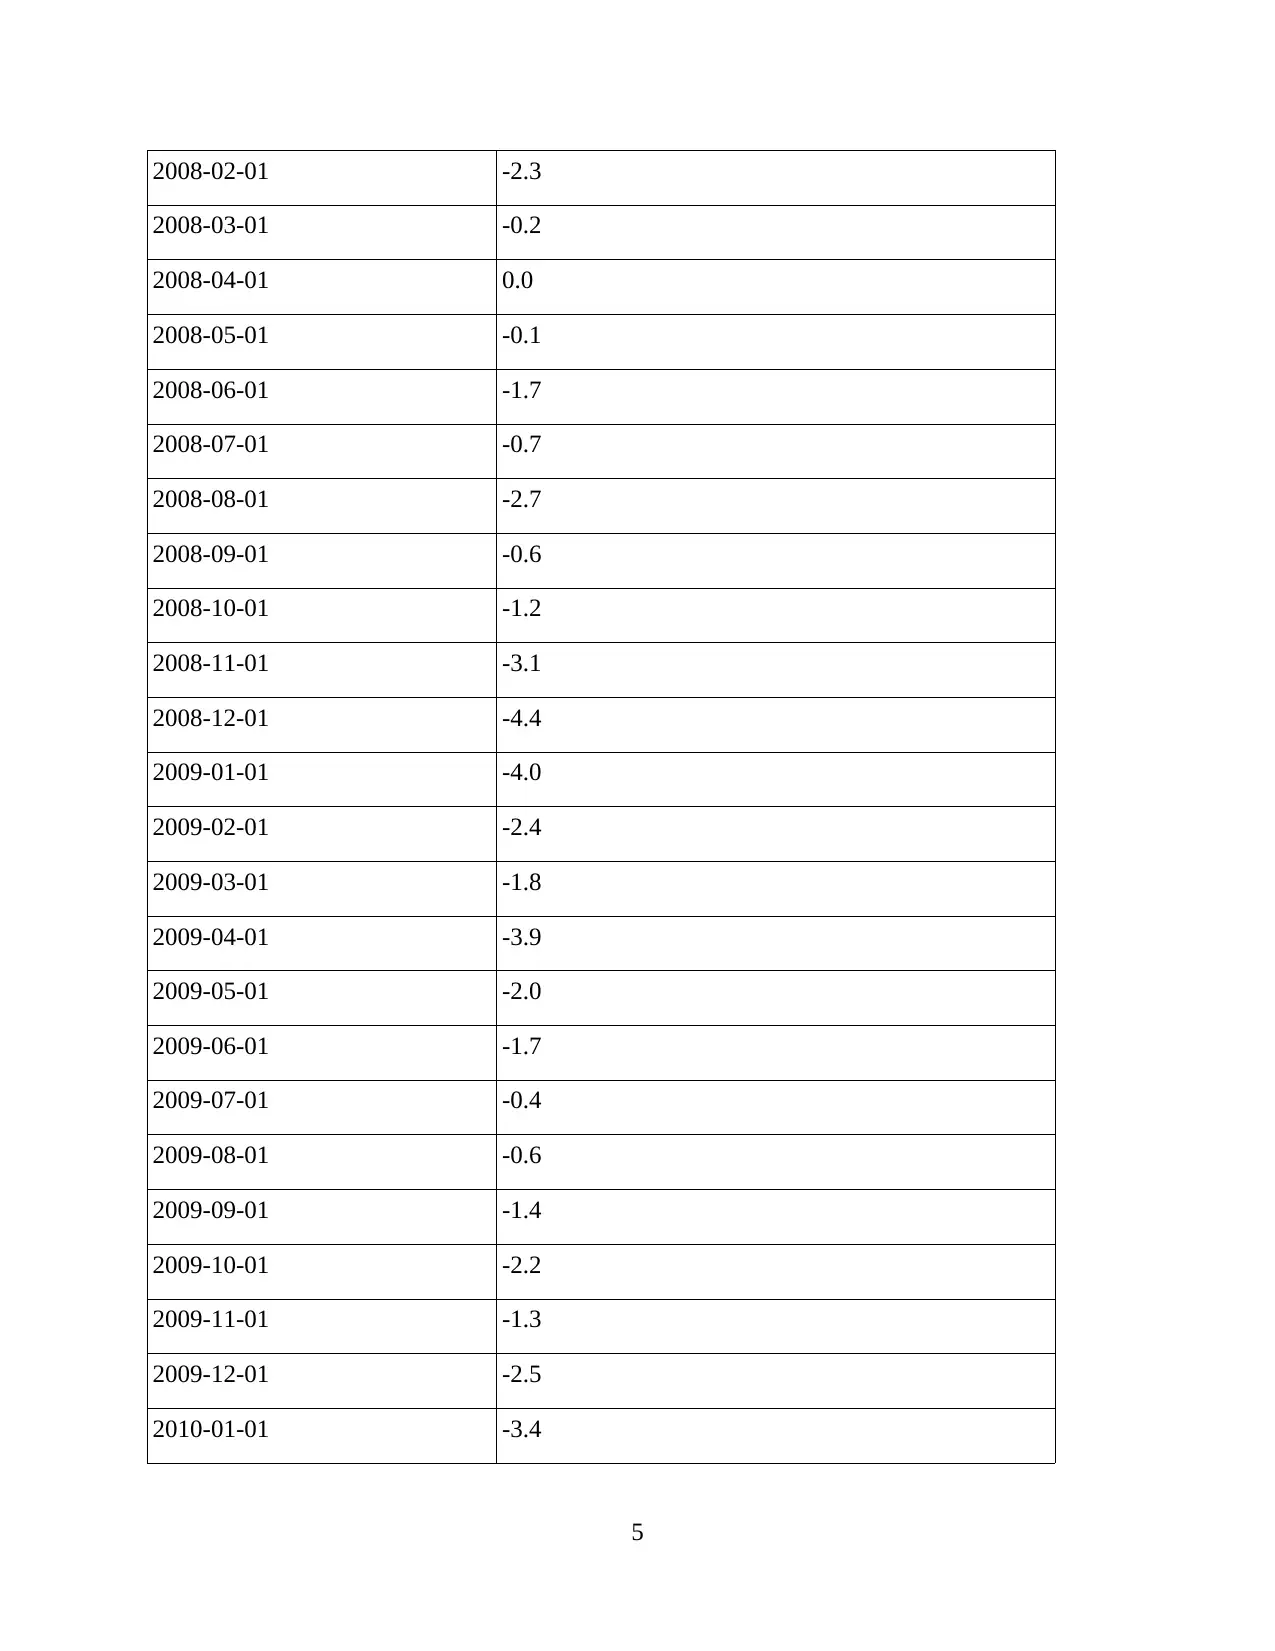
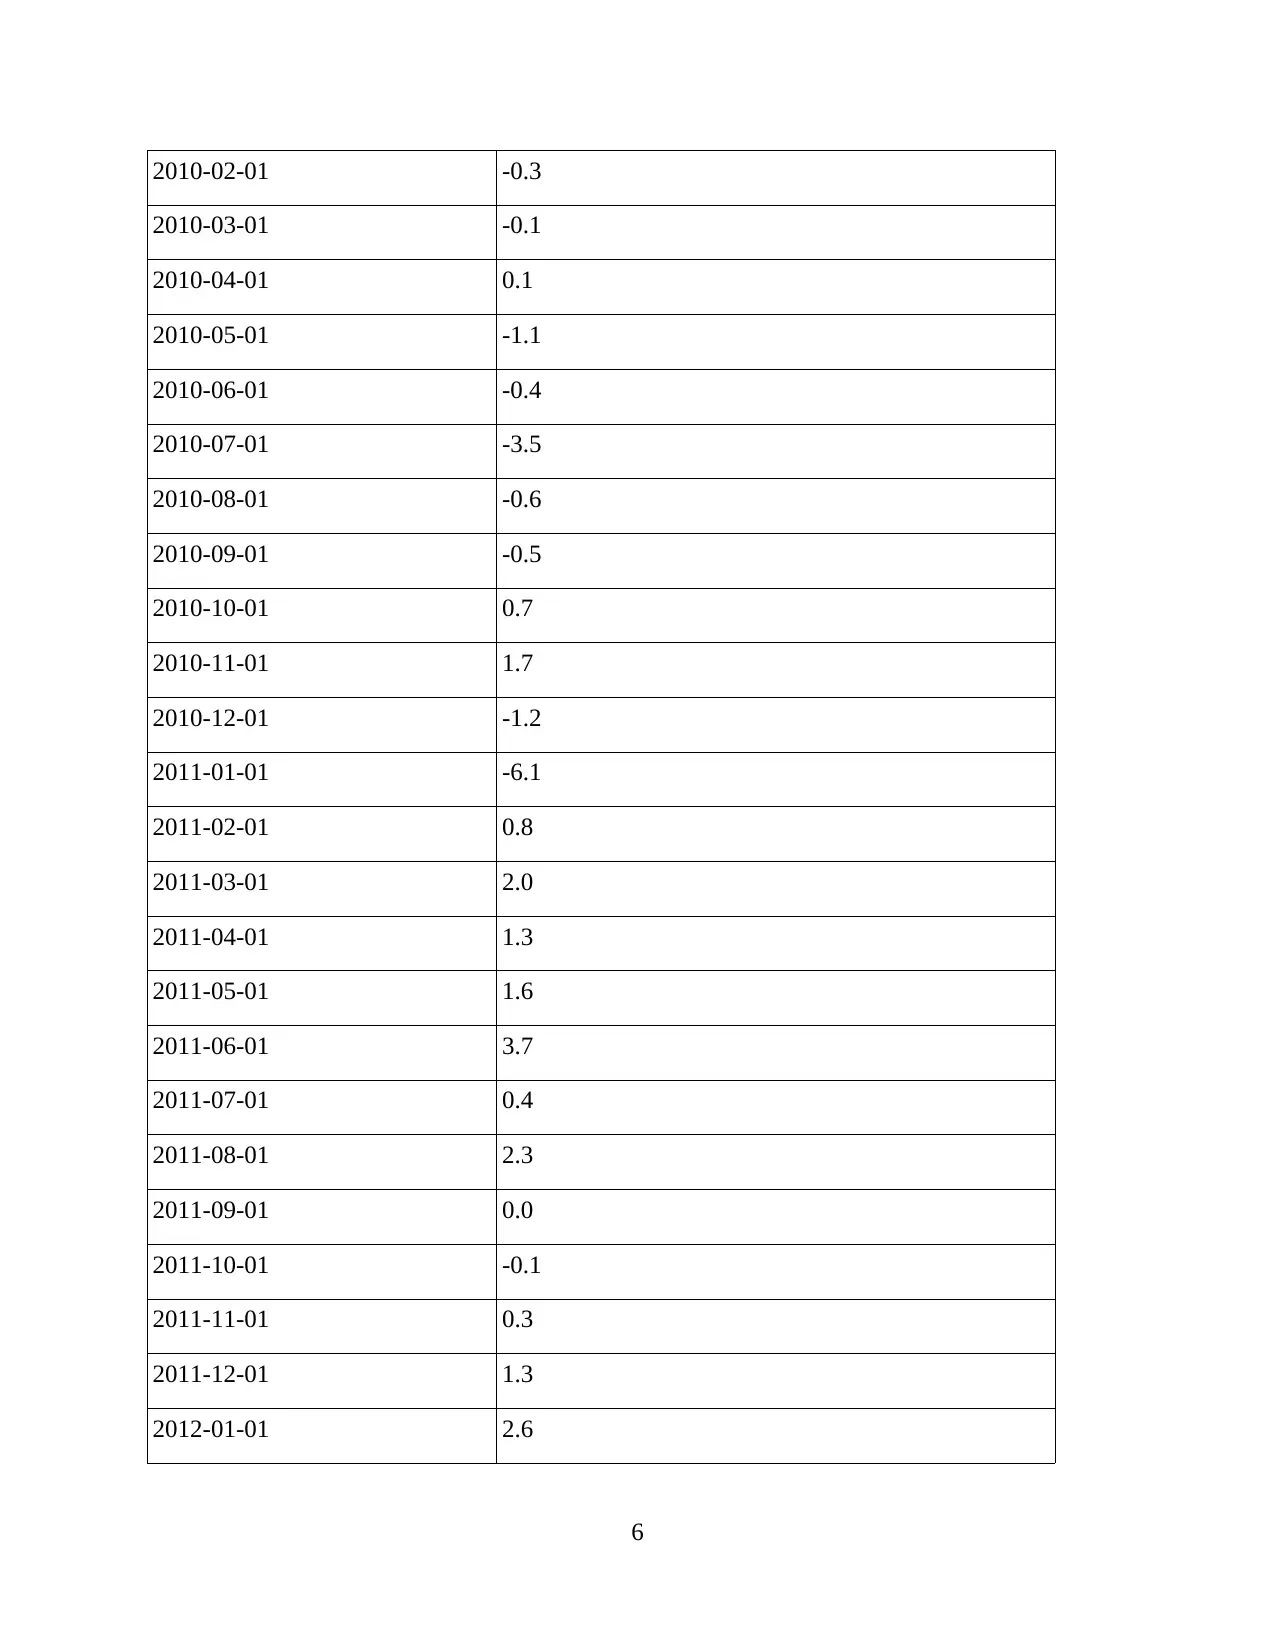
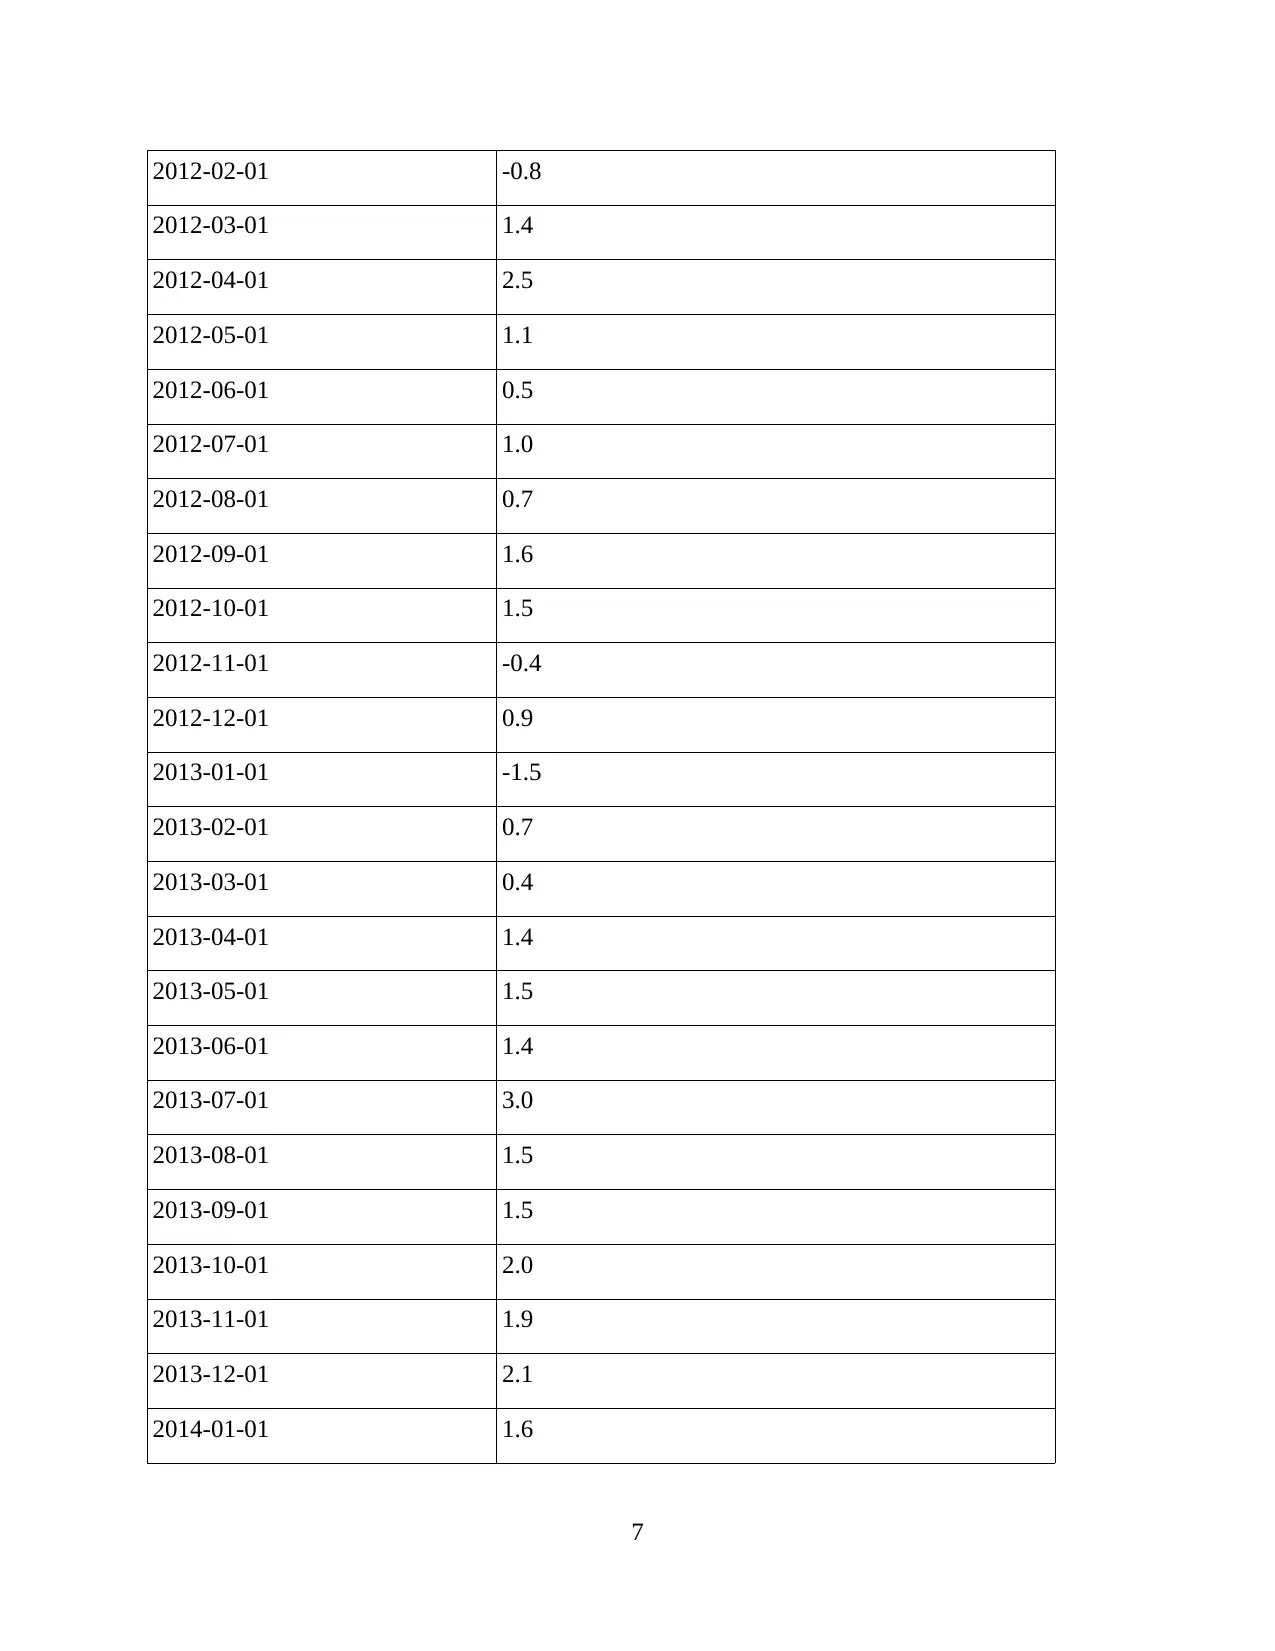
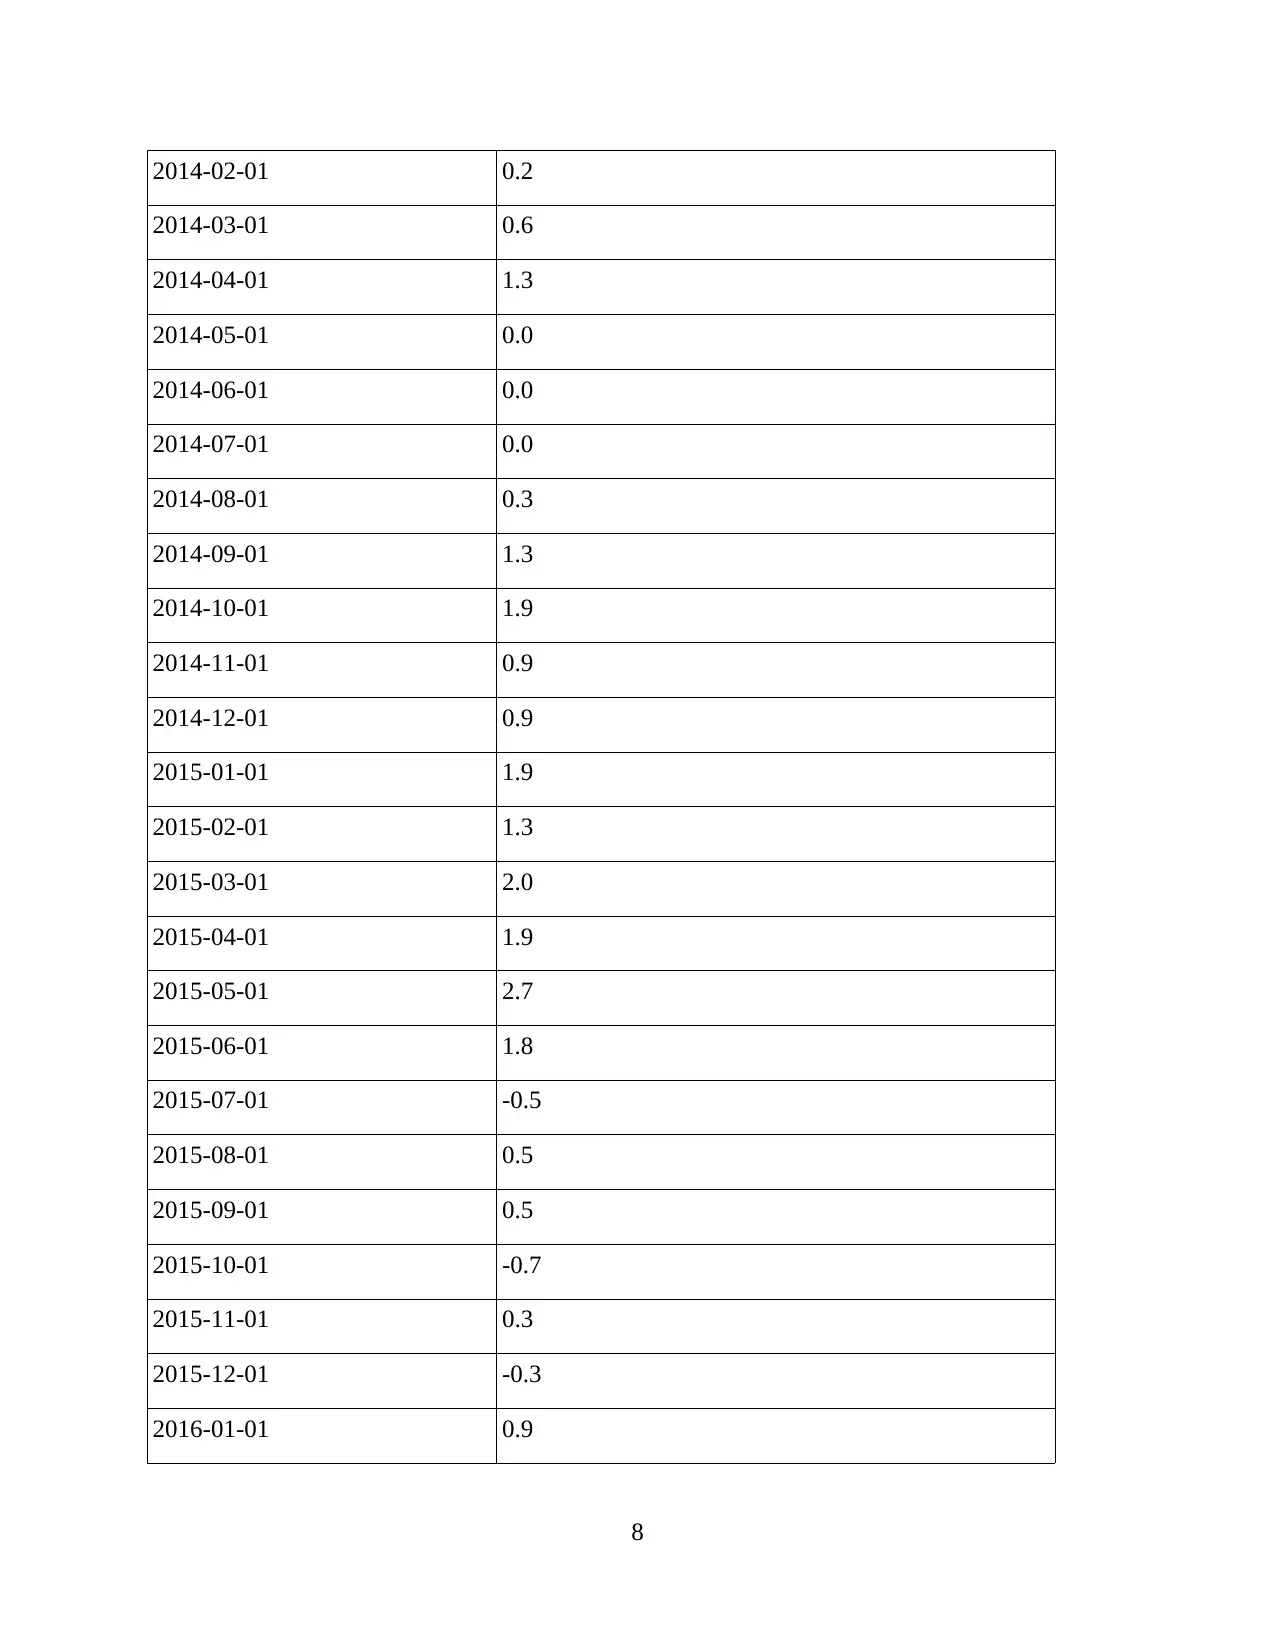
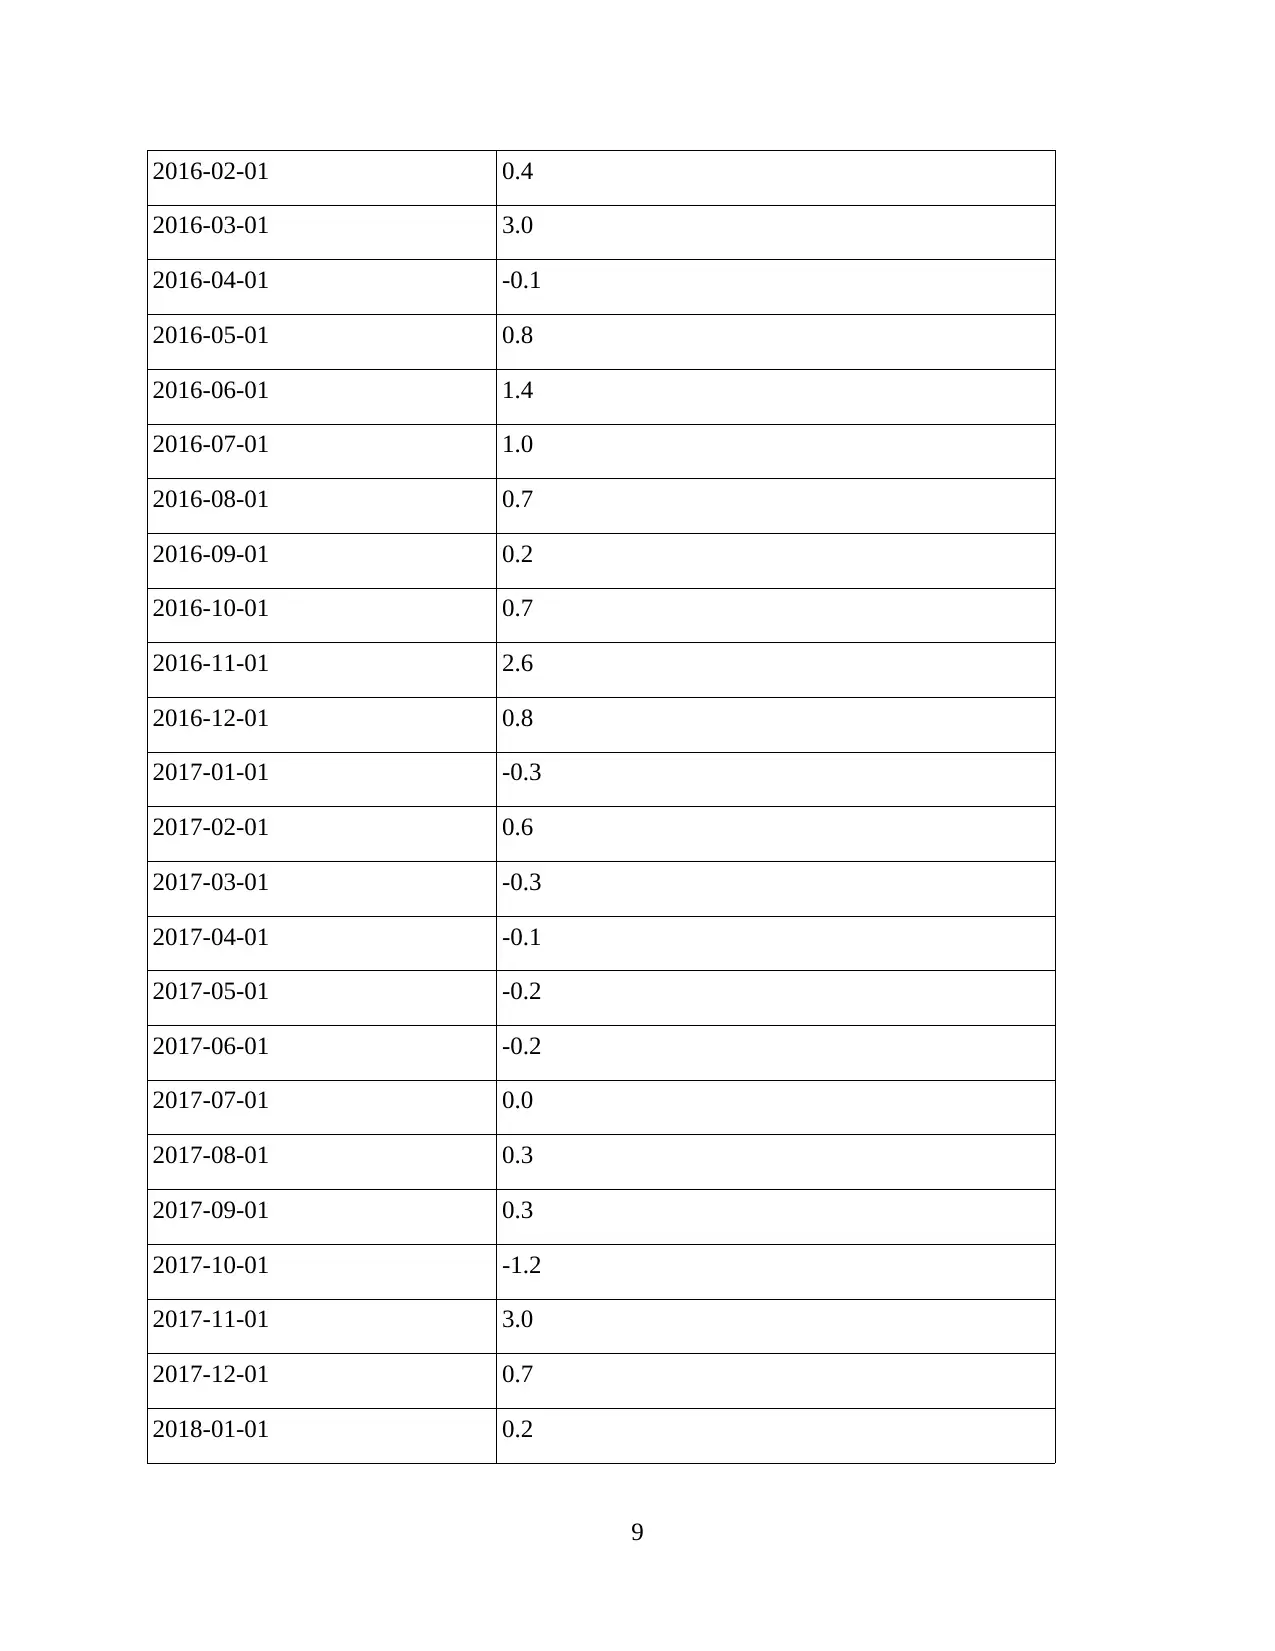
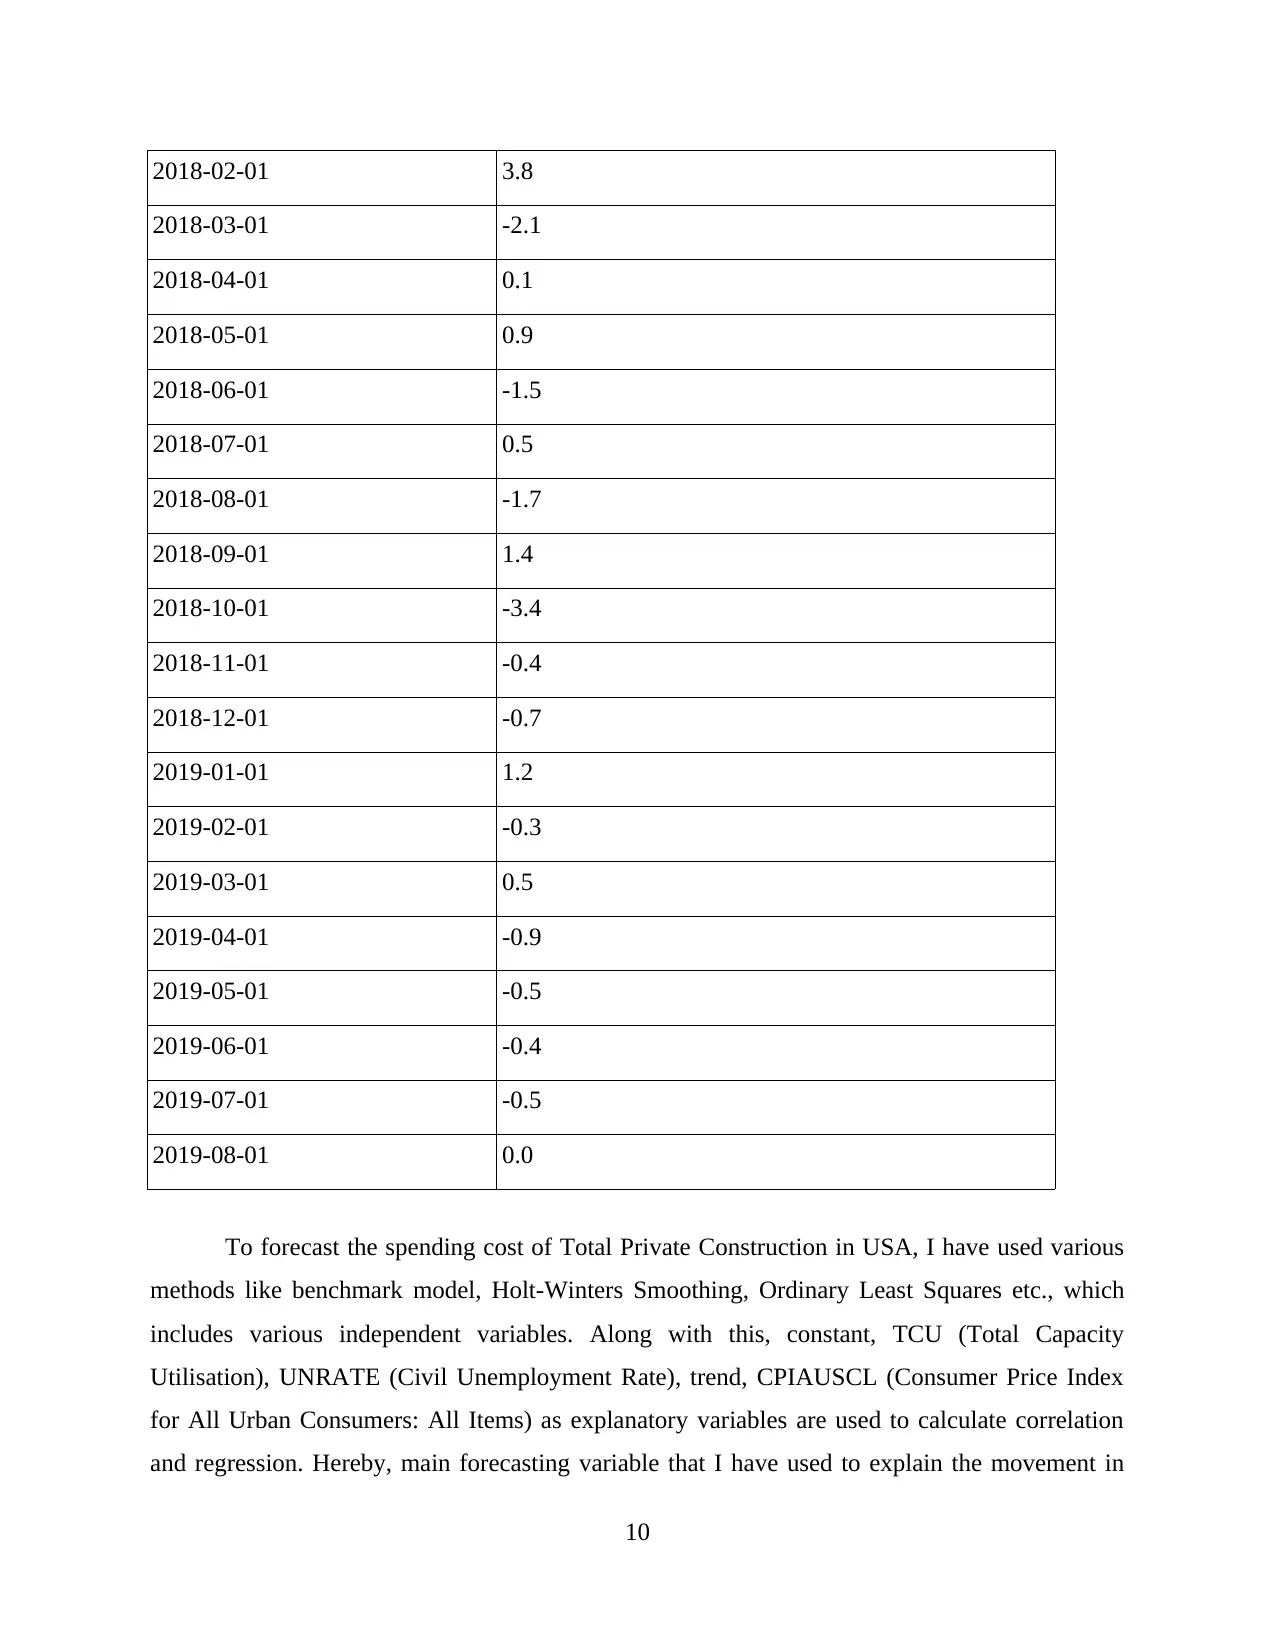
This project focuses on forecasting the total private construction spending in the USA using monthly data obtained from the Federal Reserve Economic Data (FRED). The analysis involves examining data from the U.S. Census Bureau, expressed as percentage changes from the preceding period with a base year of 2002. The project defines construction spending, detailing its components, and explains the data's relevance in forecasting. The student utilizes various forecasting methods, including benchmark models, Holt-Winters Smoothing, and Ordinary Least Squares, incorporating independent variables like constant, TCU (Total Capacity Utilisation), UNRATE (Civil Unemployment Rate), trend, and CPIAUSCL (Consumer Price Index). The core forecasting variable, Total Private Construction Spending (TLPVRCONS), is analyzed in relation to other economic indicators such as Disposable Personal Income Per Capita (A229RC0) and employment data within the construction sector (USCONS). The data from 2018 to 2019 is used, and the student interprets the co-movement between TLPVRCONS, USCONS, and CPIAUCSL, while noting the negative correlation with A229RCO. The assignment provides the data and the interpretations from the analysis.
Document Page
Forecasting Project
tabler-icon-diamond-filled.svg

Paraphrase This Document

Need a fresh take? Get an instant paraphrase of this document with our AI Paraphraser
Document Page
Document Page
1. Data Description and Examination
The variables which I have used for forecasting the project is “Total Private Construction
Spending of the USA monthly data”. It is retrieved from Federal Reserve Economic Data
(FRED) and collected from the source of U.S. Census Bureau - https://fred.stlouisfed.org/search?
st=Total+Private+Construction+Spending+of+the+USA+monthly+data. This data is expressed
in a percentage form, where percent changes from preceding period with a base year 2002. It is
calculated on every month and last updated on August 1, 2019. The term Construction defines as
manufacturing of new building and structures; renovation, reconstruction, expansion and other
major replacements; installation of electrical and mechanical equipment like central air-
conditioner, blast furnaces, etc. Total Construction spending classify on the basis of residential,
non-residential, commercial, office and more. In addition to this, value of construction spending
includes cost of materials, labour wages, profit and share of contractors, architectural and
engineering work, taxes and instruction paid, etc. For forecasting the construction spending in
U.S., data of previous years can be downloaded from website of FRED as shown below -
FRED Graph Observations
Federal Reserve Economic Data
Link: https://fred.stlouisfed.org
Help: https://fred.stlouisfed.org/help-faq
Economic Research Division
Federal Reserve Bank of St. Louis
MPCVXXXXS
Total Private Construction Spending, Percent
Change from Preceding Period, Monthly,
Seasonally Adjusted Annual Rate
Frequency: Monthly
observation_date MPCVXXXXS
2002-02-01 0.2
1
Document Page
2002-03-01 -0.7
2002-04-01 1.8
2002-05-01 -2.1
2002-06-01 0.2
2002-07-01 -0.5
2002-08-01 -1.2
2002-09-01 -1.1
2002-10-01 1.0
2002-11-01 0.8
2002-12-01 0.6
2003-01-01 1.6
2003-02-01 -0.2
2003-03-01 0.0
2003-04-01 0.7
2003-05-01 0.9
2003-06-01 1.3
2003-07-01 1.7
2003-08-01 1.2
2003-09-01 1.6
2003-10-01 1.5
2003-11-01 1.2
2003-12-01 3.4
2004-01-01 -1.3
2
tabler-icon-diamond-filled.svg

Paraphrase This Document

Need a fresh take? Get an instant paraphrase of this document with our AI Paraphraser
Document Page
2004-02-01 0.3
2004-03-01 1.6
2004-04-01 0.8
2004-05-01 1.2
2004-06-01 0.7
2004-07-01 2.9
2004-08-01 1.4
2004-09-01 0.1
2004-10-01 0.5
2004-11-01 0.0
2004-12-01 2.0
2005-01-01 1.5
2005-02-01 1.7
2005-03-01 0.4
2005-04-01 1.1
2005-05-01 0.8
2005-06-01 1.1
2005-07-01 1.5
2005-08-01 1.1
2005-09-01 2.2
2005-10-01 1.4
2005-11-01 1.2
2005-12-01 0.8
2006-01-01 1.1
3
Document Page
2006-02-01 0.5
2006-03-01 -0.5
2006-04-01 -1.7
2006-05-01 -1.1
2006-06-01 -1.4
2006-07-01 -1.6
2006-08-01 -1.0
2006-09-01 -1.1
2006-10-01 -1.7
2006-11-01 -0.5
2006-12-01 0.3
2007-01-01 -0.7
2007-02-01 0.6
2007-03-01 0.5
2007-04-01 0.1
2007-05-01 0.4
2007-06-01 0.3
2007-07-01 -1.0
2007-08-01 -0.1
2007-09-01 -0.5
2007-10-01 -0.5
2007-11-01 -2.6
2007-12-01 -2.0
2008-01-01 -0.1
4
Document Page
2008-02-01 -2.3
2008-03-01 -0.2
2008-04-01 0.0
2008-05-01 -0.1
2008-06-01 -1.7
2008-07-01 -0.7
2008-08-01 -2.7
2008-09-01 -0.6
2008-10-01 -1.2
2008-11-01 -3.1
2008-12-01 -4.4
2009-01-01 -4.0
2009-02-01 -2.4
2009-03-01 -1.8
2009-04-01 -3.9
2009-05-01 -2.0
2009-06-01 -1.7
2009-07-01 -0.4
2009-08-01 -0.6
2009-09-01 -1.4
2009-10-01 -2.2
2009-11-01 -1.3
2009-12-01 -2.5
2010-01-01 -3.4
5
tabler-icon-diamond-filled.svg

Paraphrase This Document

Need a fresh take? Get an instant paraphrase of this document with our AI Paraphraser
Document Page
2010-02-01 -0.3
2010-03-01 -0.1
2010-04-01 0.1
2010-05-01 -1.1
2010-06-01 -0.4
2010-07-01 -3.5
2010-08-01 -0.6
2010-09-01 -0.5
2010-10-01 0.7
2010-11-01 1.7
2010-12-01 -1.2
2011-01-01 -6.1
2011-02-01 0.8
2011-03-01 2.0
2011-04-01 1.3
2011-05-01 1.6
2011-06-01 3.7
2011-07-01 0.4
2011-08-01 2.3
2011-09-01 0.0
2011-10-01 -0.1
2011-11-01 0.3
2011-12-01 1.3
2012-01-01 2.6
6
Document Page
2012-02-01 -0.8
2012-03-01 1.4
2012-04-01 2.5
2012-05-01 1.1
2012-06-01 0.5
2012-07-01 1.0
2012-08-01 0.7
2012-09-01 1.6
2012-10-01 1.5
2012-11-01 -0.4
2012-12-01 0.9
2013-01-01 -1.5
2013-02-01 0.7
2013-03-01 0.4
2013-04-01 1.4
2013-05-01 1.5
2013-06-01 1.4
2013-07-01 3.0
2013-08-01 1.5
2013-09-01 1.5
2013-10-01 2.0
2013-11-01 1.9
2013-12-01 2.1
2014-01-01 1.6
7
Document Page
2014-02-01 0.2
2014-03-01 0.6
2014-04-01 1.3
2014-05-01 0.0
2014-06-01 0.0
2014-07-01 0.0
2014-08-01 0.3
2014-09-01 1.3
2014-10-01 1.9
2014-11-01 0.9
2014-12-01 0.9
2015-01-01 1.9
2015-02-01 1.3
2015-03-01 2.0
2015-04-01 1.9
2015-05-01 2.7
2015-06-01 1.8
2015-07-01 -0.5
2015-08-01 0.5
2015-09-01 0.5
2015-10-01 -0.7
2015-11-01 0.3
2015-12-01 -0.3
2016-01-01 0.9
8
tabler-icon-diamond-filled.svg

Paraphrase This Document

Need a fresh take? Get an instant paraphrase of this document with our AI Paraphraser
Document Page
2016-02-01 0.4
2016-03-01 3.0
2016-04-01 -0.1
2016-05-01 0.8
2016-06-01 1.4
2016-07-01 1.0
2016-08-01 0.7
2016-09-01 0.2
2016-10-01 0.7
2016-11-01 2.6
2016-12-01 0.8
2017-01-01 -0.3
2017-02-01 0.6
2017-03-01 -0.3
2017-04-01 -0.1
2017-05-01 -0.2
2017-06-01 -0.2
2017-07-01 0.0
2017-08-01 0.3
2017-09-01 0.3
2017-10-01 -1.2
2017-11-01 3.0
2017-12-01 0.7
2018-01-01 0.2
9
Document Page
2018-02-01 3.8
2018-03-01 -2.1
2018-04-01 0.1
2018-05-01 0.9
2018-06-01 -1.5
2018-07-01 0.5
2018-08-01 -1.7
2018-09-01 1.4
2018-10-01 -3.4
2018-11-01 -0.4
2018-12-01 -0.7
2019-01-01 1.2
2019-02-01 -0.3
2019-03-01 0.5
2019-04-01 -0.9
2019-05-01 -0.5
2019-06-01 -0.4
2019-07-01 -0.5
2019-08-01 0.0
To forecast the spending cost of Total Private Construction in USA, I have used various
methods like benchmark model, Holt-Winters Smoothing, Ordinary Least Squares etc., which
includes various independent variables. Along with this, constant, TCU (Total Capacity
Utilisation), UNRATE (Civil Unemployment Rate), trend, CPIAUSCL (Consumer Price Index
for All Urban Consumers: All Items) as explanatory variables are used to calculate correlation
and regression. Hereby, main forecasting variable that I have used to explain the movement in
10
chevron_up_icon
1 out of 14
circle_padding
hide_on_mobile
zoom_out_icon
[object Object]