Data Analysis and Forecasting: Numeracy and Data Analysis Report

Verified

Added on  2023/01/07

|11
|1602
|65
Report
AI Summary
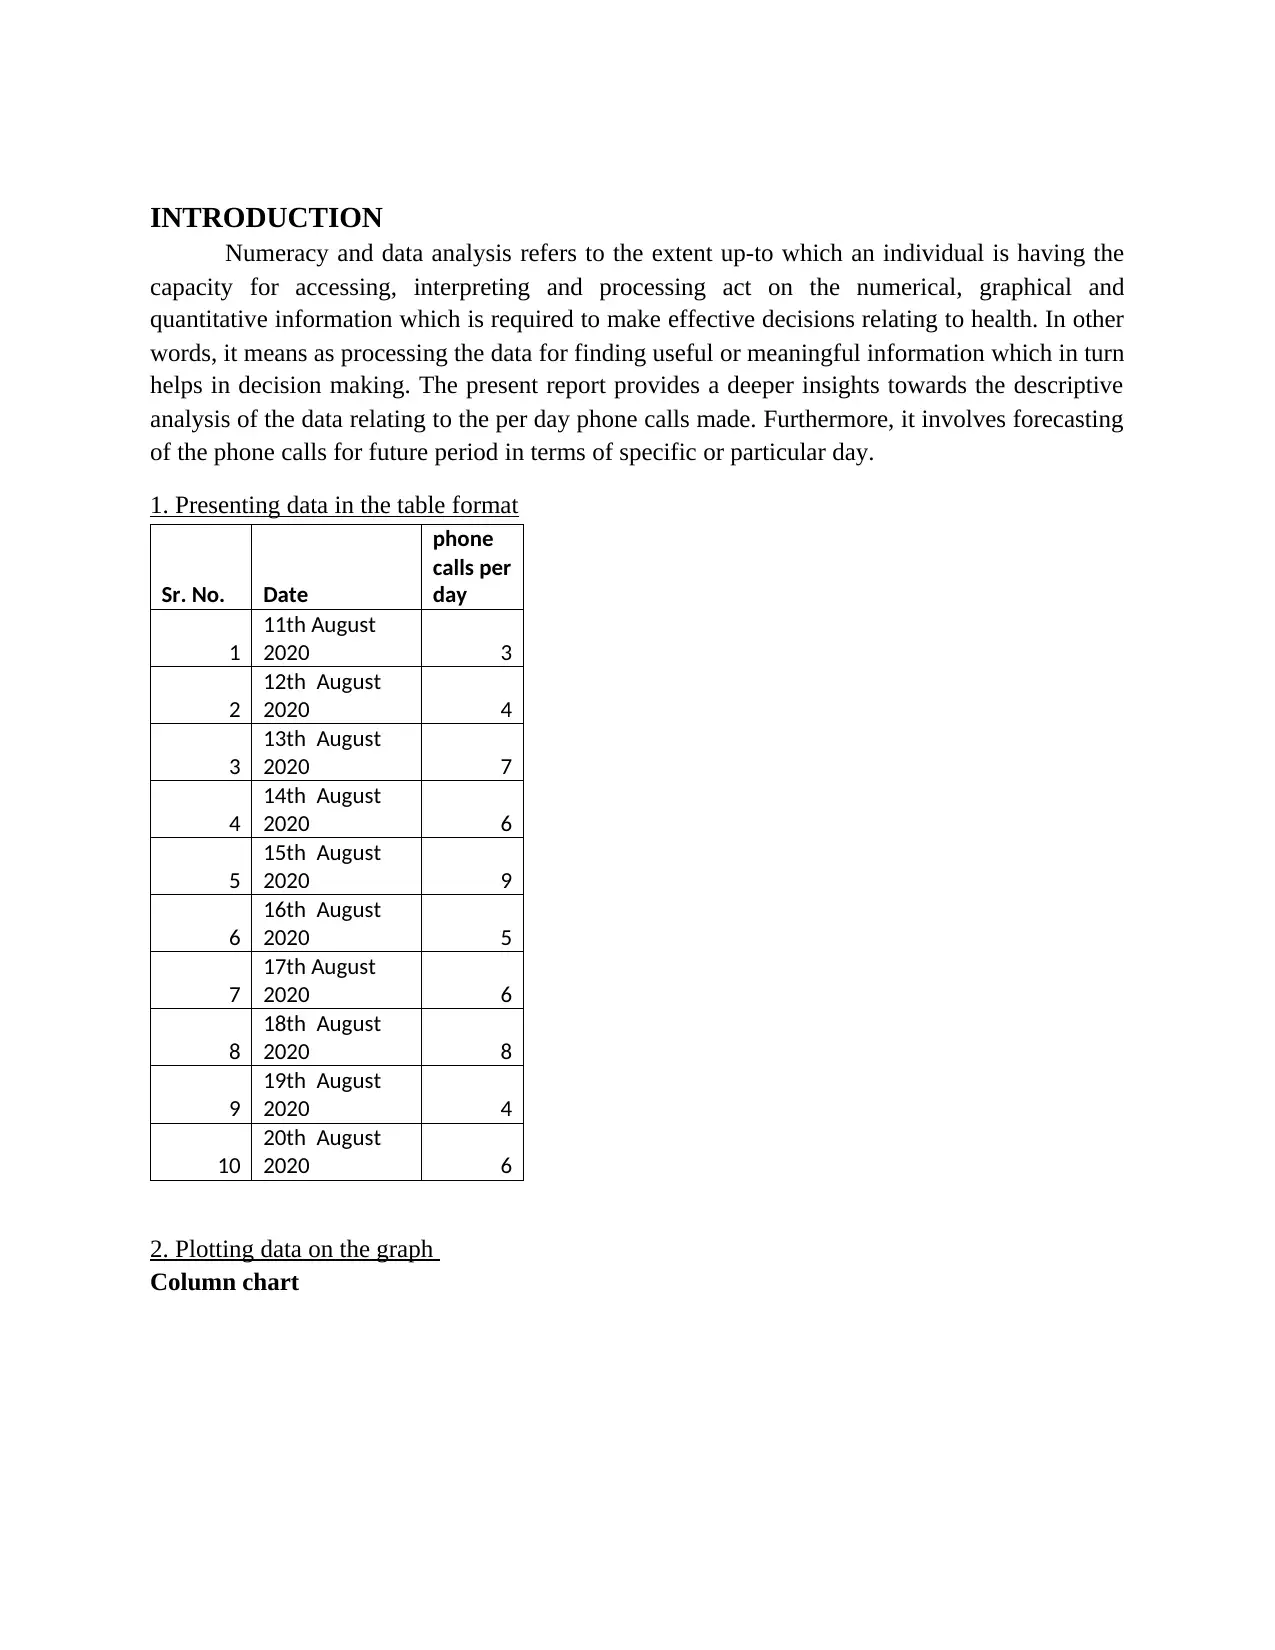
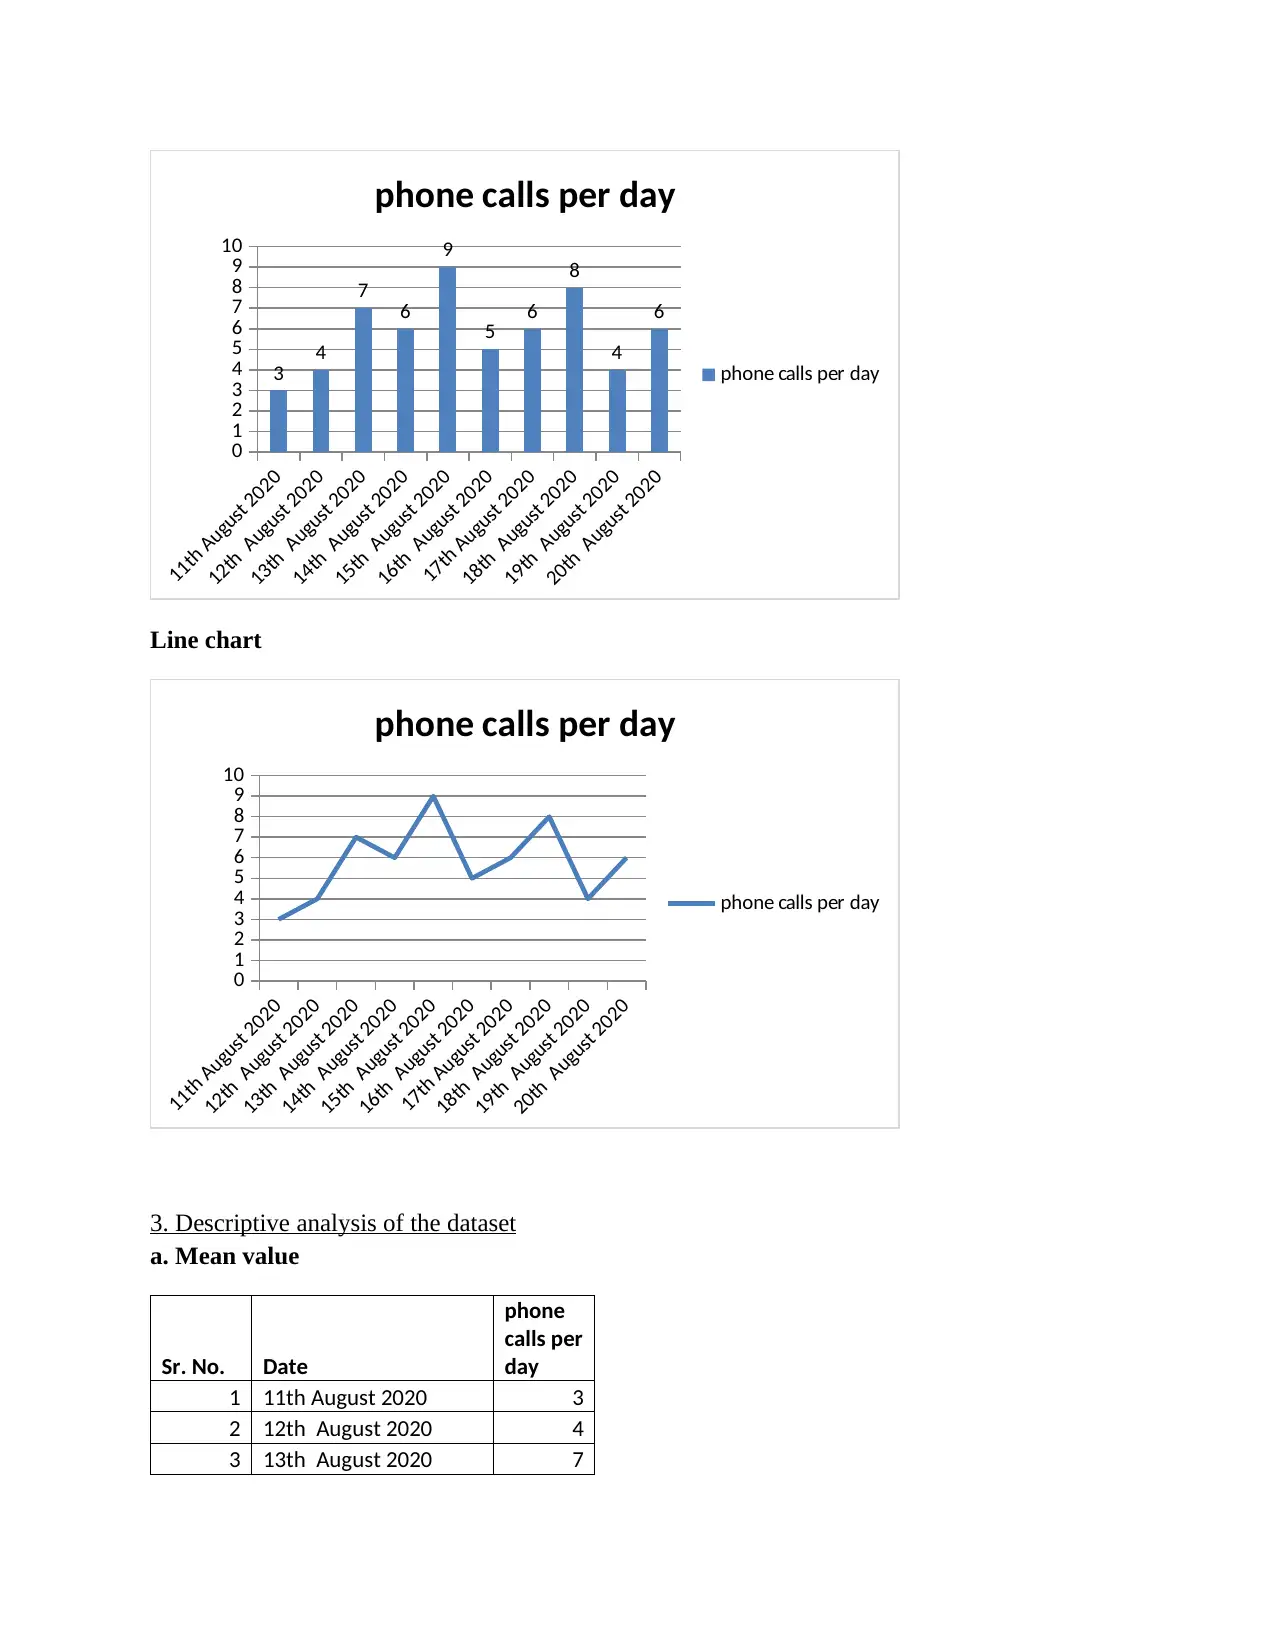
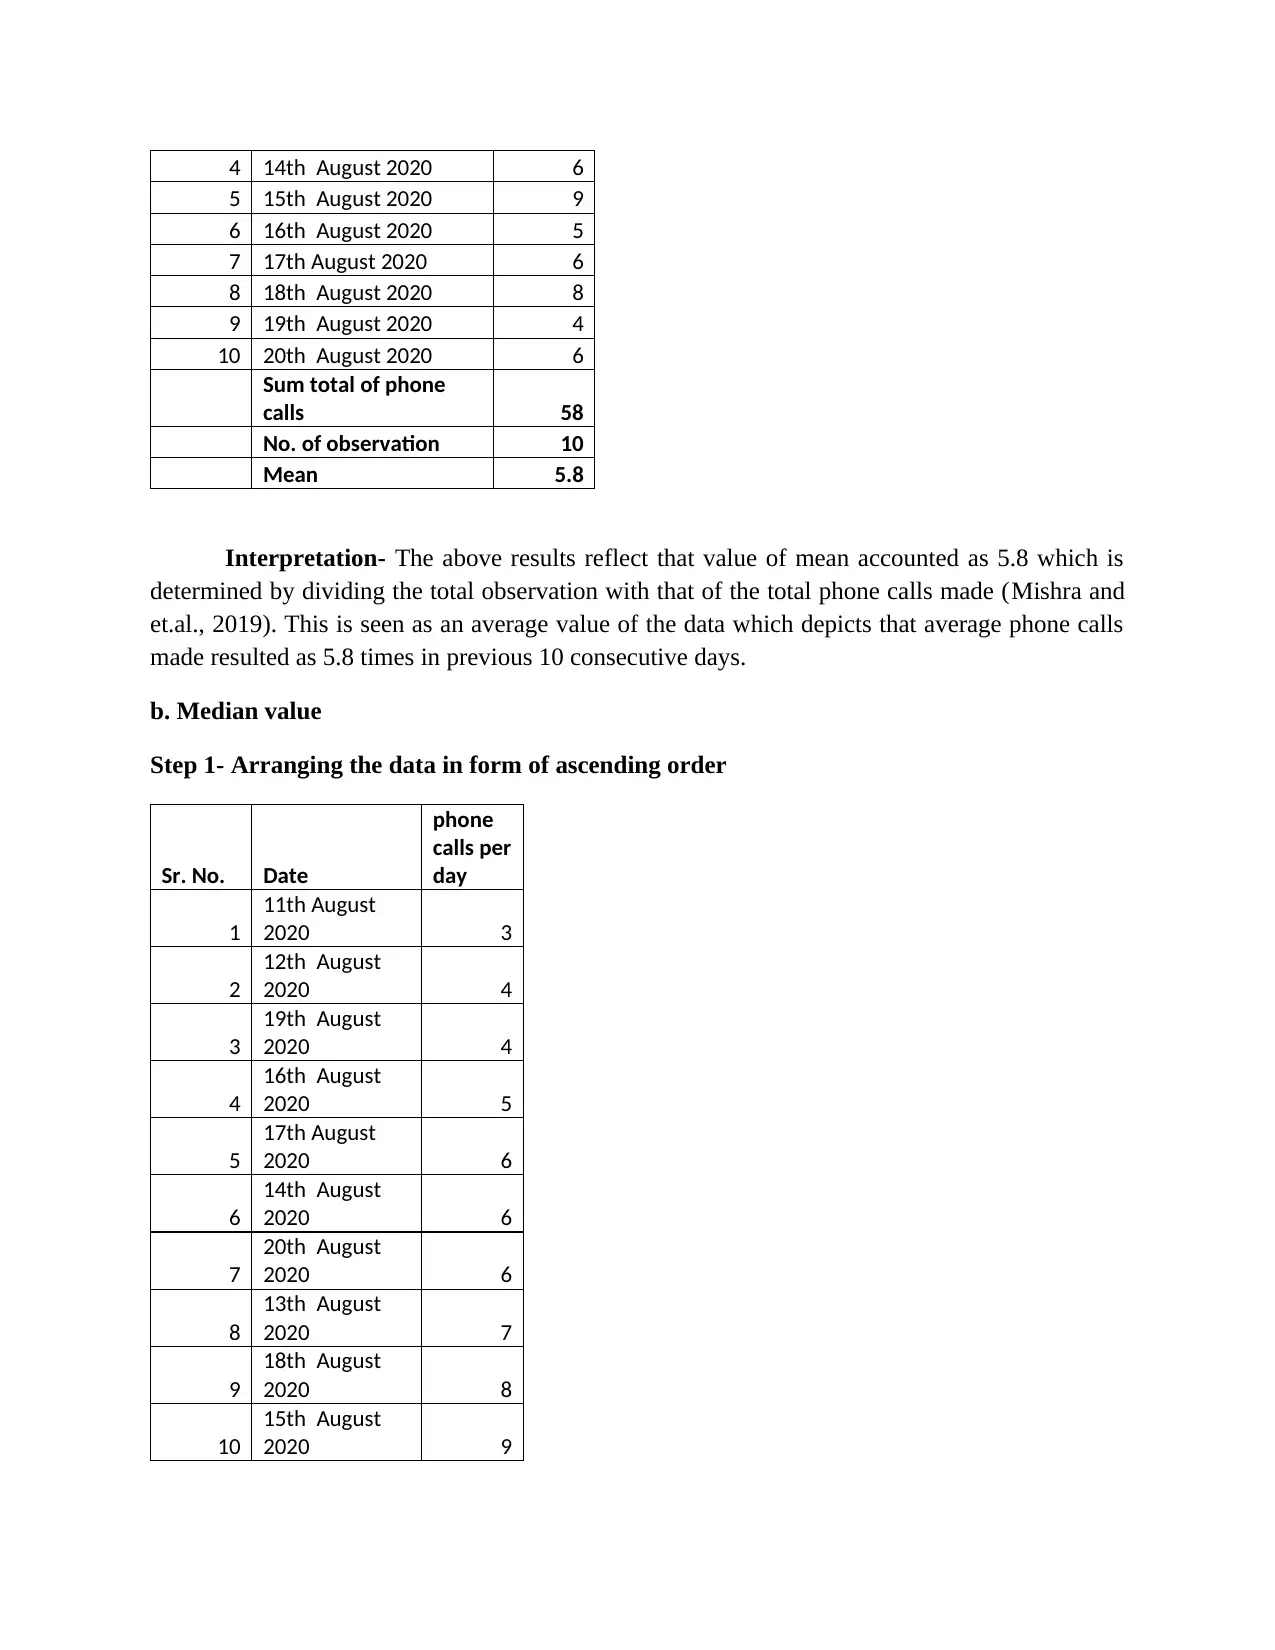
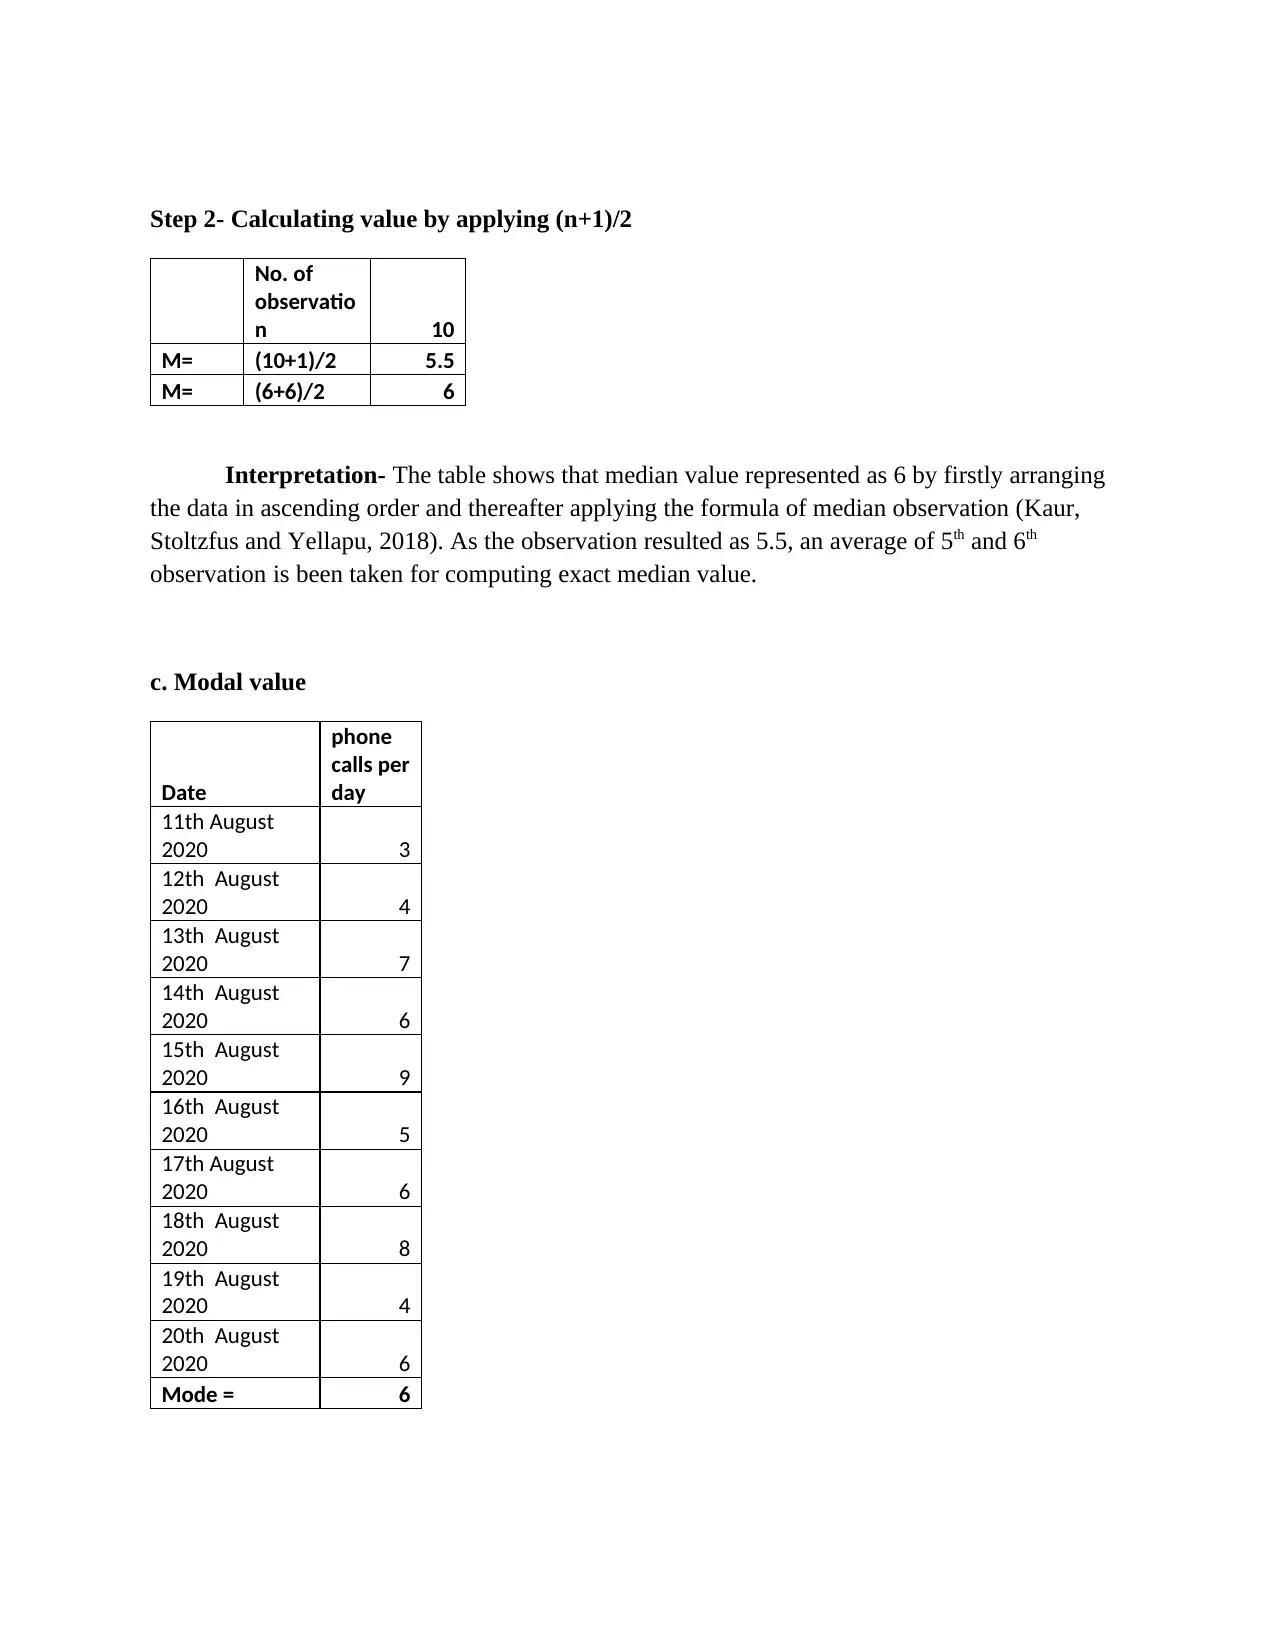
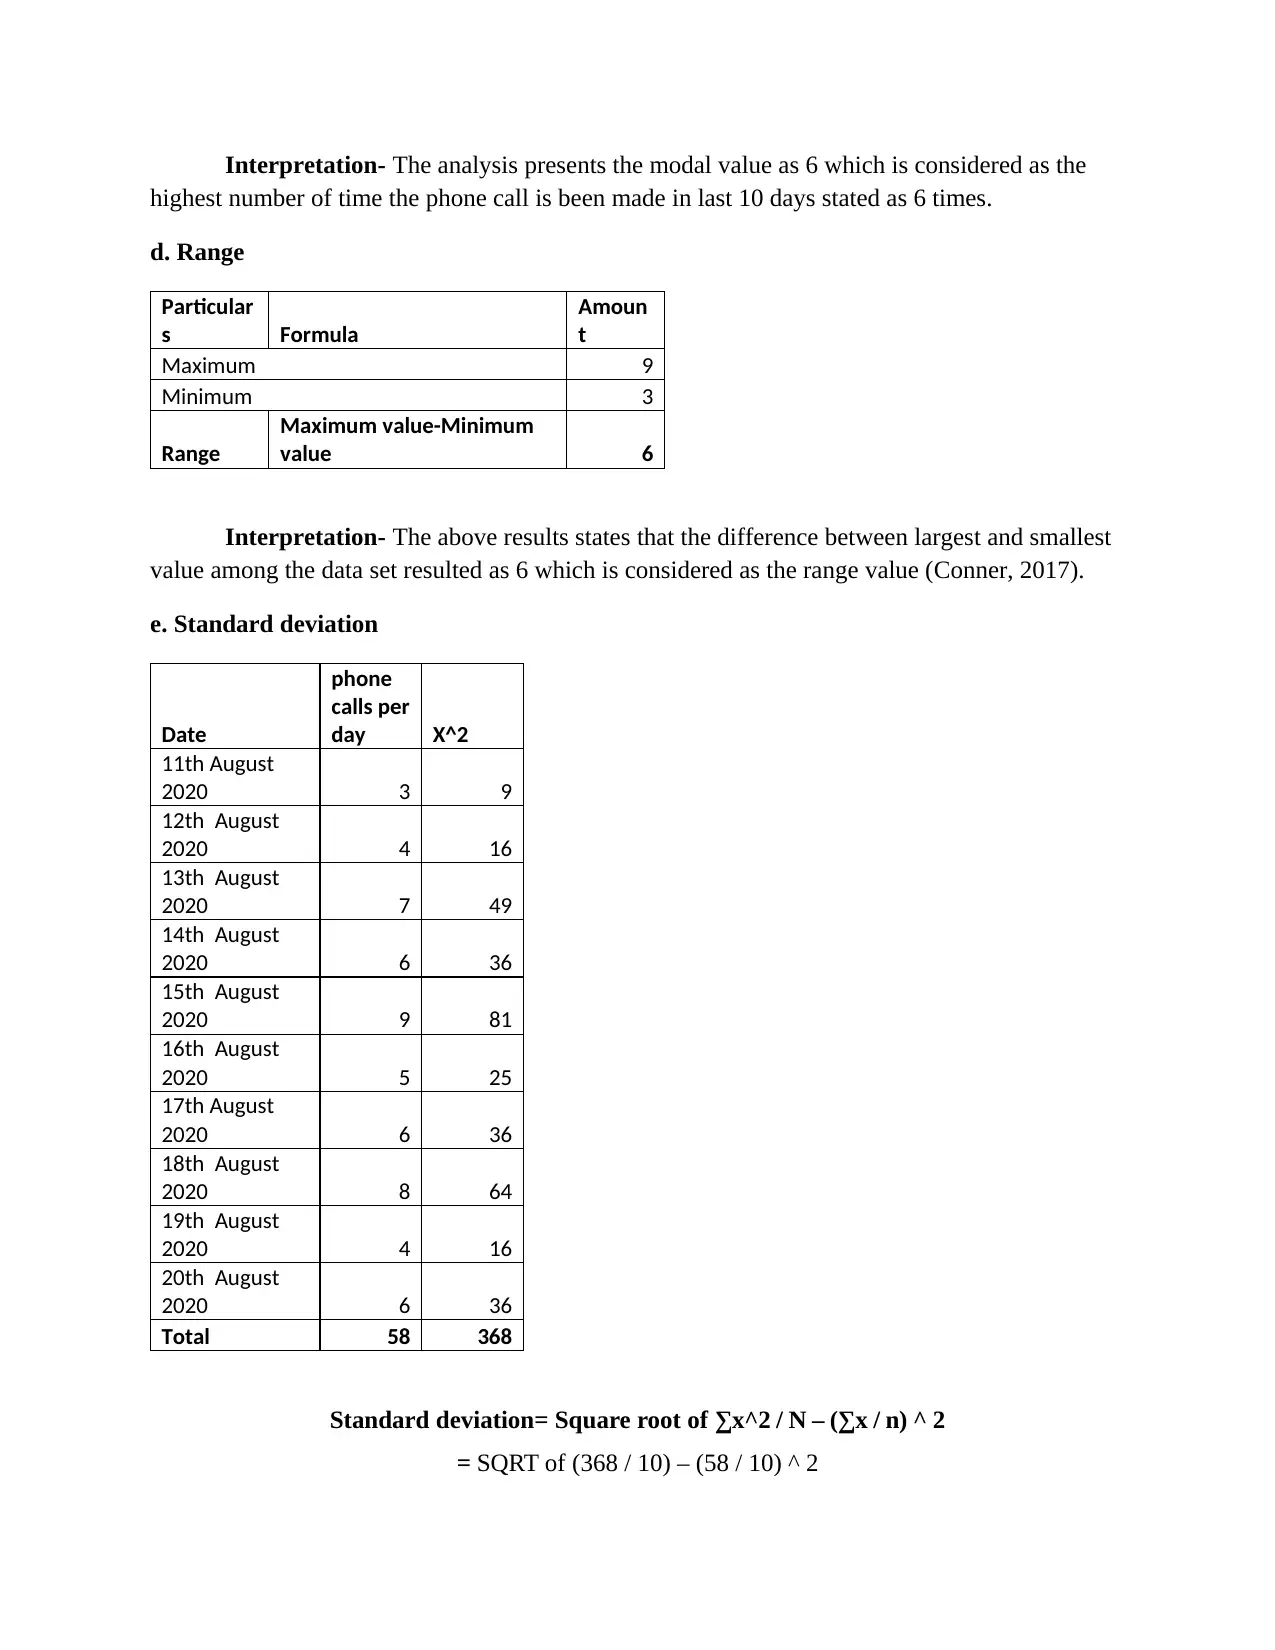
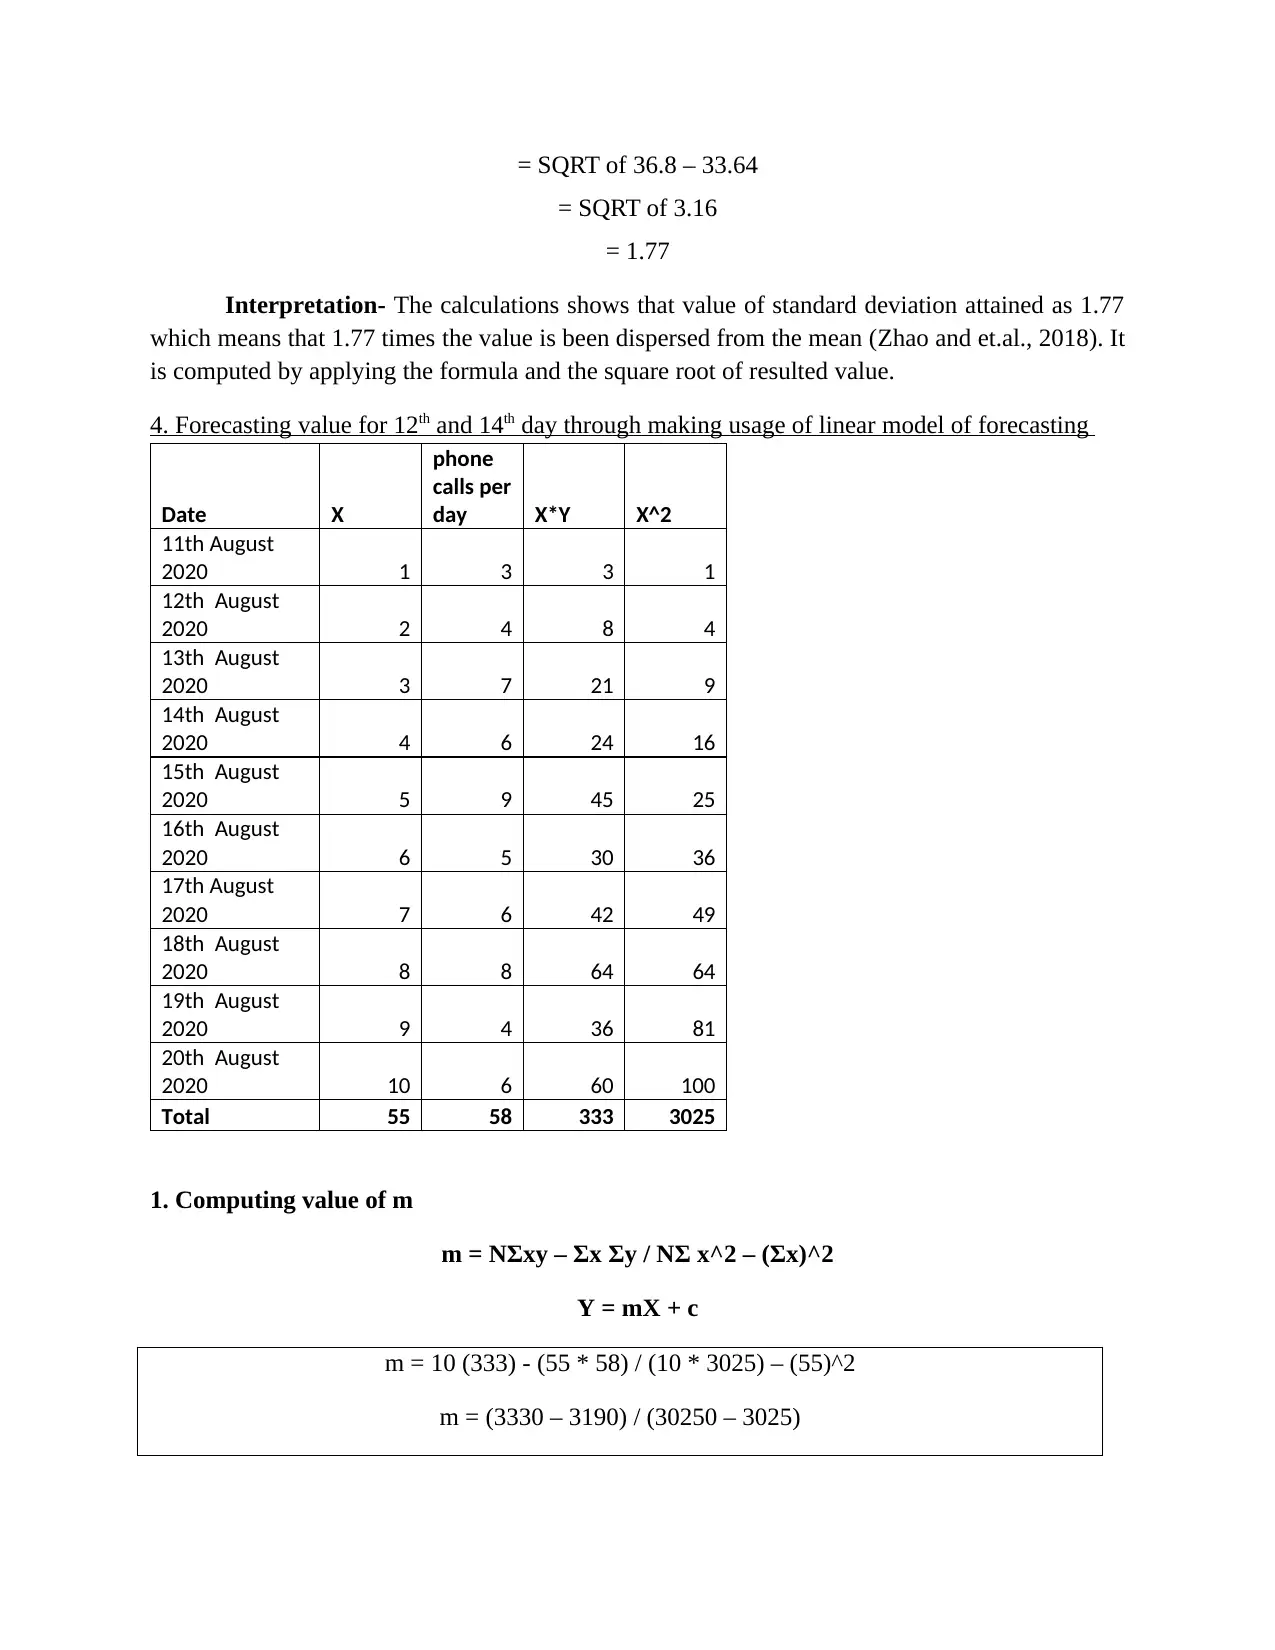
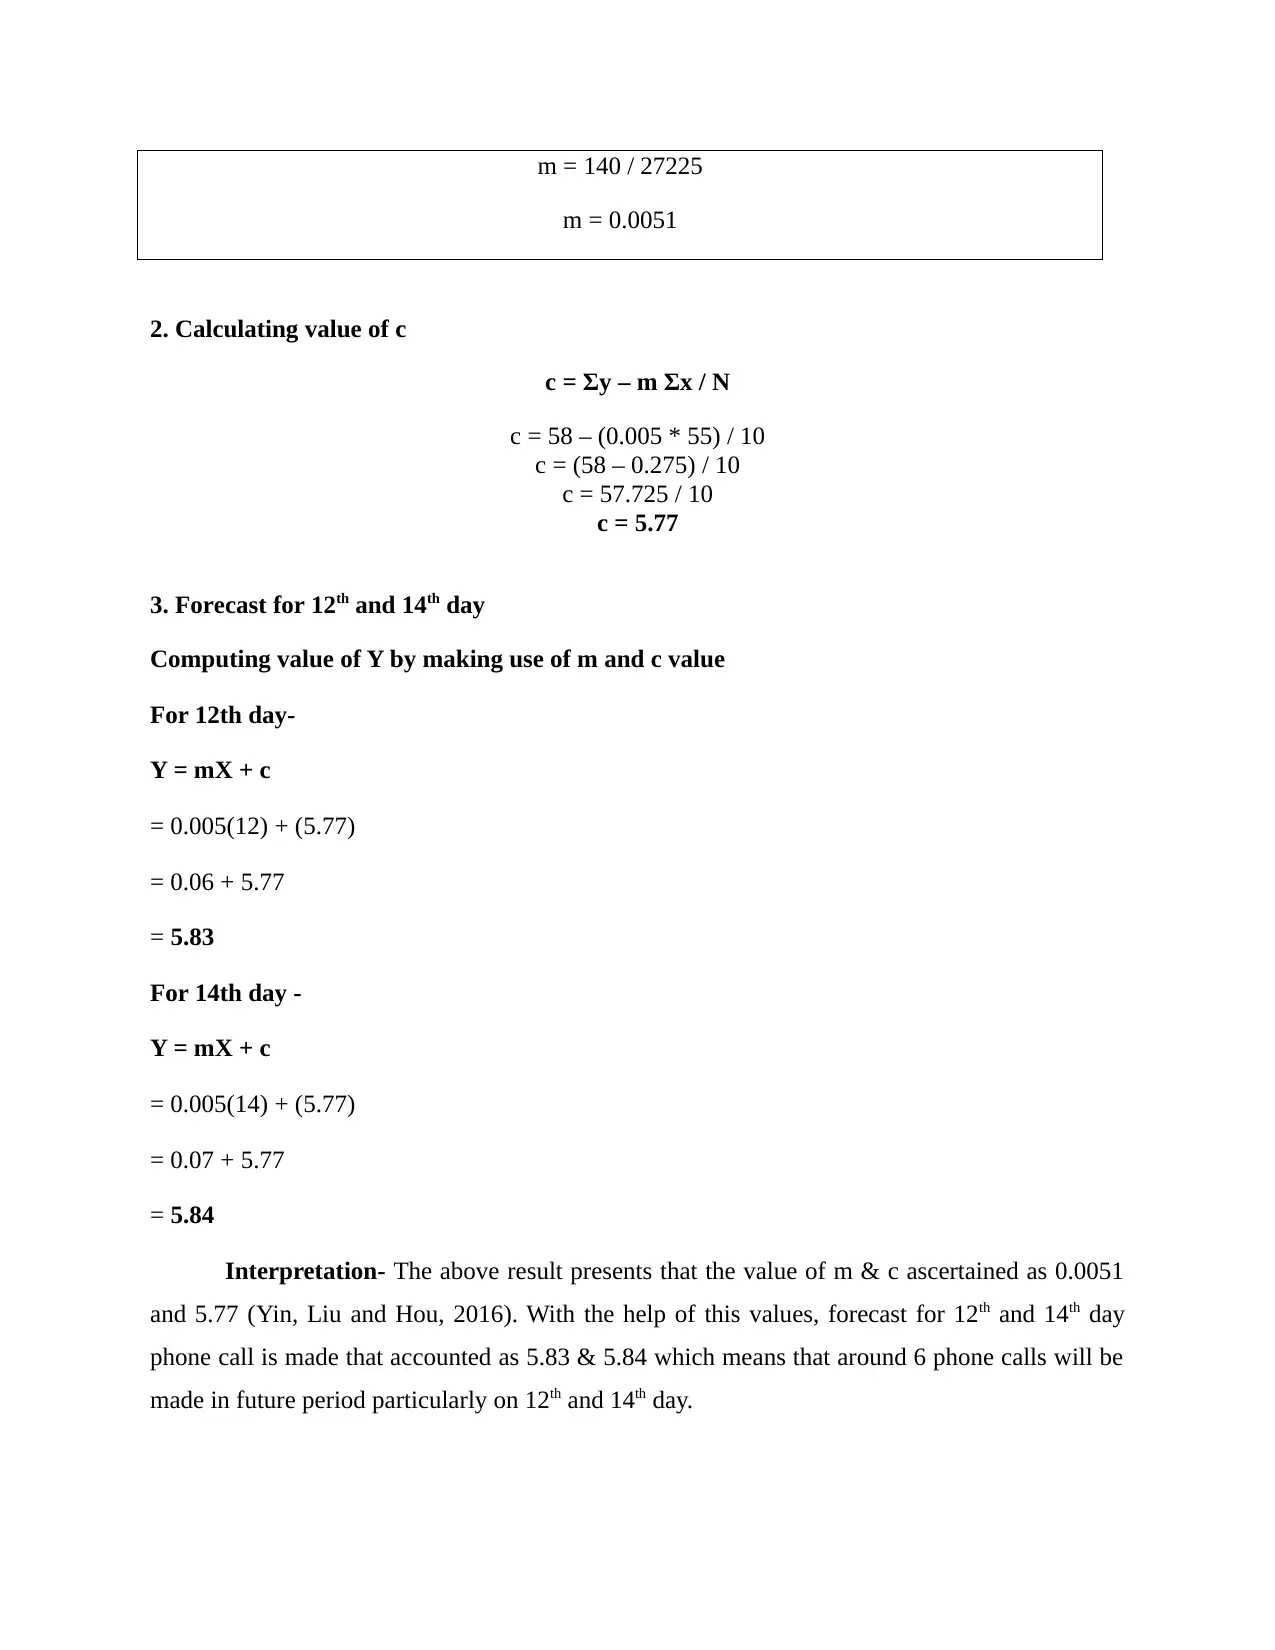
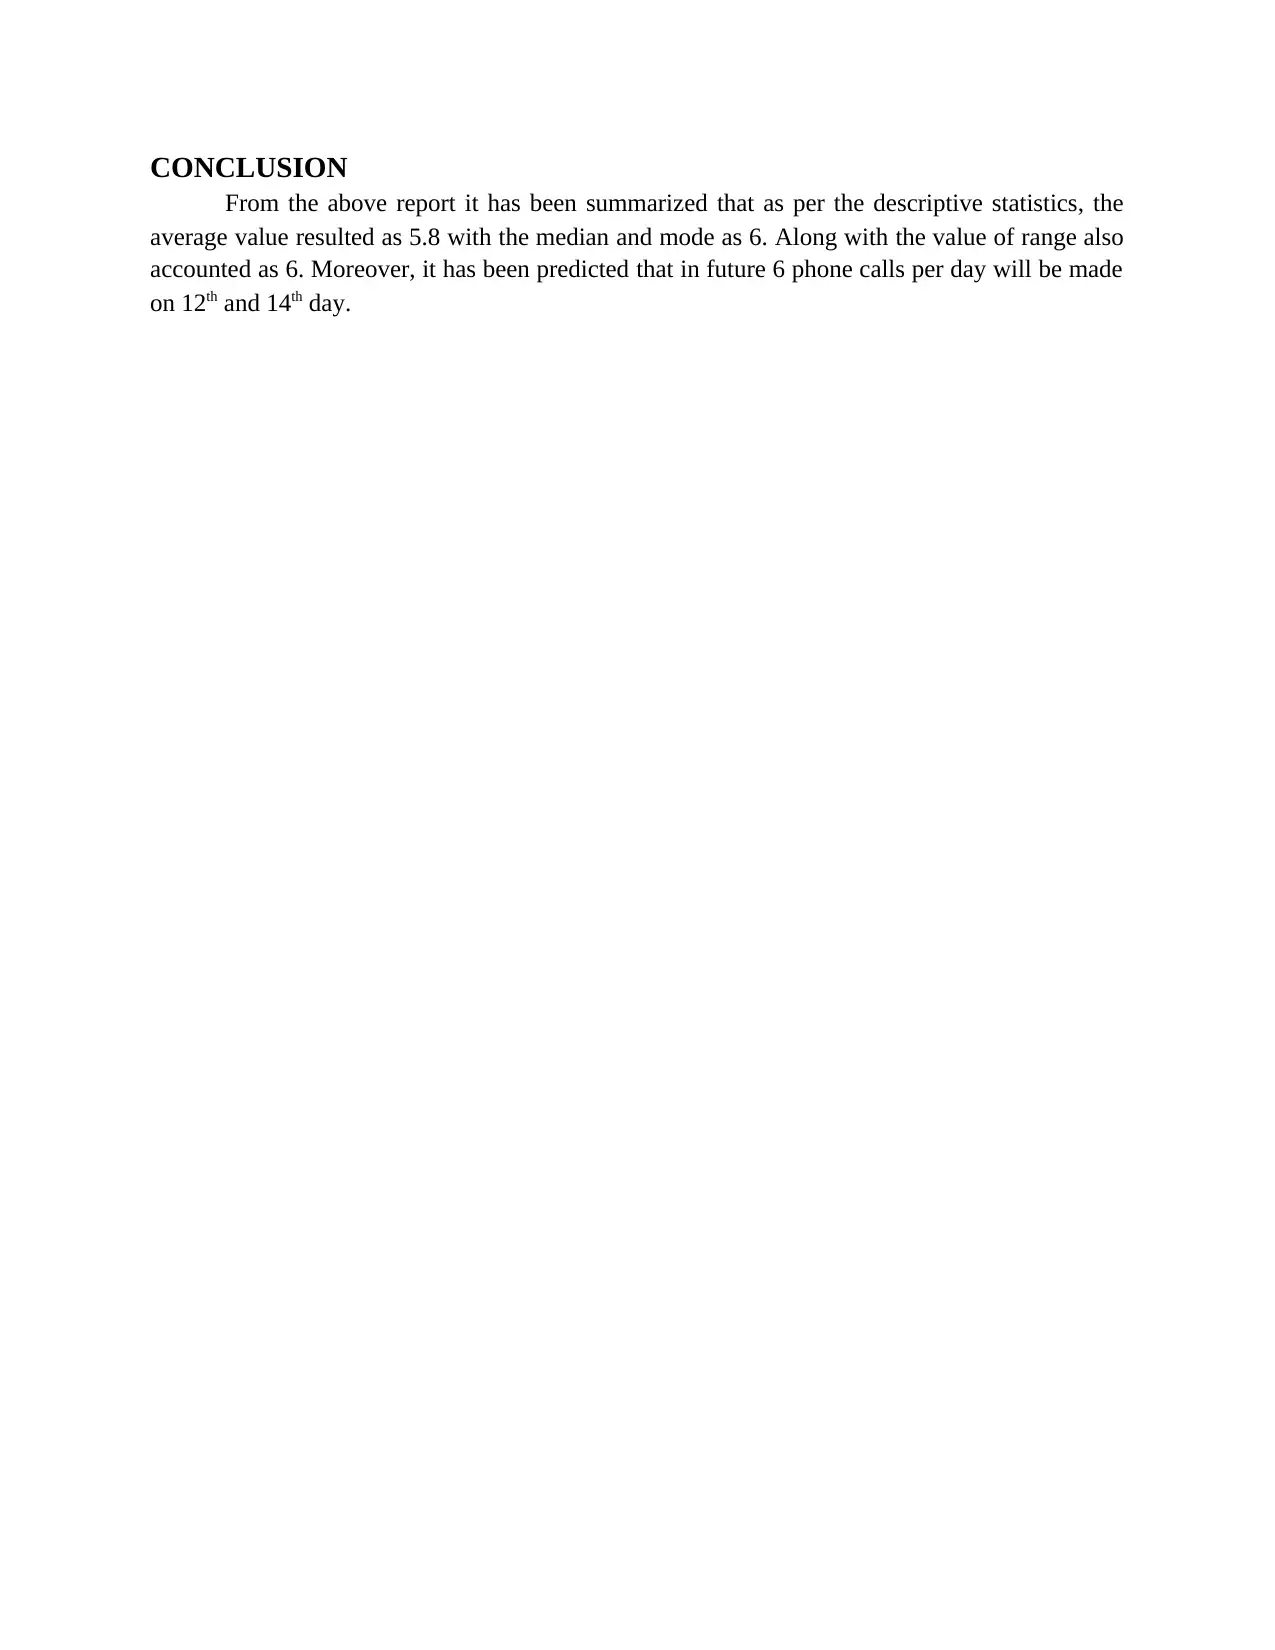
This report presents a comprehensive analysis of phone call data using various statistical techniques. It begins by presenting the data in both table and graphical formats, providing a clear visual representation of the phone calls made over a ten-day period. The report then delves into descriptive statistics, calculating the mean, median, mode, range, and standard deviation to summarize the dataset. The mean value is determined to be 5.8, representing the average number of calls per day, while the median and mode both equal 6, indicating the central tendency and most frequent occurrence, respectively. The range is calculated as 6, and the standard deviation is found to be 1.77, reflecting the data's dispersion. Furthermore, the report employs a linear model for forecasting future values, predicting phone calls for the 12th and 14th days, resulting in forecasted values of 5.83 and 5.84 respectively. The report concludes that, based on the analysis, the future phone call volume is projected to be approximately 6 calls per day. The report includes proper referencing.
tabler-icon-diamond-filled.svg

Contribute Materials

Your contribution can guide someone’s learning journey. Share your documents today.
Document Page
Numeracy and Data Analysis
tabler-icon-diamond-filled.svg

Secure Best Marks with AI Grader

Need help grading? Try our AI Grader for instant feedback on your assignments.
Document Page
INTRODUCTION...........................................................................................................................3
1. Presenting data in the table format..........................................................................................3
2. Plotting data on the graph........................................................................................................3
3. Descriptive analysis of the dataset...........................................................................................4
4. Forecasting value for 12th and 14th day through making usage of linear model of forecasting
.....................................................................................................................................................8
CONCLUSION................................................................................................................................9
REFERENCES..............................................................................................................................10
Document Page
INTRODUCTION
Numeracy and data analysis refers to the extent up-to which an individual is having the
capacity for accessing, interpreting and processing act on the numerical, graphical and
quantitative information which is required to make effective decisions relating to health. In other
words, it means as processing the data for finding useful or meaningful information which in turn
helps in decision making. The present report provides a deeper insights towards the descriptive
analysis of the data relating to the per day phone calls made. Furthermore, it involves forecasting
of the phone calls for future period in terms of specific or particular day.
1. Presenting data in the table format
Sr. No. Date
phone
calls per
day
1
11th August
2020 3
2
12th August
2020 4
3
13th August
2020 7
4
14th August
2020 6
5
15th August
2020 9
6
16th August
2020 5
7
17th August
2020 6
8
18th August
2020 8
9
19th August
2020 4
10
20th August
2020 6
2. Plotting data on the graph
Column chart
Document Page
11th August 2020
12th August 2020
13th August 2020
14th August 2020
15th August 2020
16th August 2020
17th August 2020
18th August 2020
19th August 2020
20th August 2020
0
1
2
3
4
5
6
7
8
9
10
3 4
7 6
9
5 6
8
4
6
phone calls per day
phone calls per day
Line chart
11th August 2020
12th August 2020
13th August 2020
14th August 2020
15th August 2020
16th August 2020
17th August 2020
18th August 2020
19th August 2020
20th August 2020
0
1
2
3
4
5
6
7
8
9
10
phone calls per day
phone calls per day
3. Descriptive analysis of the dataset
a. Mean value
Sr. No. Date
phone
calls per
day
1 11th August 2020 3
2 12th August 2020 4
3 13th August 2020 7
tabler-icon-diamond-filled.svg

Secure Best Marks with AI Grader

Need help grading? Try our AI Grader for instant feedback on your assignments.
Document Page
4 14th August 2020 6
5 15th August 2020 9
6 16th August 2020 5
7 17th August 2020 6
8 18th August 2020 8
9 19th August 2020 4
10 20th August 2020 6
Sum total of phone
calls 58
No. of observation 10
Mean 5.8
Interpretation- The above results reflect that value of mean accounted as 5.8 which is
determined by dividing the total observation with that of the total phone calls made (Mishra and
et.al., 2019). This is seen as an average value of the data which depicts that average phone calls
made resulted as 5.8 times in previous 10 consecutive days.
b. Median value
Step 1- Arranging the data in form of ascending order
Sr. No. Date
phone
calls per
day
1
11th August
2020 3
2
12th August
2020 4
3
19th August
2020 4
4
16th August
2020 5
5
17th August
2020 6
6
14th August
2020 6
7
20th August
2020 6
8
13th August
2020 7
9
18th August
2020 8
10
15th August
2020 9
Document Page
Step 2- Calculating value by applying (n+1)/2
No. of
observatio
n 10
M= (10+1)/2 5.5
M= (6+6)/2 6
Interpretation- The table shows that median value represented as 6 by firstly arranging
the data in ascending order and thereafter applying the formula of median observation (Kaur,
Stoltzfus and Yellapu, 2018). As the observation resulted as 5.5, an average of 5th and 6th
observation is been taken for computing exact median value.
c. Modal value
Date
phone
calls per
day
11th August
2020 3
12th August
2020 4
13th August
2020 7
14th August
2020 6
15th August
2020 9
16th August
2020 5
17th August
2020 6
18th August
2020 8
19th August
2020 4
20th August
2020 6
Mode = 6
Document Page
Interpretation- The analysis presents the modal value as 6 which is considered as the
highest number of time the phone call is been made in last 10 days stated as 6 times.
d. Range
Particular
s Formula
Amoun
t
Maximum 9
Minimum 3
Range
Maximum value-Minimum
value 6
Interpretation- The above results states that the difference between largest and smallest
value among the data set resulted as 6 which is considered as the range value (Conner, 2017).
e. Standard deviation
Date
phone
calls per
day X^2
11th August
2020 3 9
12th August
2020 4 16
13th August
2020 7 49
14th August
2020 6 36
15th August
2020 9 81
16th August
2020 5 25
17th August
2020 6 36
18th August
2020 8 64
19th August
2020 4 16
20th August
2020 6 36
Total 58 368
Standard deviation= Square root of ∑x^2 / N – (∑x / n) ^ 2
= SQRT of (368 / 10) – (58 / 10) ^ 2
tabler-icon-diamond-filled.svg

Paraphrase This Document

Need a fresh take? Get an instant paraphrase of this document with our AI Paraphraser
Document Page
= SQRT of 36.8 – 33.64
= SQRT of 3.16
= 1.77
Interpretation- The calculations shows that value of standard deviation attained as 1.77
which means that 1.77 times the value is been dispersed from the mean (Zhao and et.al., 2018). It
is computed by applying the formula and the square root of resulted value.
4. Forecasting value for 12th and 14th day through making usage of linear model of forecasting
Date X
phone
calls per
day X*Y X^2
11th August
2020 1 3 3 1
12th August
2020 2 4 8 4
13th August
2020 3 7 21 9
14th August
2020 4 6 24 16
15th August
2020 5 9 45 25
16th August
2020 6 5 30 36
17th August
2020 7 6 42 49
18th August
2020 8 8 64 64
19th August
2020 9 4 36 81
20th August
2020 10 6 60 100
Total 55 58 333 3025
1. Computing value of m
m = NΣxy – Σx Σy / NΣ x^2 – (Σx)^2
Y = mX + c
m = 10 (333) - (55 * 58) / (10 * 3025) – (55)^2
m = (3330 – 3190) / (30250 – 3025)
Document Page
m = 140 / 27225
m = 0.0051
2. Calculating value of c
c = Σy – m Σx / N
c = 58 – (0.005 * 55) / 10
c = (58 – 0.275) / 10
c = 57.725 / 10
c = 5.77
3. Forecast for 12th and 14th day
Computing value of Y by making use of m and c value
For 12th day-
Y = mX + c
= 0.005(12) + (5.77)
= 0.06 + 5.77
= 5.83
For 14th day -
Y = mX + c
= 0.005(14) + (5.77)
= 0.07 + 5.77
= 5.84
Interpretation- The above result presents that the value of m & c ascertained as 0.0051
and 5.77 (Yin, Liu and Hou, 2016). With the help of this values, forecast for 12th and 14th day
phone call is made that accounted as 5.83 & 5.84 which means that around 6 phone calls will be
made in future period particularly on 12th and 14th day.
Document Page
CONCLUSION
From the above report it has been summarized that as per the descriptive statistics, the
average value resulted as 5.8 with the median and mode as 6. Along with the value of range also
accounted as 6. Moreover, it has been predicted that in future 6 phone calls per day will be made
on 12th and 14th day.
tabler-icon-diamond-filled.svg

Secure Best Marks with AI Grader

Need help grading? Try our AI Grader for instant feedback on your assignments.
Document Page
REFERENCES
Books and journal
Conner, B., 2017. Descriptive statistics. American Nurse Today. 12(11). pp.52-55.
Kaur, P., Stoltzfus, J. and Yellapu, V., 2018. Descriptive statistics. International Journal of
Academic Medicine. 4(1). p.60.
Mishra, P. and et.al., 2019. Descriptive statistics and normality tests for statistical data. Annals
of cardiac anaesthesia. 22(1). p.67.
Yin, S., Liu, L. and Hou, J., 2016. A multivariate statistical combination forecasting method for
product quality evaluation. Information Sciences. 355. pp.229-236.
Zhao, L. T. and et.al., 2018. A novel method based on numerical fitting for oil price trend
forecasting. Applied Energy. 220. pp.154-163.
chevron_up_icon
1 out of 11
circle_padding
hide_on_mobile
zoom_out_icon
logo.png

Your All-in-One AI-Powered Toolkit for Academic Success.

Available 24*7 on WhatsApp / Email

[object Object]