Numeracy and Data Analysis: Forecasting and Data Analysis Report

Verified

Added on  2023/01/09

|10
|1331
|33
Report
AI Summary
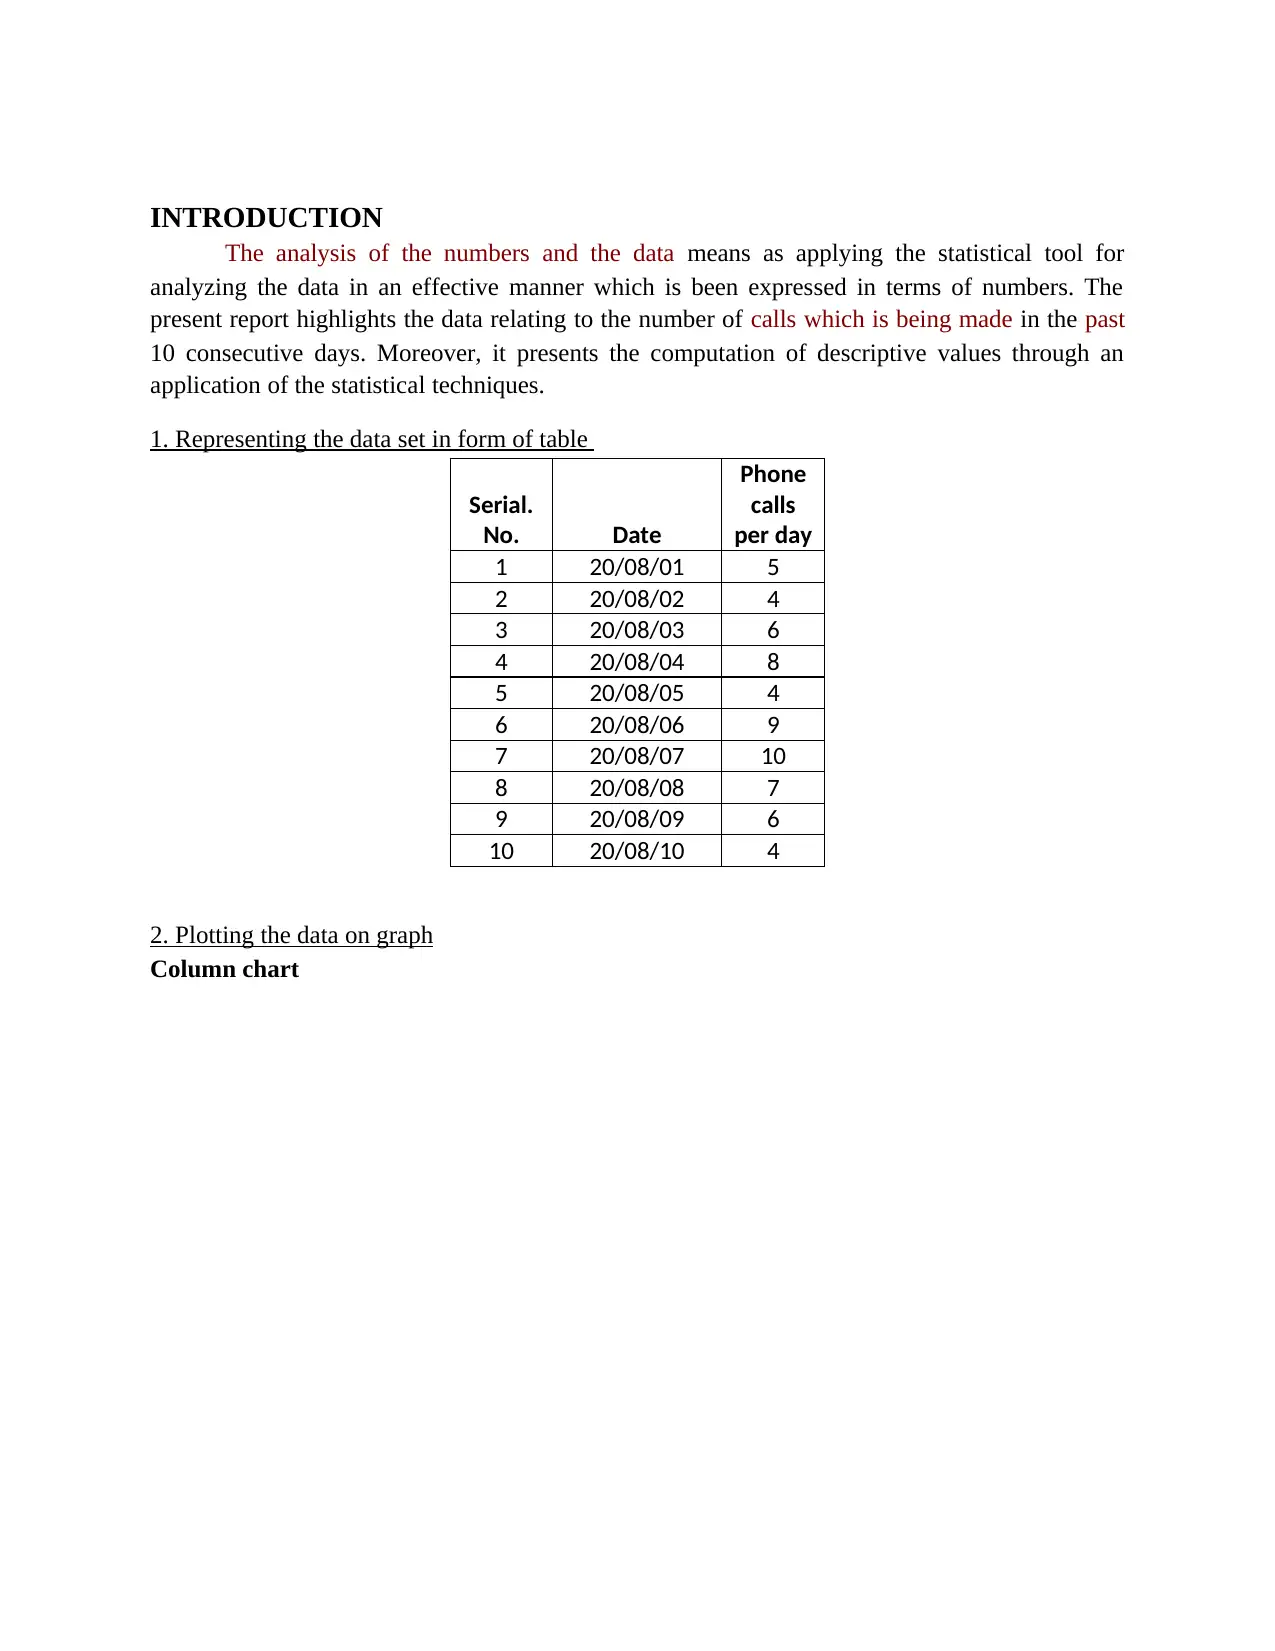
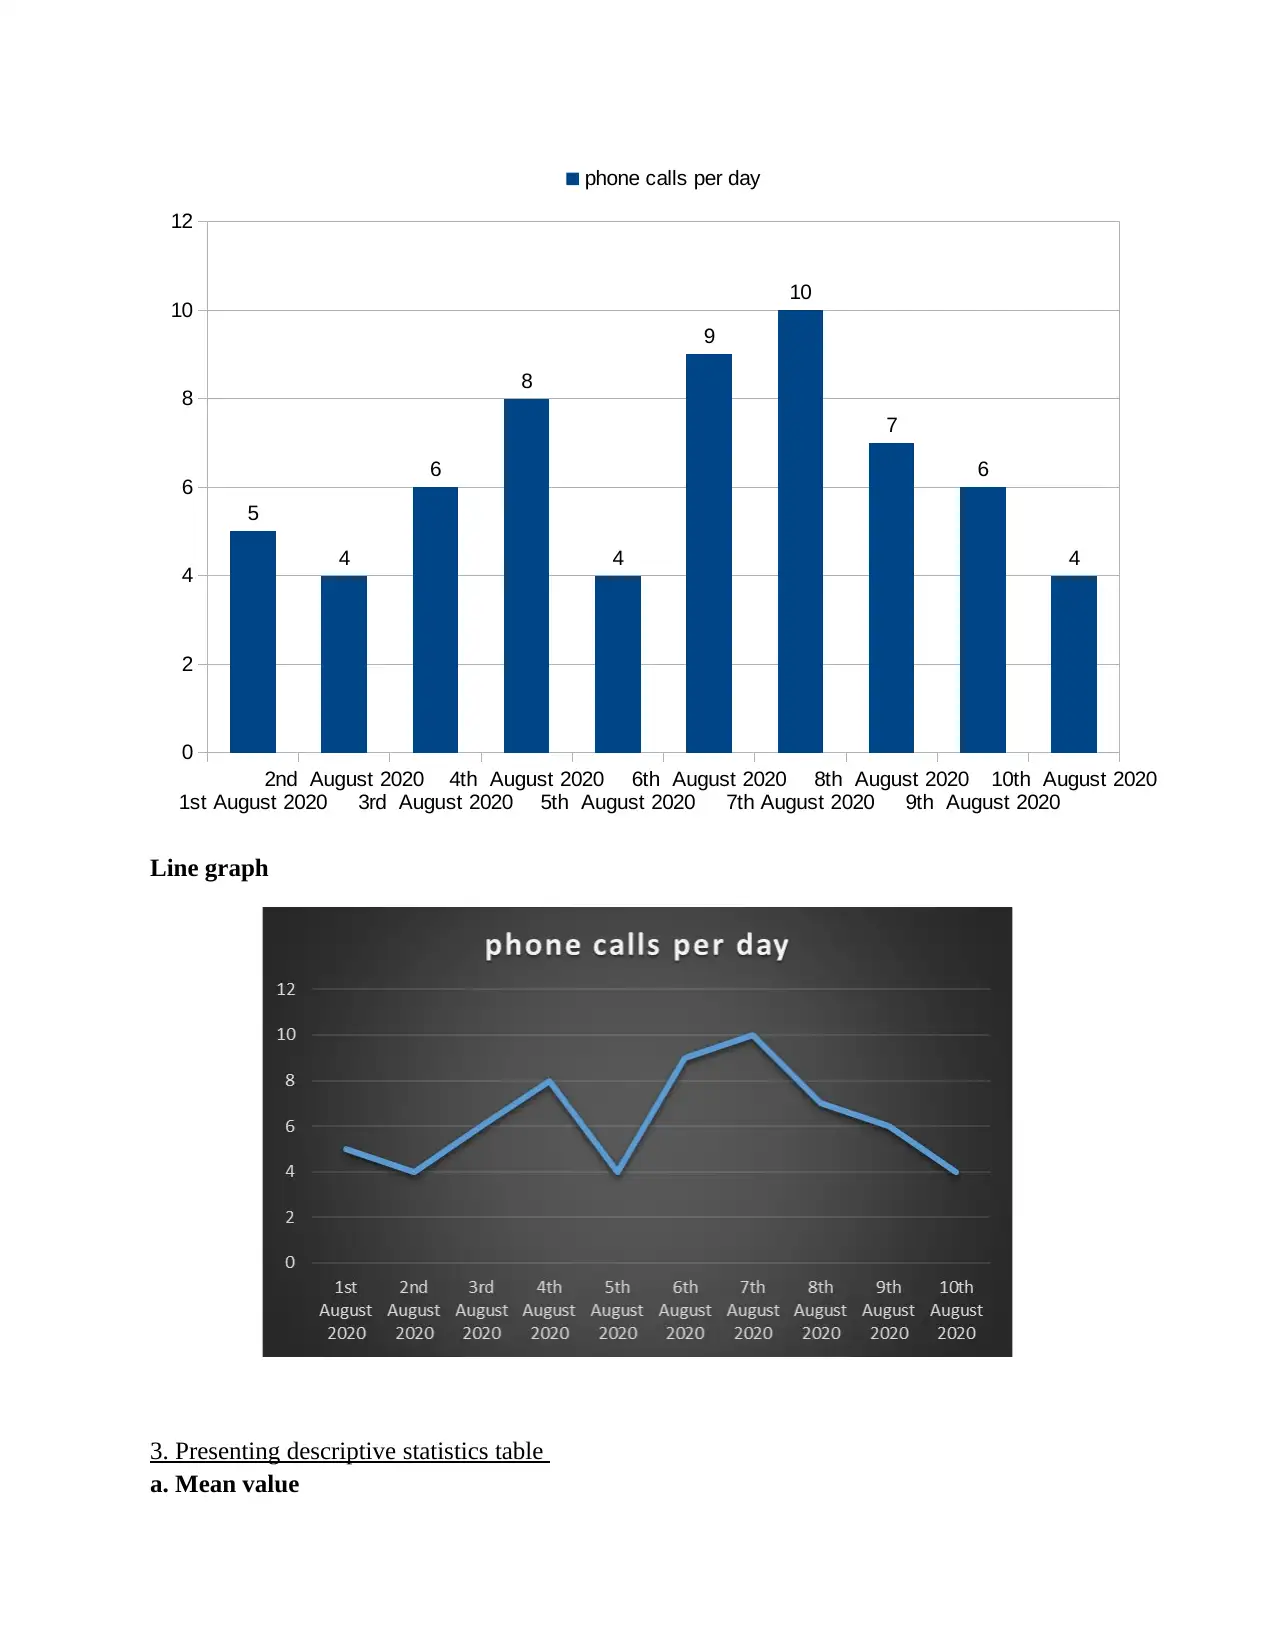
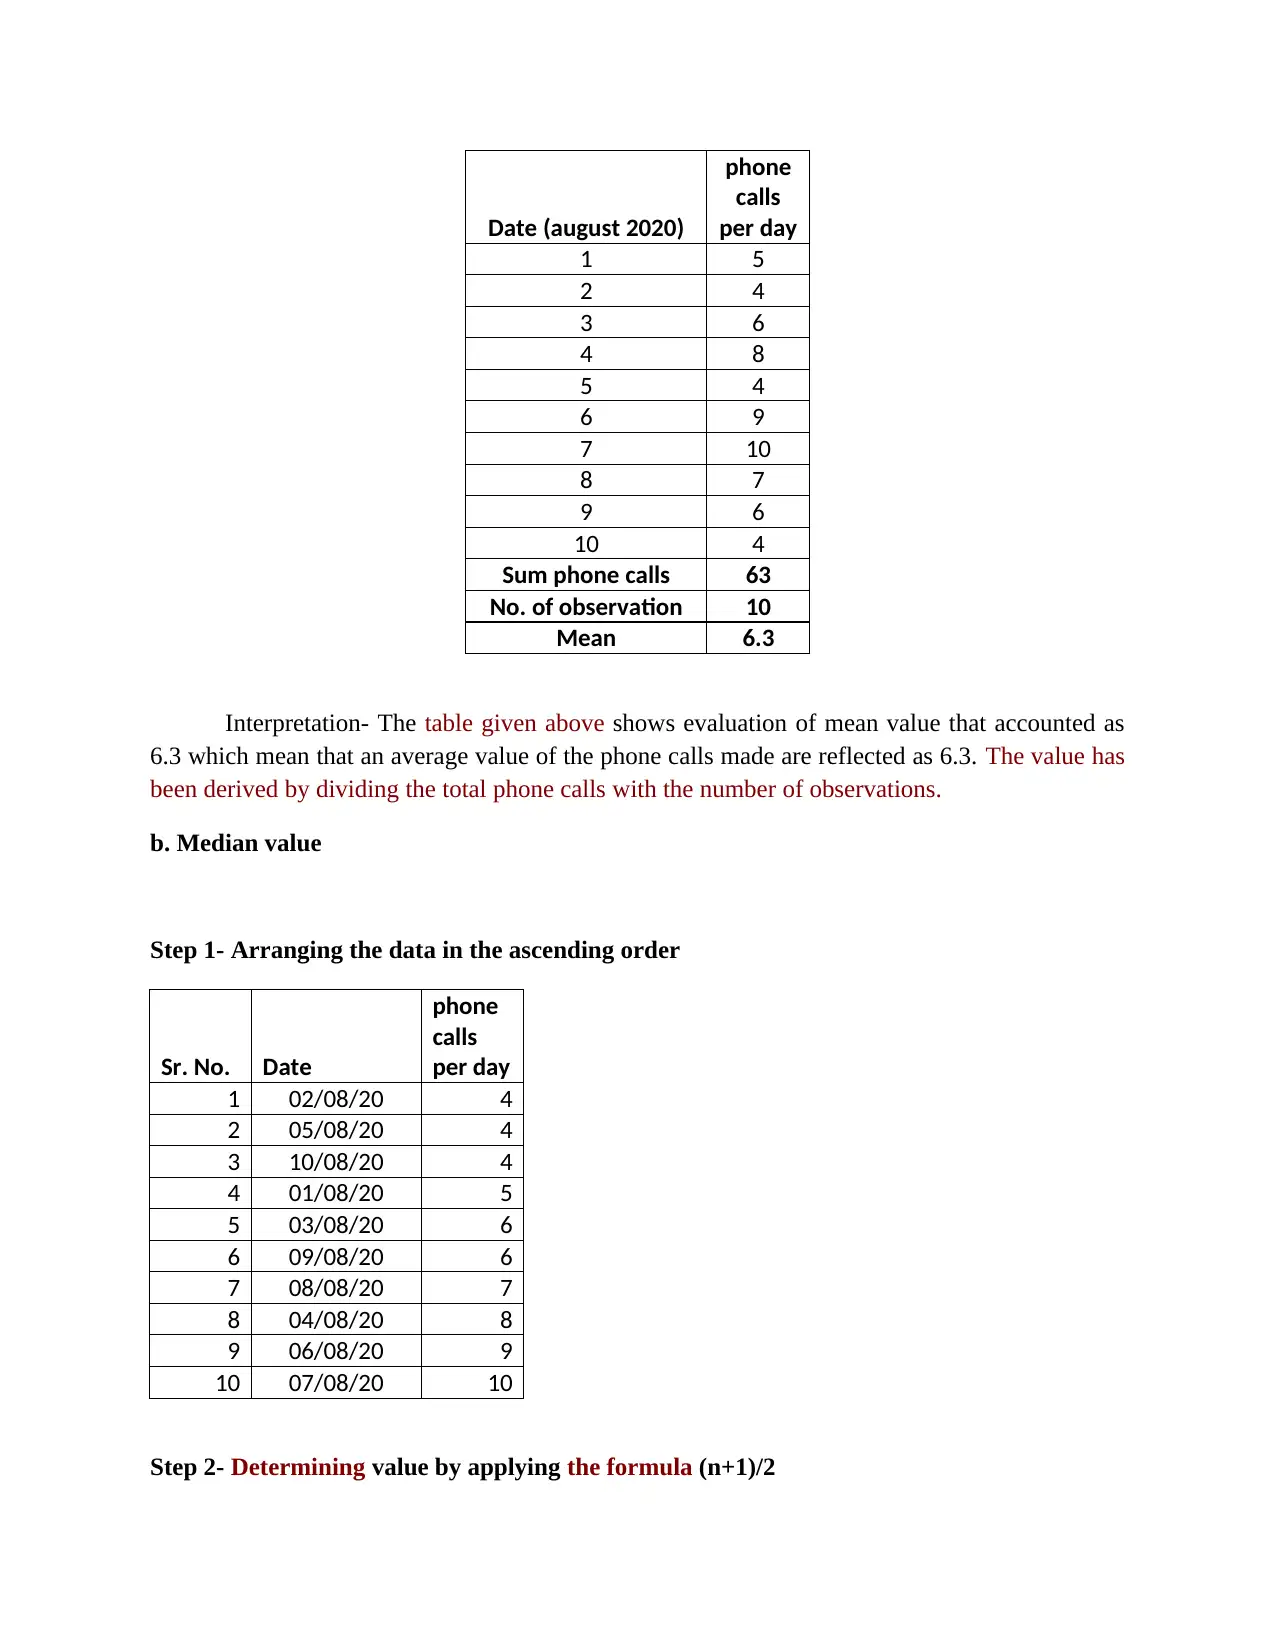
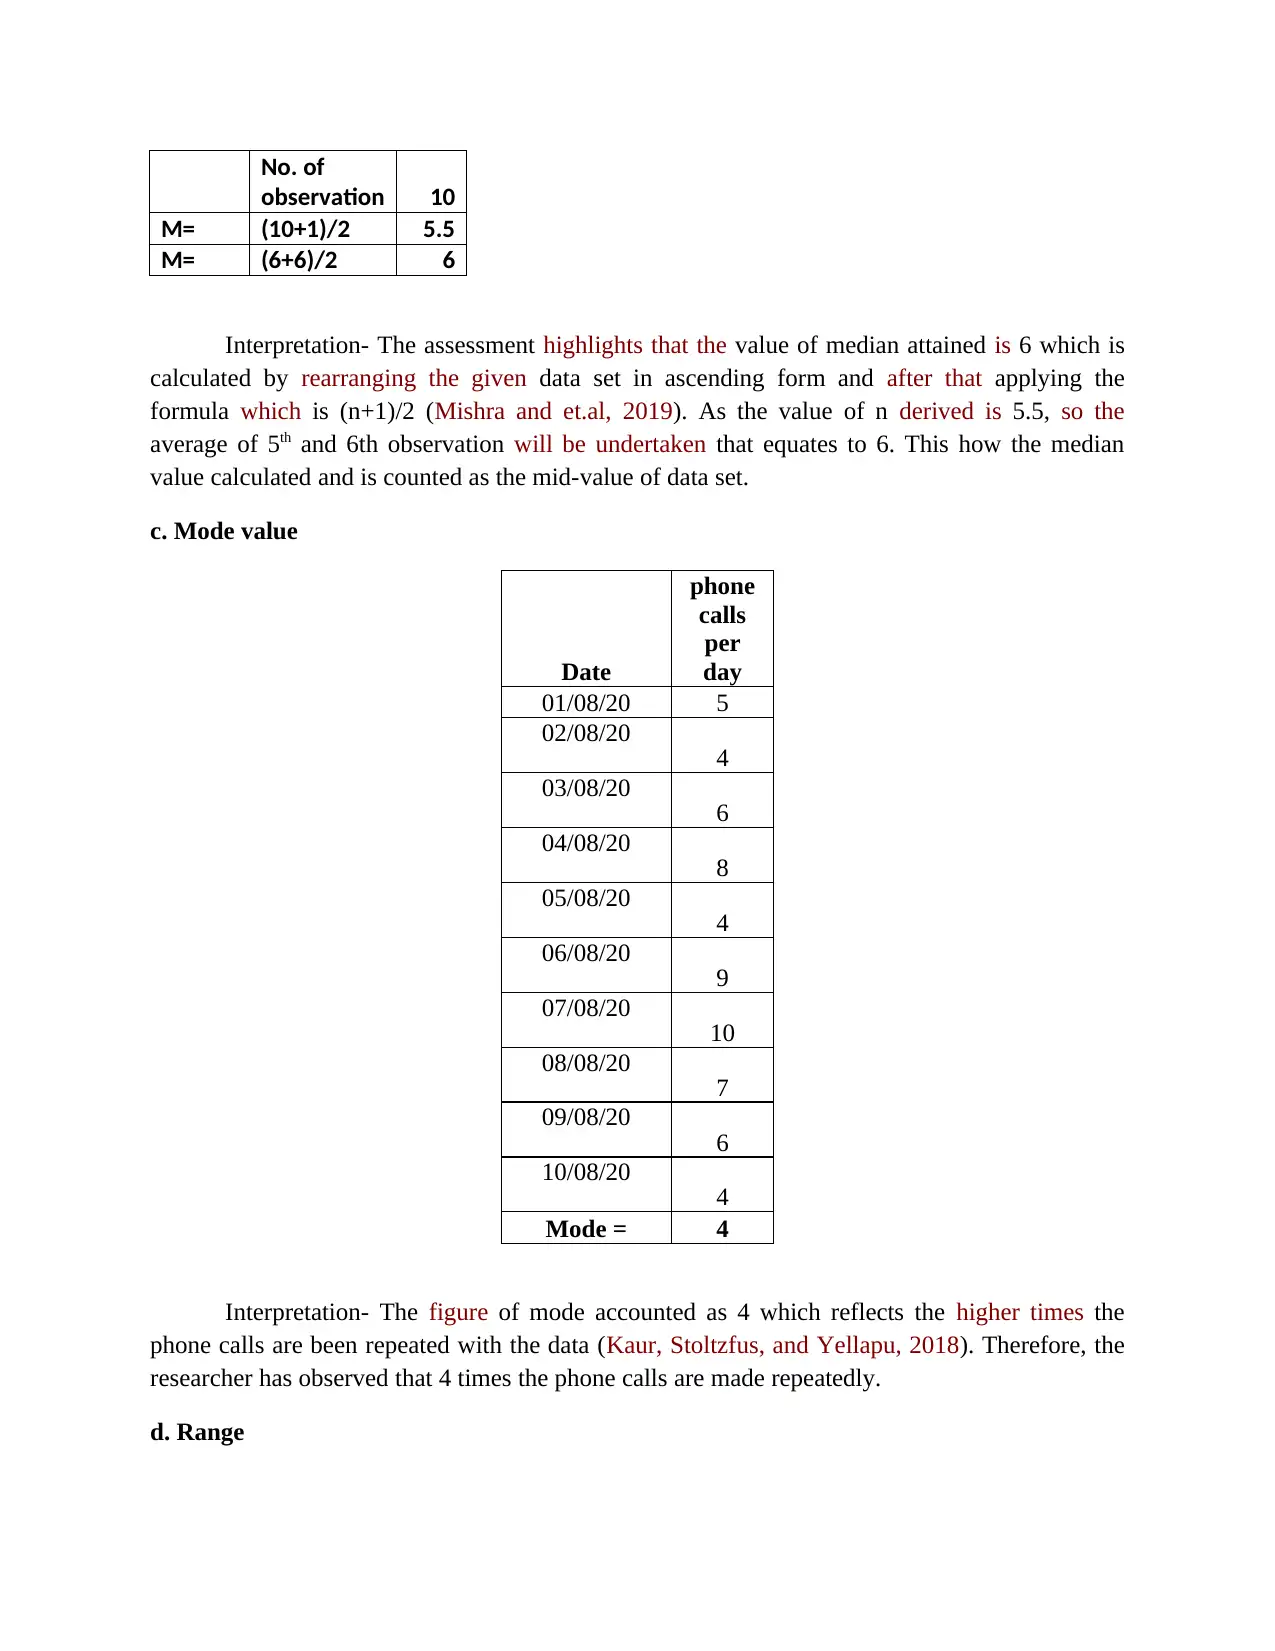
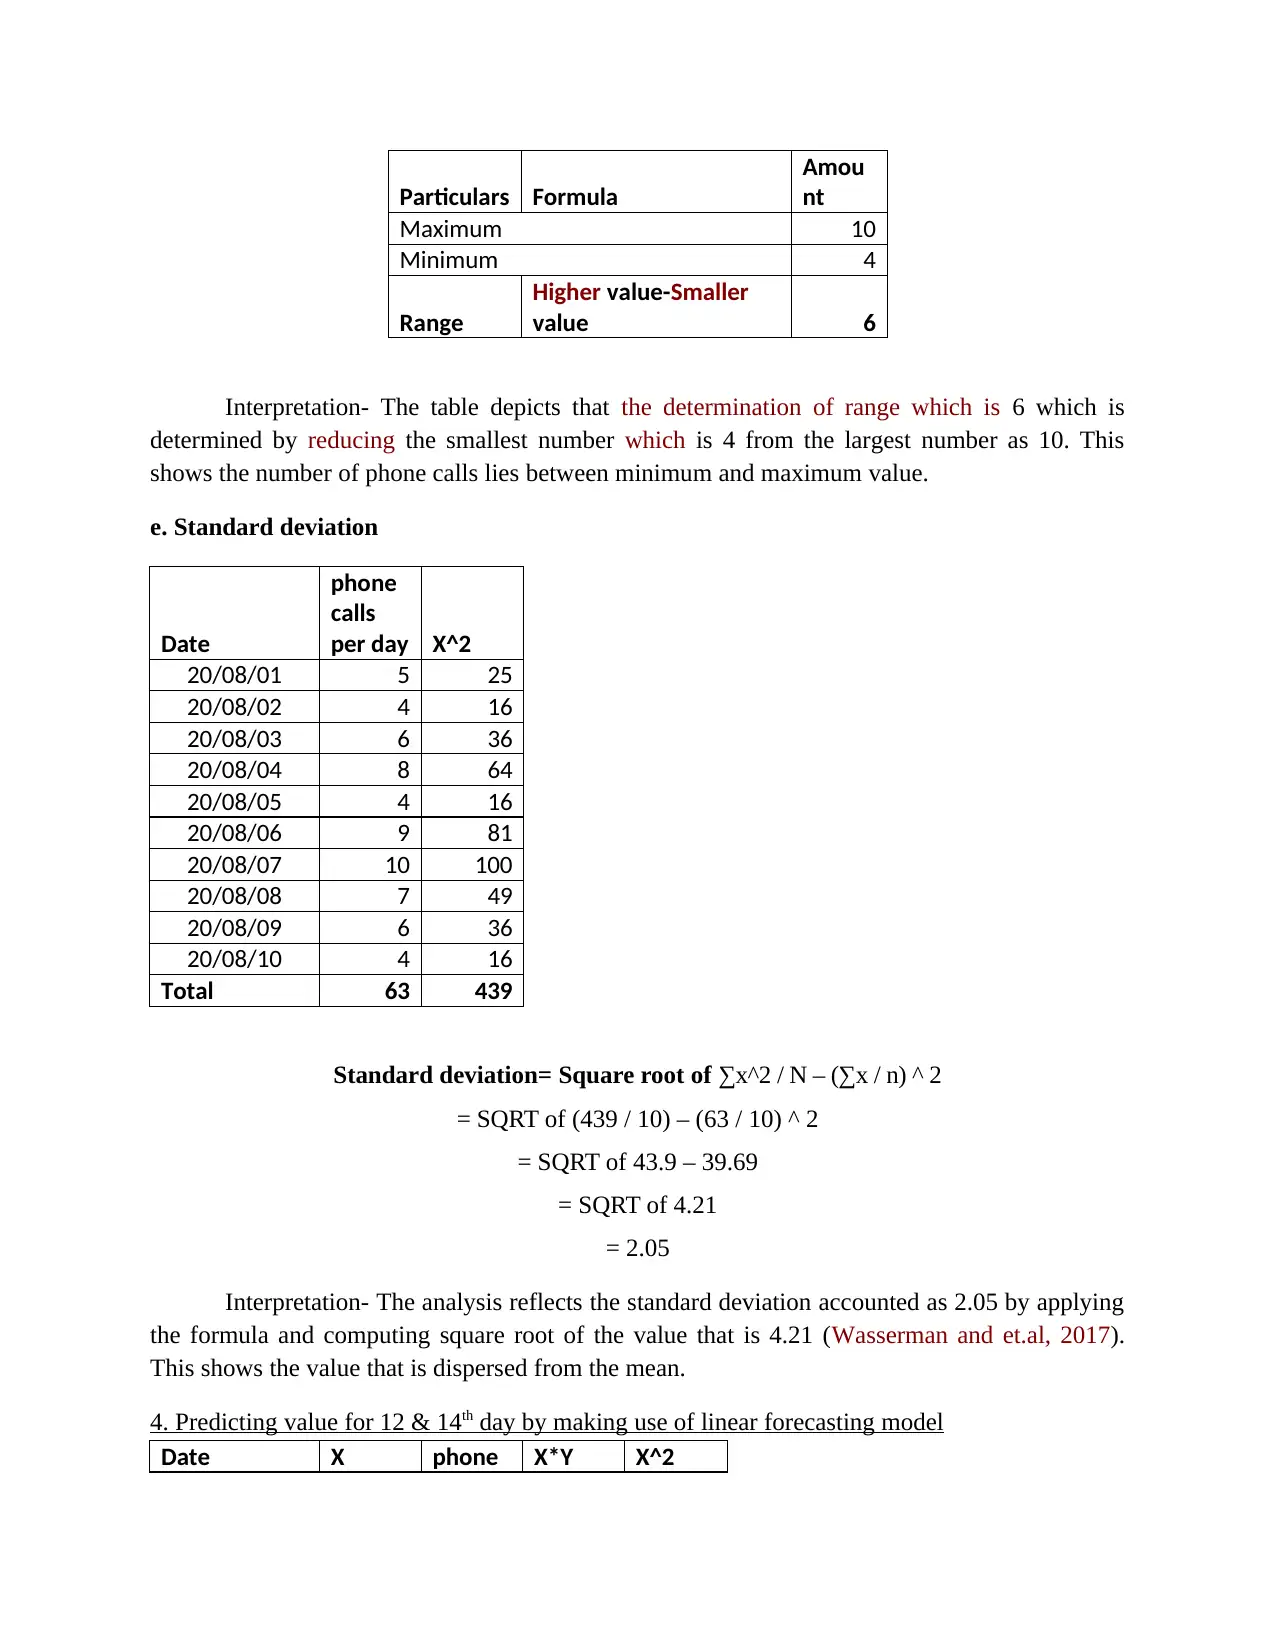
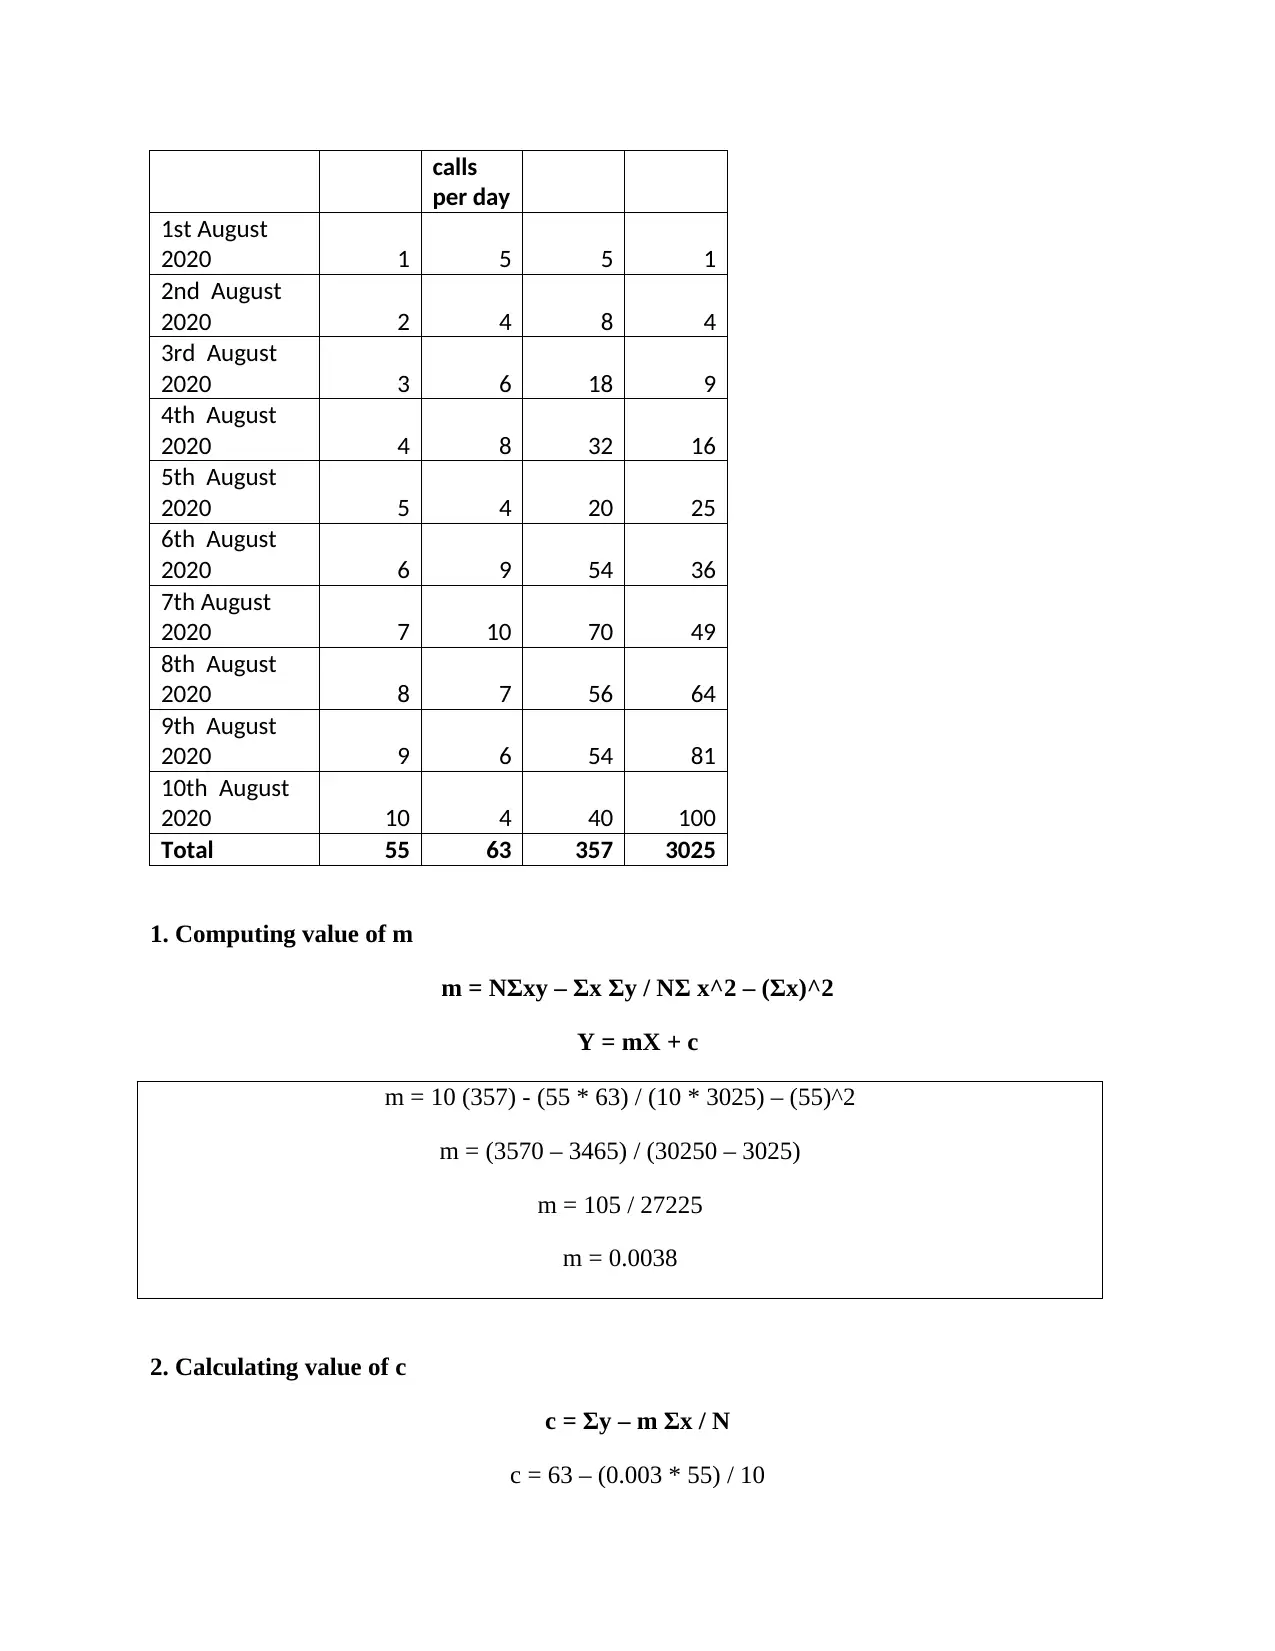
This report presents a comprehensive analysis of phone call data collected over ten consecutive days. It begins by representing the data in both tabular and graphical formats, utilizing column and line charts to visualize the trends. The analysis proceeds with the calculation of descriptive statistics, including mean, median, mode, range, and standard deviation, to provide a detailed understanding of the data's central tendencies and variability. Furthermore, the report employs a linear forecasting model to predict the number of phone calls for the 12th and 14th days, demonstrating the application of forecasting techniques. The findings are interpreted throughout, and the report concludes with a summary of the key insights and a list of cited references, ensuring a well-structured and informative presentation of the data analysis process. The report follows the assignment brief provided by the London School of Commerce, in association with the University of Suffolk, for the BABS Foundation Level module on Numeracy and Data Analysis.
Document Page
Numeracy and Data
Analysis
tabler-icon-diamond-filled.svg

Secure Best Marks with AI Grader

Need help grading? Try our AI Grader for instant feedback on your assignments.
Document Page
Table of Content
INTRODUCTION ..........................................................................................................................3
1. Representing the data set in form of table ..............................................................................3
2. Plotting the data on graph........................................................................................................3
3. Presenting descriptive statistics table .....................................................................................4
4. Predicting value for 12 & 14th day by making use of linear forecasting model.....................8
CONCLUSION .............................................................................................................................10
REFERENCES .............................................................................................................................11
Document Page
INTRODUCTION
The analysis of the numbers and the data means as applying the statistical tool for
analyzing the data in an effective manner which is been expressed in terms of numbers. The
present report highlights the data relating to the number of calls which is being made in the past
10 consecutive days. Moreover, it presents the computation of descriptive values through an
application of the statistical techniques.
1. Representing the data set in form of table
Serial.
No. Date
Phone
calls
per day
1 20/08/01 5
2 20/08/02 4
3 20/08/03 6
4 20/08/04 8
5 20/08/05 4
6 20/08/06 9
7 20/08/07 10
8 20/08/08 7
9 20/08/09 6
10 20/08/10 4
2. Plotting the data on graph
Column chart
Document Page
1st August 2020
2nd August 2020
3rd August 2020
4th August 2020
5th August 2020
6th August 2020
7th August 2020
8th August 2020
9th August 2020
10th August 2020
0
2
4
6
8
10
12
5
4
6
8
4
9
10
7
6
4
phone calls per day
Line graph
3. Presenting descriptive statistics table
a. Mean value
tabler-icon-diamond-filled.svg

Secure Best Marks with AI Grader

Need help grading? Try our AI Grader for instant feedback on your assignments.
Document Page
Date (august 2020)
phone
calls
per day
1 5
2 4
3 6
4 8
5 4
6 9
7 10
8 7
9 6
10 4
Sum phone calls 63
No. of observation 10
Mean 6.3
Interpretation- The table given above shows evaluation of mean value that accounted as
6.3 which mean that an average value of the phone calls made are reflected as 6.3. The value has
been derived by dividing the total phone calls with the number of observations.
b. Median value
Step 1- Arranging the data in the ascending order
Sr. No. Date
phone
calls
per day
1 02/08/20 4
2 05/08/20 4
3 10/08/20 4
4 01/08/20 5
5 03/08/20 6
6 09/08/20 6
7 08/08/20 7
8 04/08/20 8
9 06/08/20 9
10 07/08/20 10
Step 2- Determining value by applying the formula (n+1)/2
Document Page
No. of
observation 10
M= (10+1)/2 5.5
M= (6+6)/2 6
Interpretation- The assessment highlights that the value of median attained is 6 which is
calculated by rearranging the given data set in ascending form and after that applying the
formula which is (n+1)/2 (Mishra and et.al, 2019). As the value of n derived is 5.5, so the
average of 5th and 6th observation will be undertaken that equates to 6. This how the median
value calculated and is counted as the mid-value of data set.
c. Mode value
Date
phone
calls
per
day
01/08/20 5
02/08/20 4
03/08/20
6
04/08/20 8
05/08/20
4
06/08/20 9
07/08/20
10
08/08/20 7
09/08/20
6
10/08/20 4
Mode = 4
Interpretation- The figure of mode accounted as 4 which reflects the higher times the
phone calls are been repeated with the data (Kaur, Stoltzfus, and Yellapu, 2018). Therefore, the
researcher has observed that 4 times the phone calls are made repeatedly.
d. Range
Document Page
Particulars Formula
Amou
nt
Maximum 10
Minimum 4
Range
Higher value-Smaller
value 6
Interpretation- The table depicts that the determination of range which is 6 which is
determined by reducing the smallest number which is 4 from the largest number as 10. This
shows the number of phone calls lies between minimum and maximum value.
e. Standard deviation
Date
phone
calls
per day X^2
20/08/01 5 25
20/08/02 4 16
20/08/03 6 36
20/08/04 8 64
20/08/05 4 16
20/08/06 9 81
20/08/07 10 100
20/08/08 7 49
20/08/09 6 36
20/08/10 4 16
Total 63 439
Standard deviation= Square root of ∑x^2 / N – (∑x / n) ^ 2
= SQRT of (439 / 10) – (63 / 10) ^ 2
= SQRT of 43.9 – 39.69
= SQRT of 4.21
= 2.05
Interpretation- The analysis reflects the standard deviation accounted as 2.05 by applying
the formula and computing square root of the value that is 4.21 (Wasserman and et.al, 2017).
This shows the value that is dispersed from the mean.
4. Predicting value for 12 & 14th day by making use of linear forecasting model
Date X phone X*Y X^2
tabler-icon-diamond-filled.svg

Paraphrase This Document

Need a fresh take? Get an instant paraphrase of this document with our AI Paraphraser
Document Page
calls
per day
1st August
2020 1 5 5 1
2nd August
2020 2 4 8 4
3rd August
2020 3 6 18 9
4th August
2020 4 8 32 16
5th August
2020 5 4 20 25
6th August
2020 6 9 54 36
7th August
2020 7 10 70 49
8th August
2020 8 7 56 64
9th August
2020 9 6 54 81
10th August
2020 10 4 40 100
Total 55 63 357 3025
1. Computing value of m
m = NΣxy – Σx Σy / NΣ x^2 – (Σx)^2
Y = mX + c
m = 10 (357) - (55 * 63) / (10 * 3025) – (55)^2
m = (3570 – 3465) / (30250 – 3025)
m = 105 / 27225
m = 0.0038
2. Calculating value of c
c = Σy – m Σx / N
c = 63 – (0.003 * 55) / 10
Document Page
c = (63 – 0.165) / 10
c = 62.835 / 10
c = 6.28
3. Forecast for 12th and 14th day
Computing value of Y by making use of m and c value
For 12th day-
Y = mX + c
= 0.003(12) + (6.28)
= 0.036 + 6.28
= 6.316
For 14th day -
Y = mX + c
= 0.003(14) + (6.28)
= 0.042 + 6.28
= 6.322
Interpretation- The above results indicate that the value of m resulted as 0.003 by using
the equation by which the c value is equated as 6.28. By utilizing the figures of c and m, forecast
for the coming days is been made through an equation that is y= mX + c (Liu, Gu and Peng,
2017). Therefore, it has been observed that for 12th day around 6.316 phone calls are estimated
and for 14th day approx 6.322 phone calls are anticipated.
CONCLUSION
From the above report it has been summarized that descriptive values helps in analyzing
the average, mid and repeated value for which the phone calls would be made. Moreover, it also
helps in predicting the number of time the phone calls will be made for the 12th and 14th day.
Document Page
REFERENCES
Books and journal
Kaur, P., Stoltzfus, J. and Yellapu, V., 2018. Descriptive statistics. International Journal of
Academic Medicine. 4(1). p.60.
Liu, S., Gu, S. and Peng, J., 2017. Self-adaptive processing and forecasting algorithm for
univariate linear time series. Chinese Journal of Electronics. 26(6). pp.1147-1153.
Mishra, P. and et.al, 2019. Descriptive statistics and normality tests for statistical data. Annals of
cardiac anaesthesia. 22(1). p.67.
Wasserman, N. H. and et.al, 2017. Statistics as unbiased estimators: exploring the teaching of
standard deviation. Research in Mathematics Education. 19(3). pp.236-256.
chevron_up_icon
1 out of 10
circle_padding
hide_on_mobile
zoom_out_icon
logo.png

Your All-in-One AI-Powered Toolkit for Academic Success.

Available 24*7 on WhatsApp / Email

[object Object]