Data Analysis and Forecasting Assignment - LSC University of Suffolk
VerifiedAdded on 2023/01/17
|11
|1540
|37
Homework Assignment
AI Summary
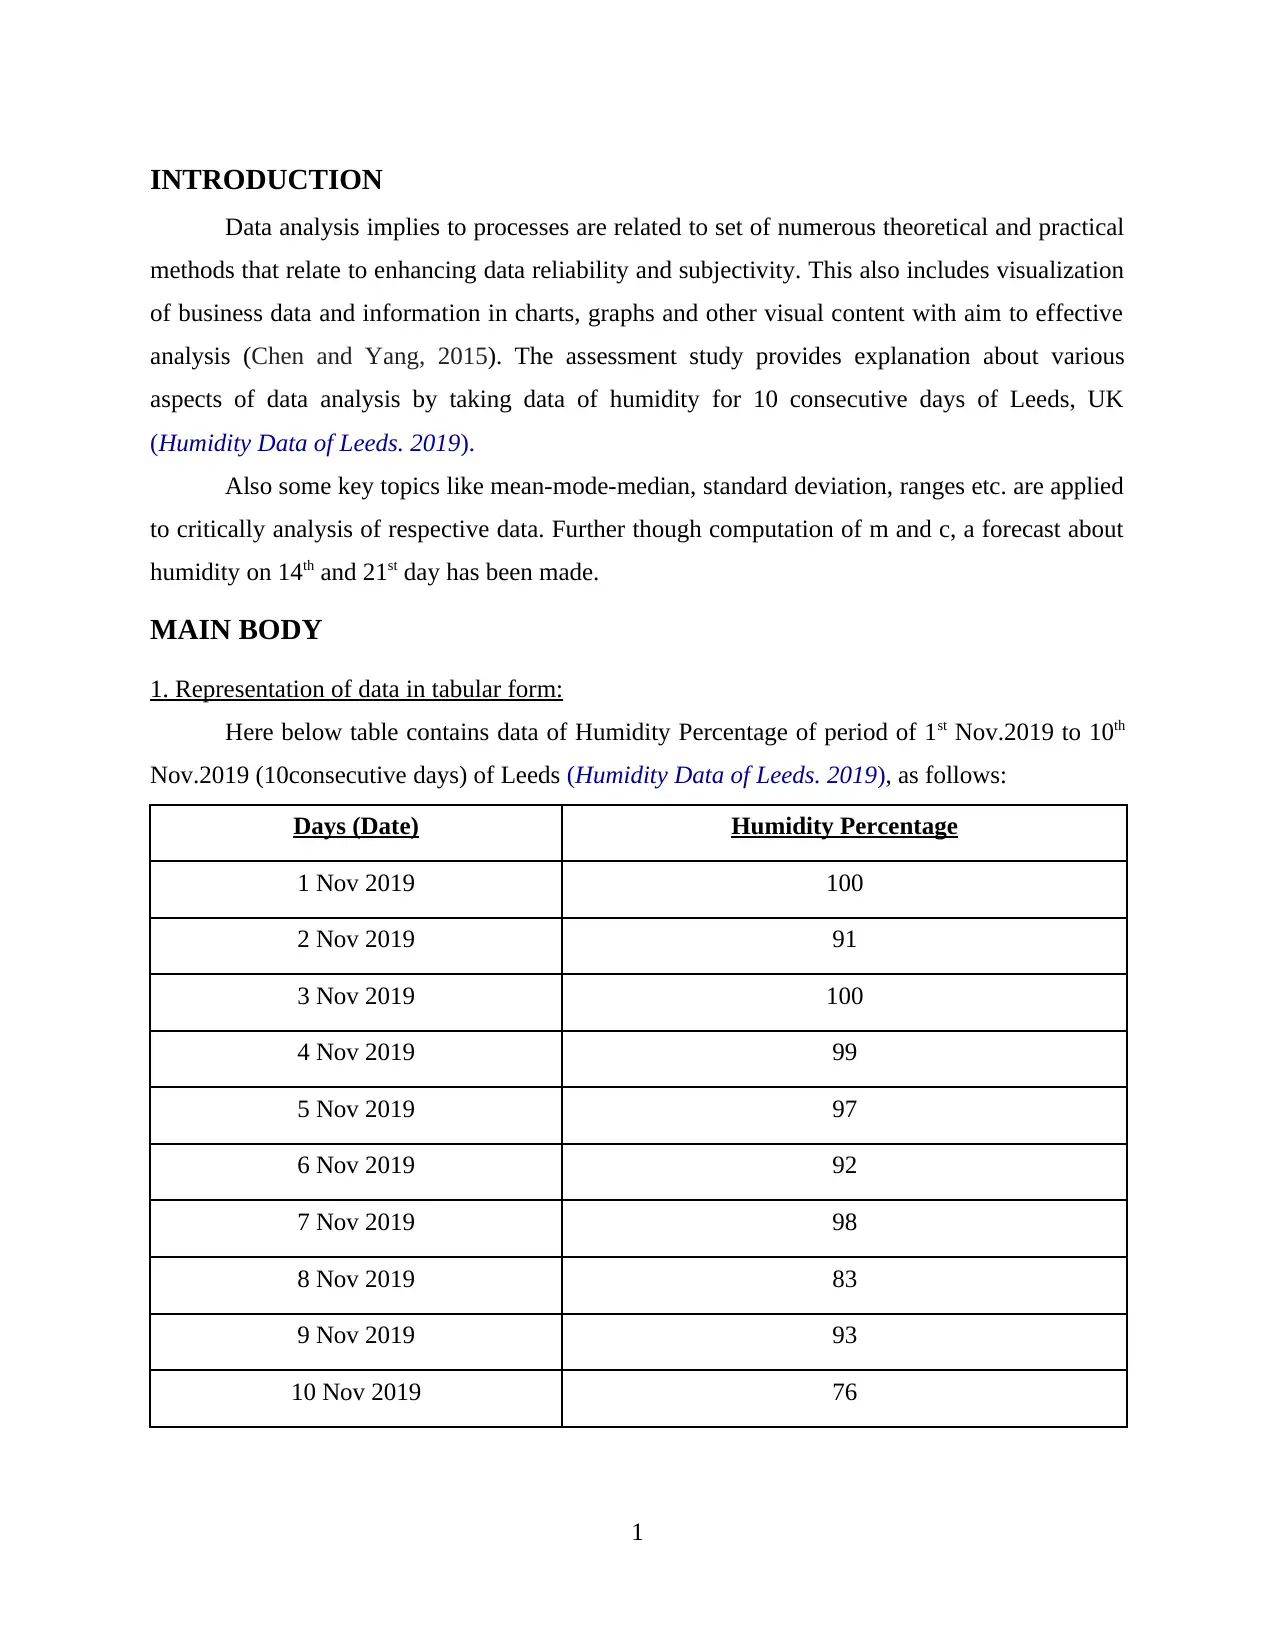
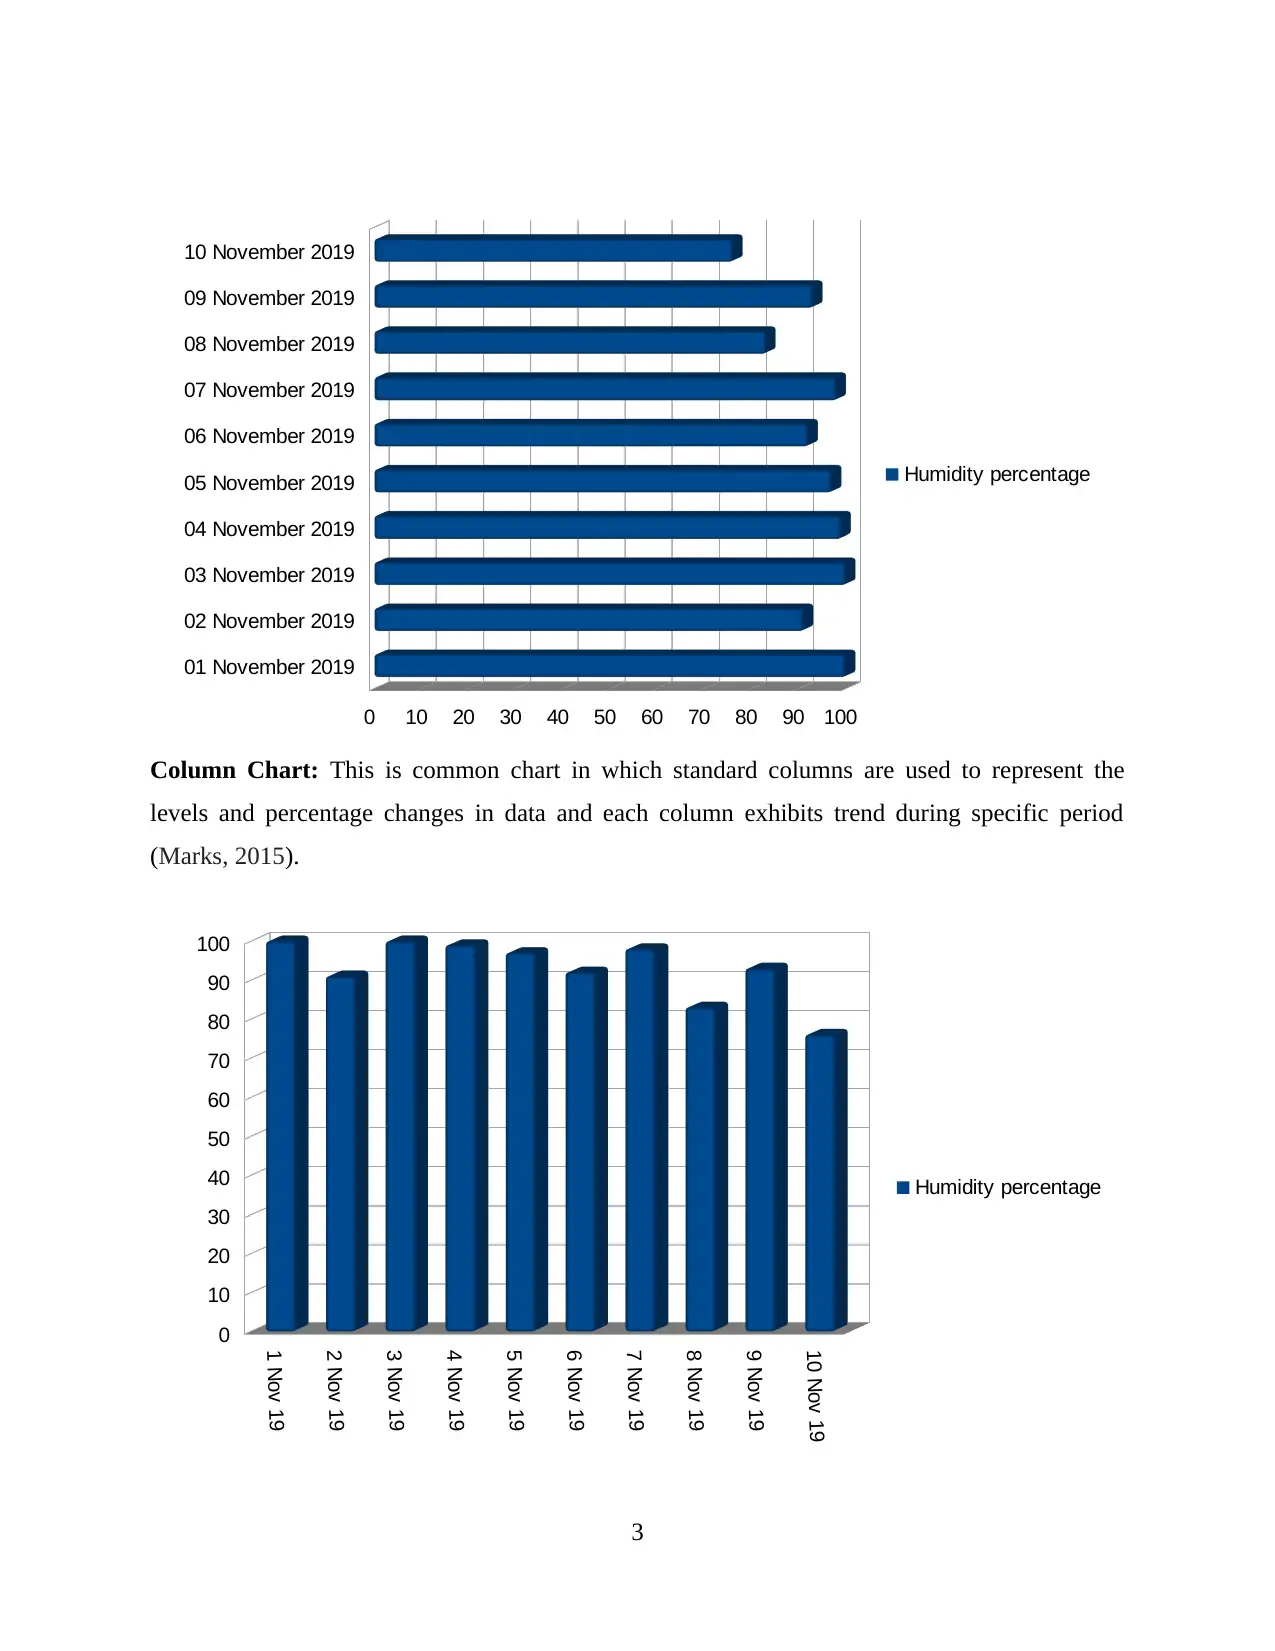
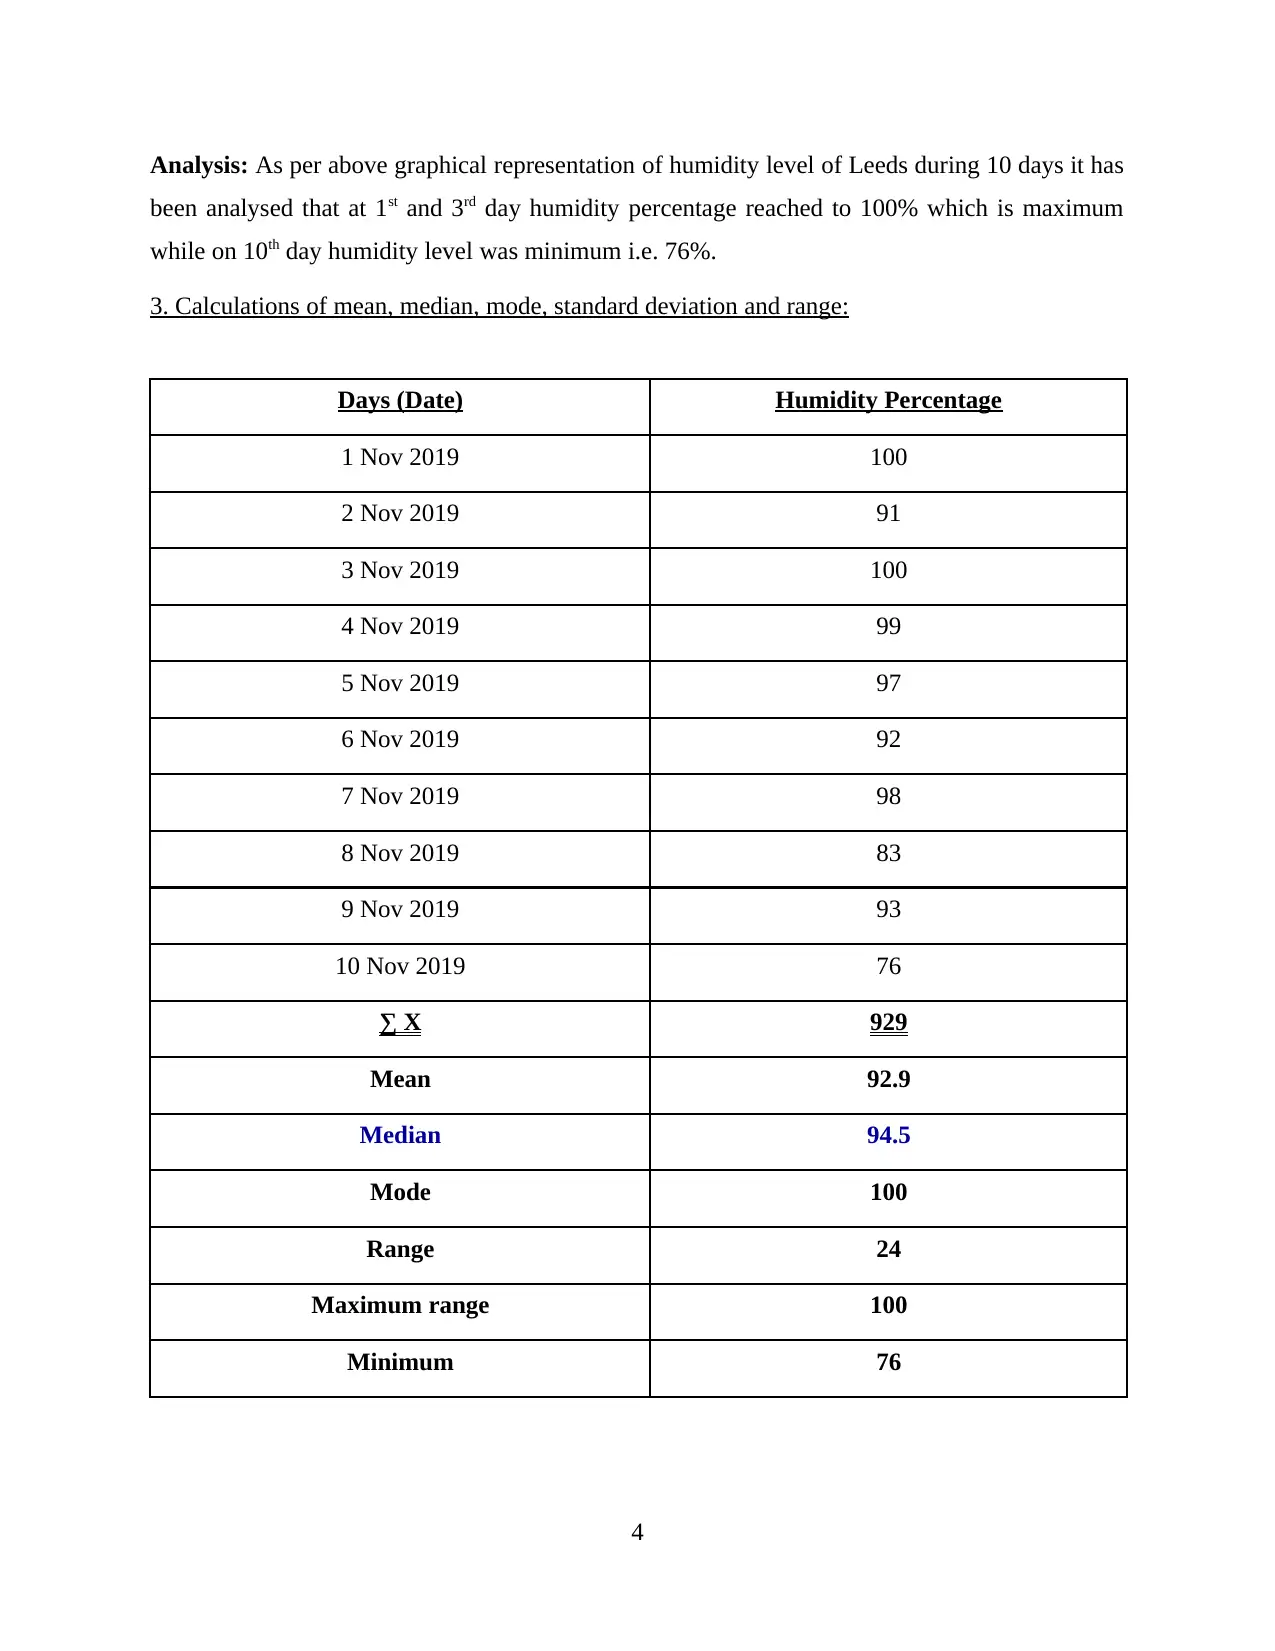
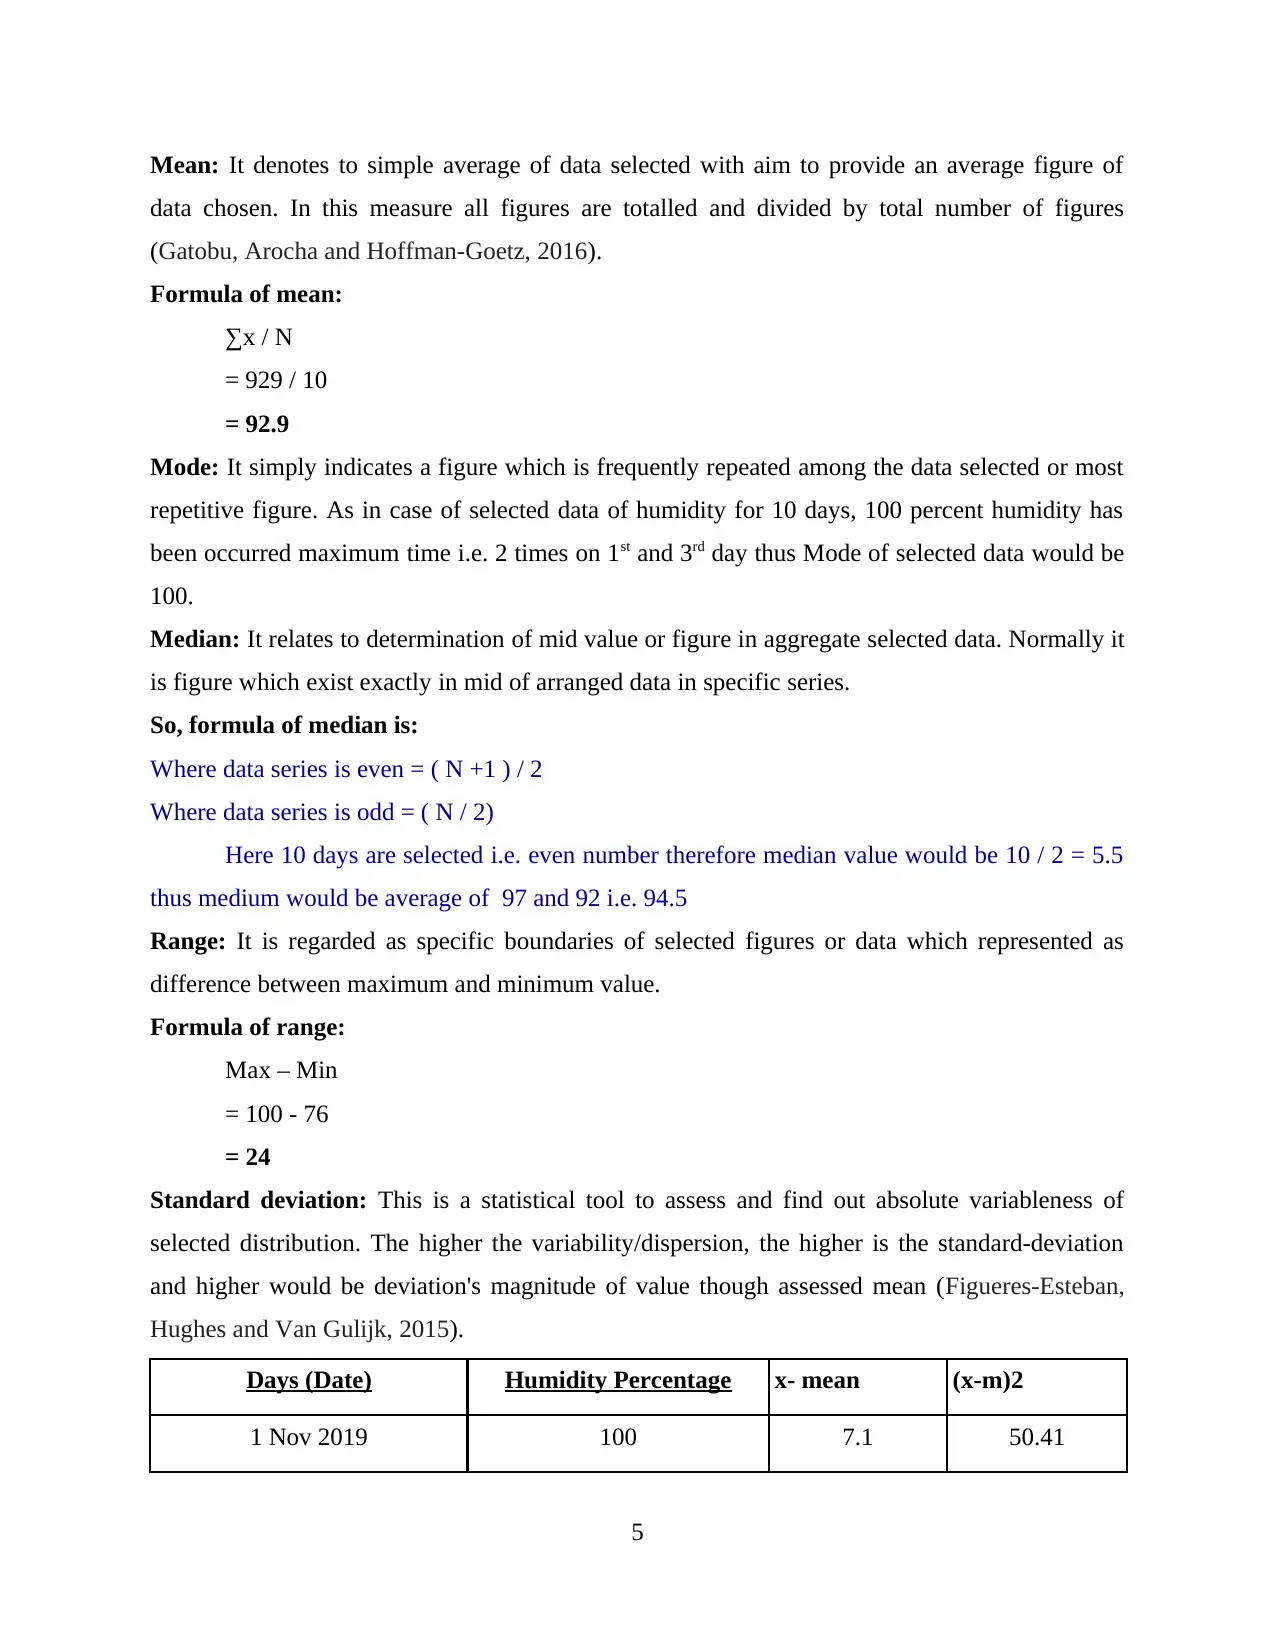
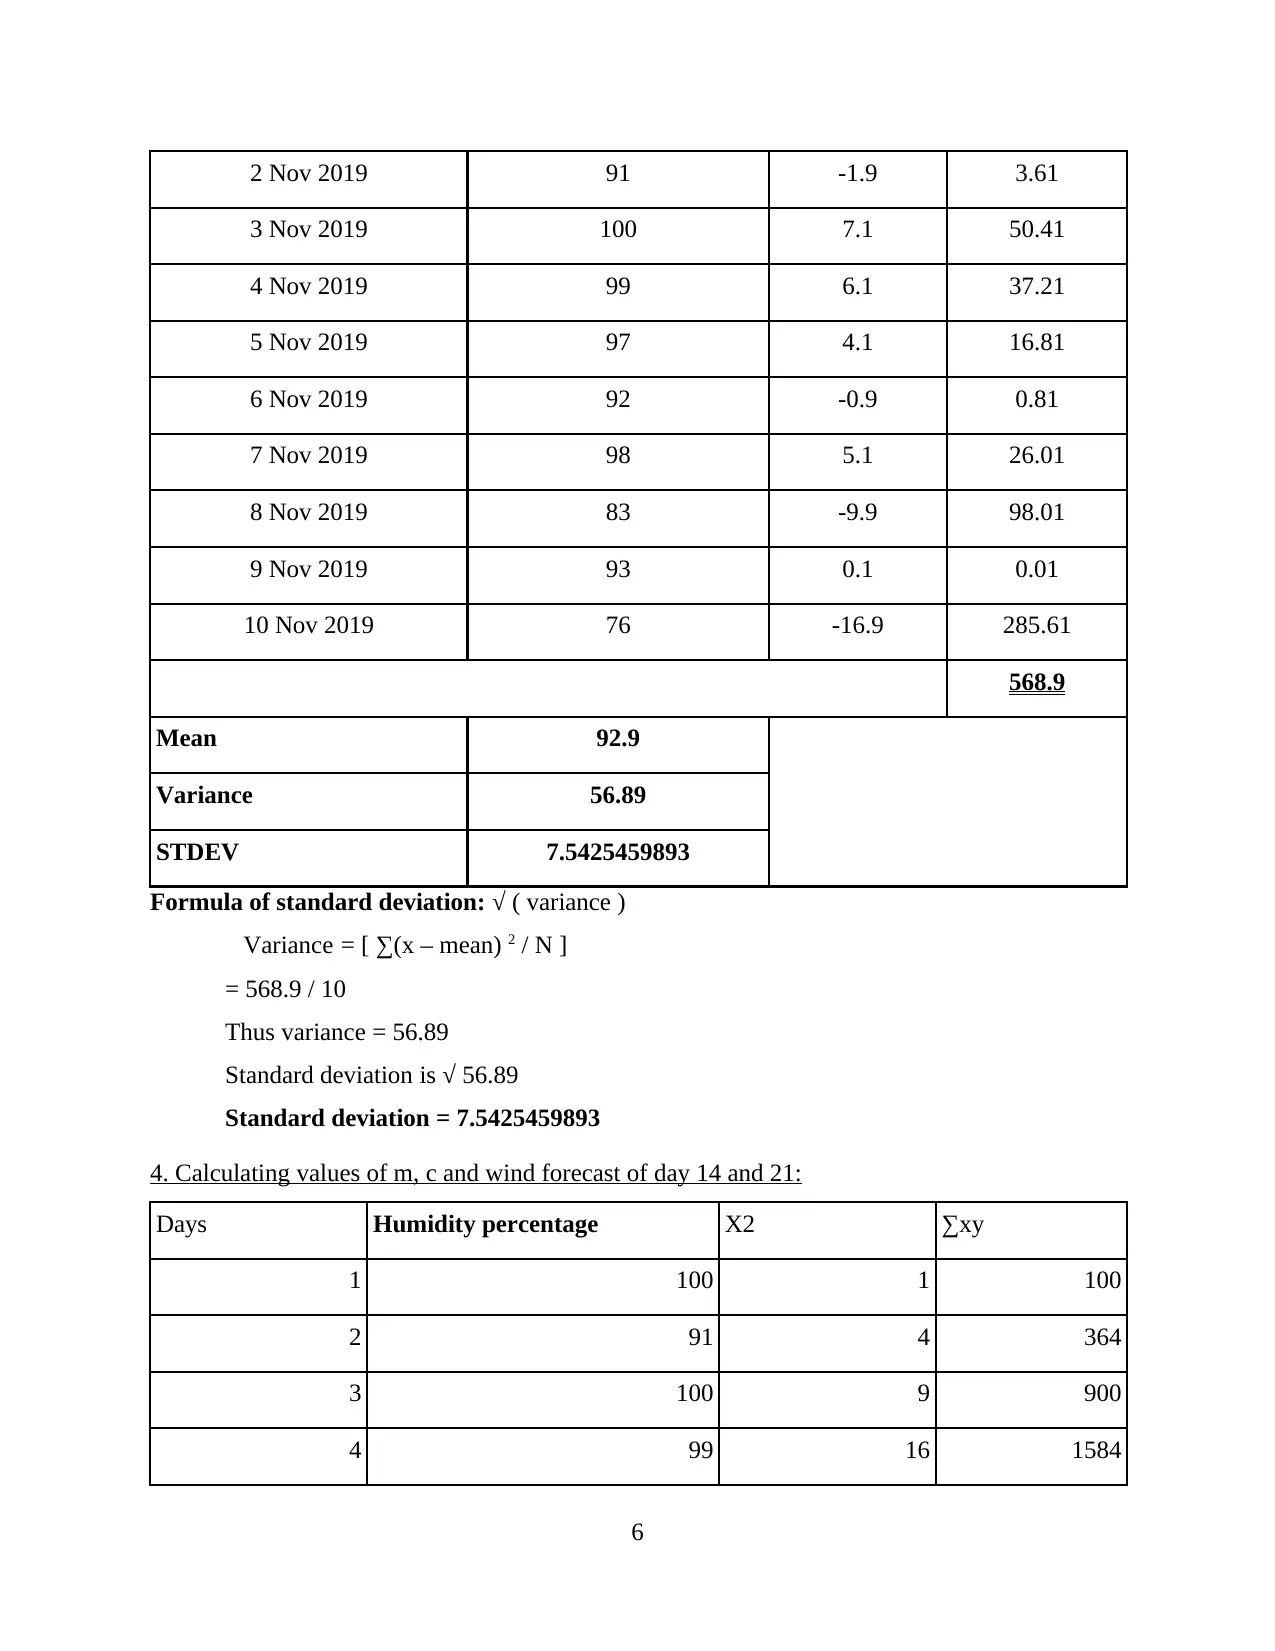
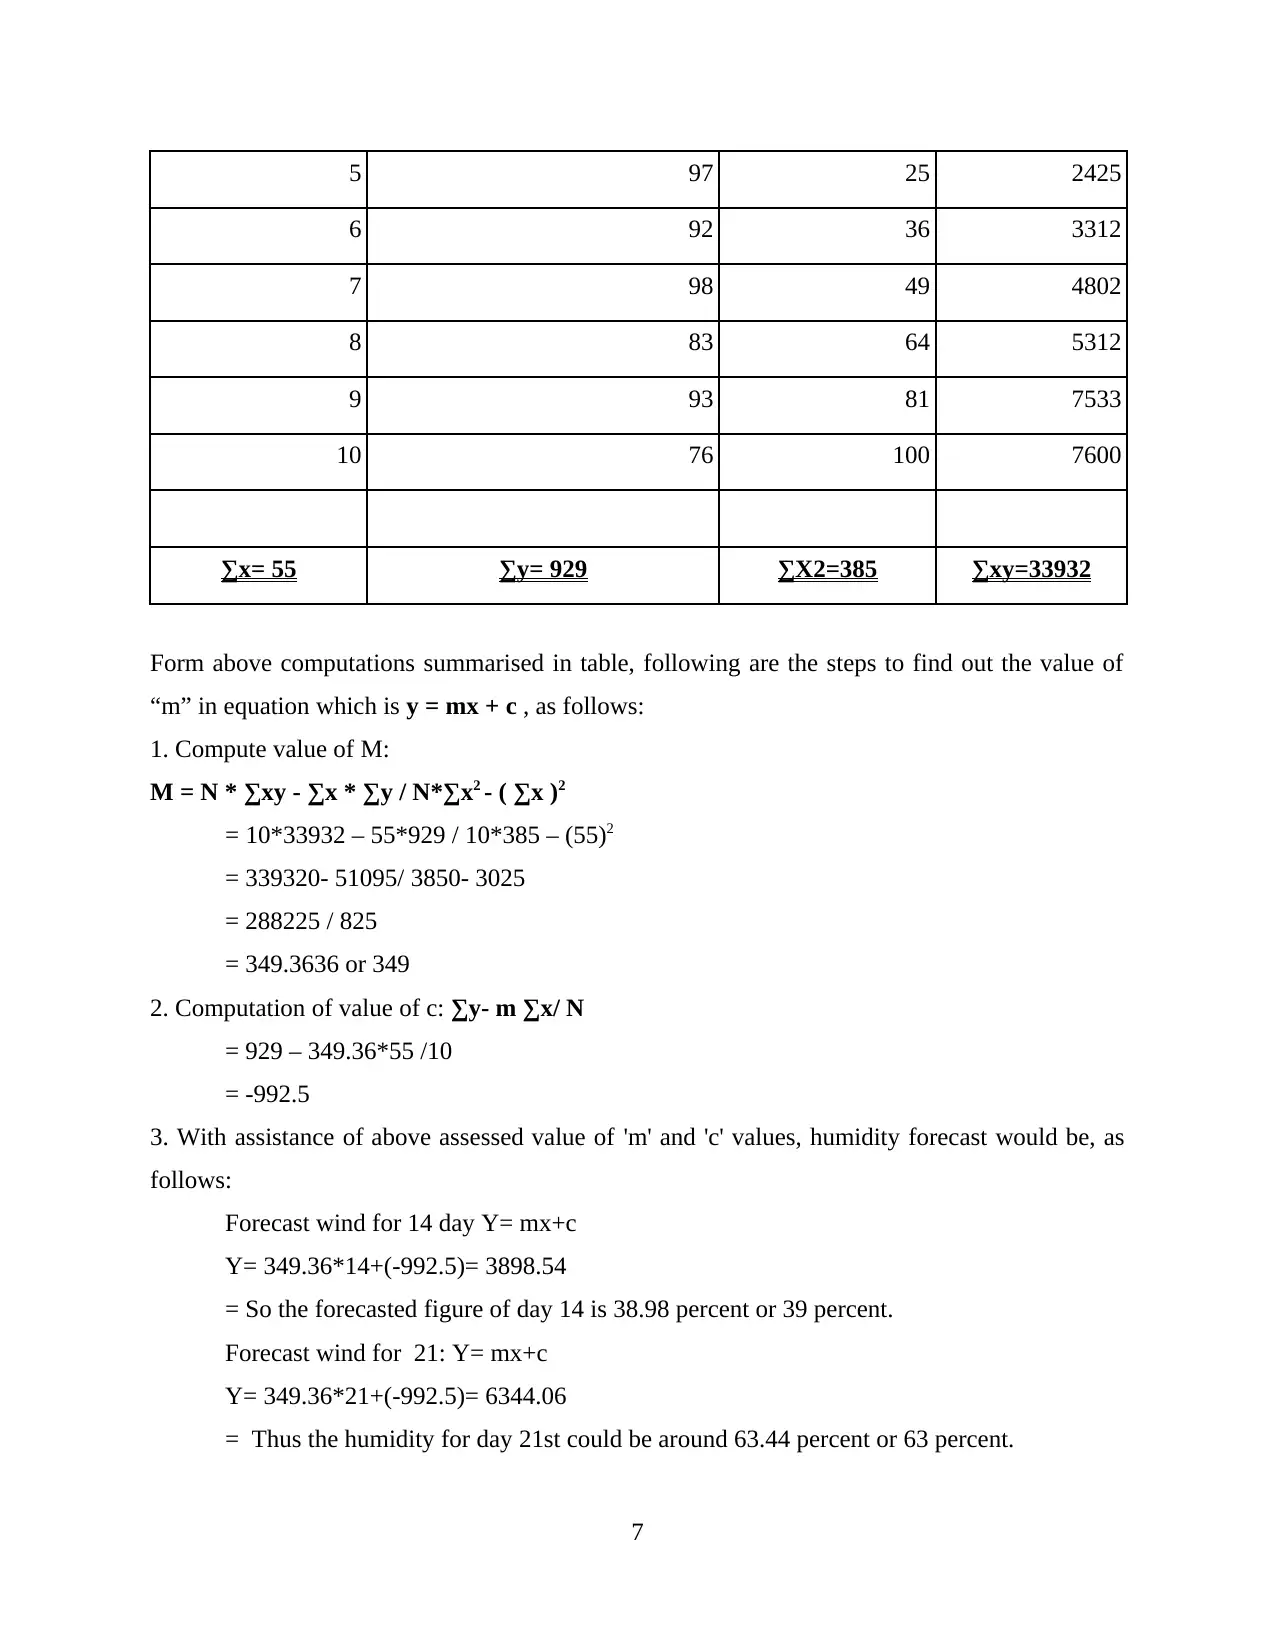
This assignment analyzes humidity data for Leeds, UK, from November 1st to 10th, 2019. It presents the data in tabular and graphical formats, including bar and column charts. The core of the analysis involves calculating mean, median, mode, range, and standard deviation. The document demonstrates the application of these statistical tools to understand the data's central tendencies and variability. Furthermore, it uses the data to forecast humidity levels for the 14th and 21st days of November, employing calculations of 'm' and 'c' within a linear equation (y = mx + c). The conclusion emphasizes the value of data analysis in recognizing trends and evaluating interpersonal criteria. Desklib offers a platform for students to access past papers and solved assignments like this one.

1 out of 11
Related Documents


Your All-in-One AI-Powered Toolkit for Academic Success.
+13062052269
info@desklib.com
Available 24*7 on WhatsApp / Email
![[object Object]](/_next/static/media/star-bottom.7253800d.svg)
Copyright © 2020–2026 A2Z Services. All Rights Reserved. Developed and managed by ZUCOL.