Data Analysis and Forecasting: Phone Calls Over Ten Days
VerifiedAdded on 2023/01/09
|9
|1379
|30
Report
AI Summary
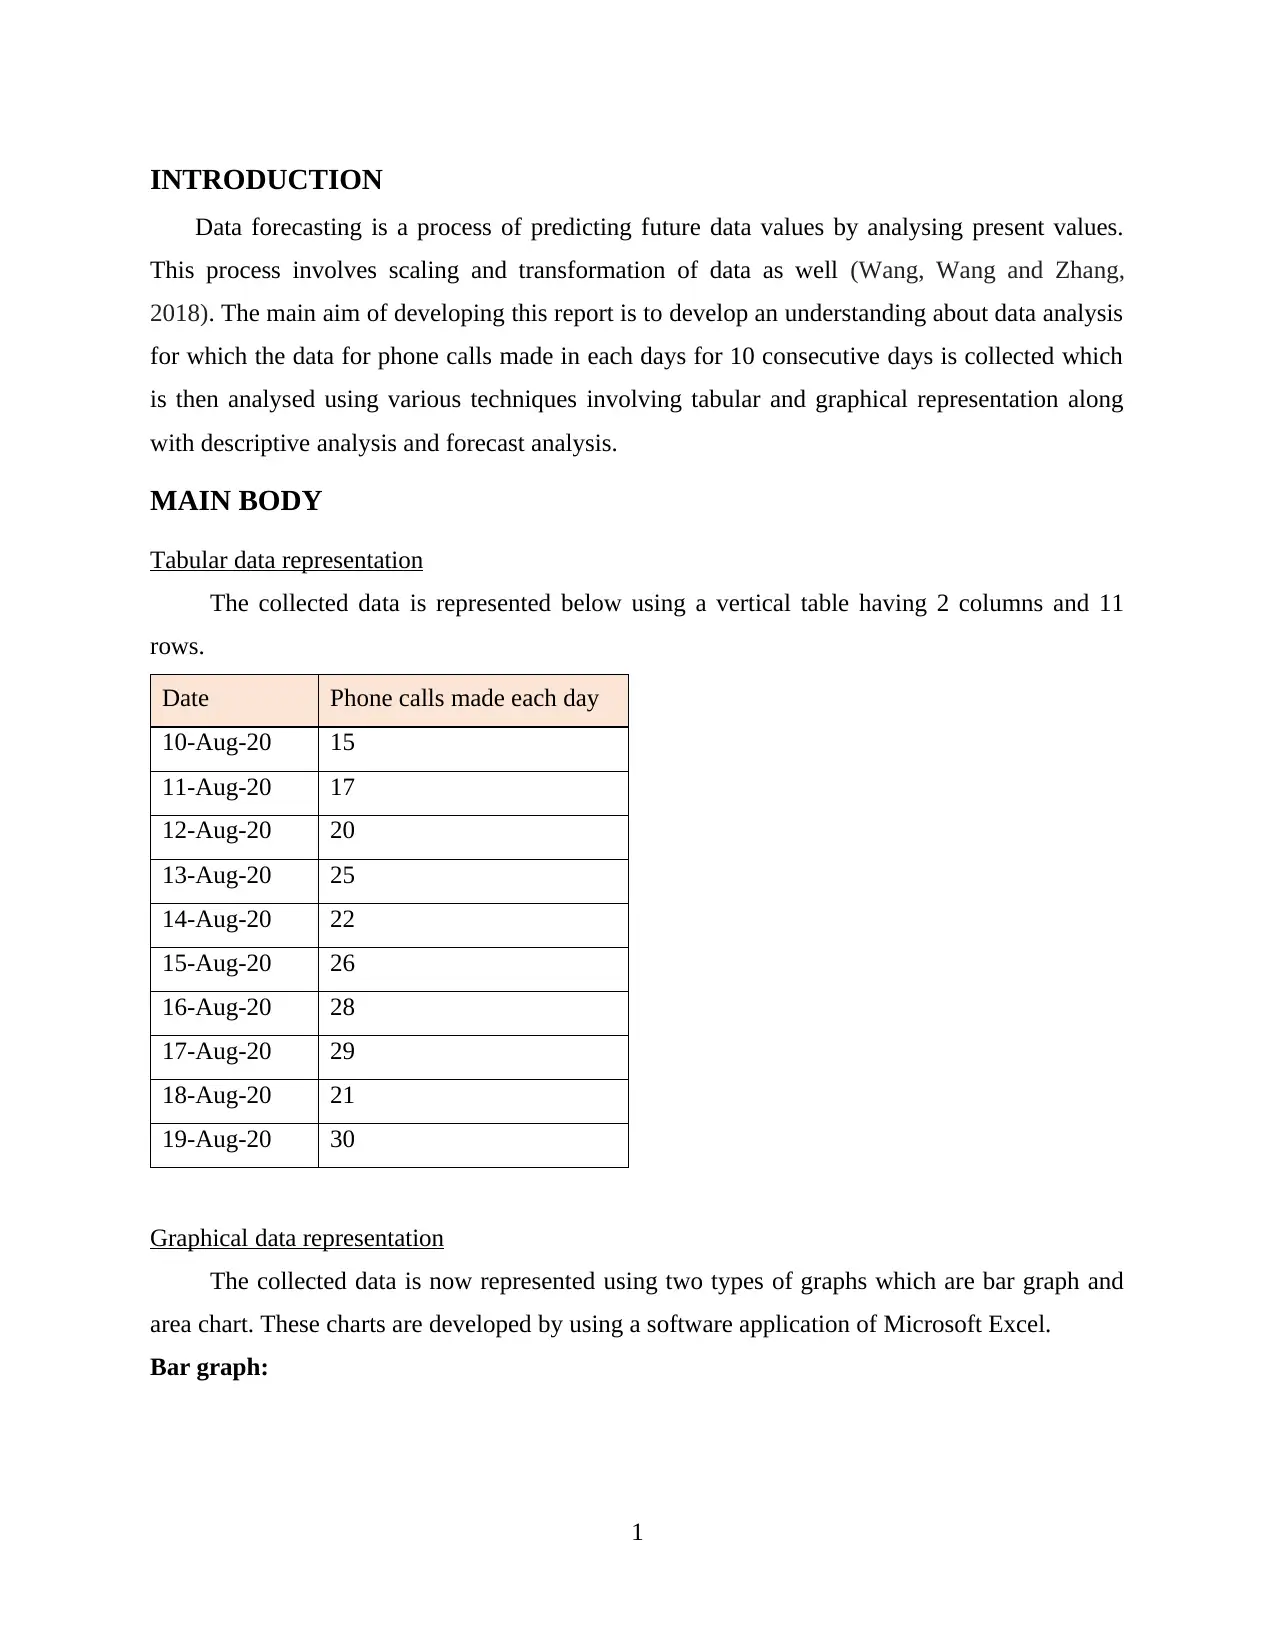
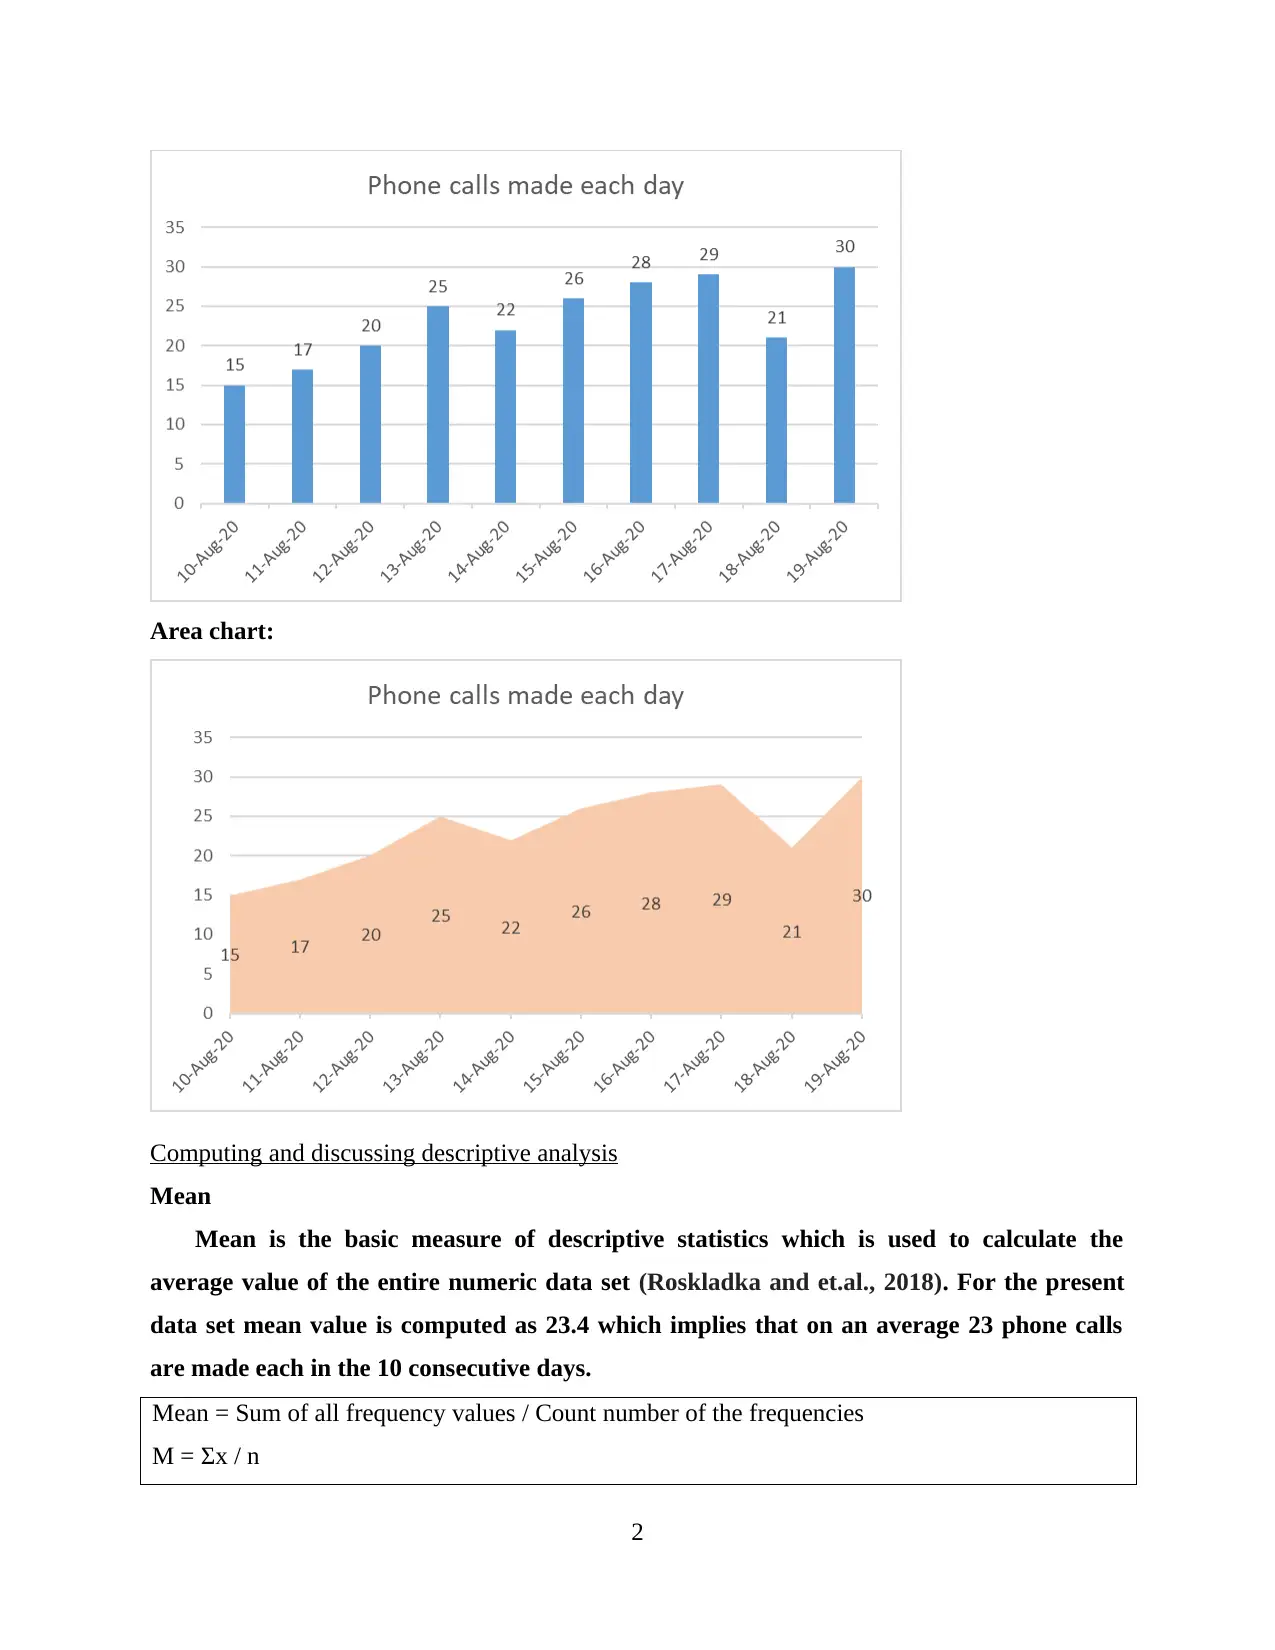
This report presents a comprehensive analysis of phone call data collected over ten consecutive days. The analysis begins with tabular and graphical representations of the data, utilizing both vertical tables and bar graphs/area charts generated in Microsoft Excel. Descriptive statistics are then computed and discussed, including mean, median, mode, range, and standard deviation, providing insights into the central tendencies and dispersion of the data. Furthermore, the report employs a linear forecasting model to predict the number of phone calls on the 12th and 14th days, based on the observed trends. The forecasting model, represented by the equation y = mx + c, calculates the rate of change (m) and the constant (c) to estimate future values. The report concludes by summarizing the findings, emphasizing the utility of continuous data sets and linear forecasting models in predicting future outcomes, alongside the effectiveness of descriptive statistics in data analysis. The report also acknowledges the limitations of the linear model, which does not account for external factors.
1 out of 9
Related Documents


Your All-in-One AI-Powered Toolkit for Academic Success.
+13062052269
info@desklib.com
Available 24*7 on WhatsApp / Email
![[object Object]](/_next/static/media/star-bottom.7253800d.svg)
Copyright © 2020–2026 A2Z Services. All Rights Reserved. Developed and managed by ZUCOL.