Data Analysis and Forecasting Report: Sleep Hours Prediction
VerifiedAdded on 2023/01/11
|11
|939
|58
Report
AI Summary
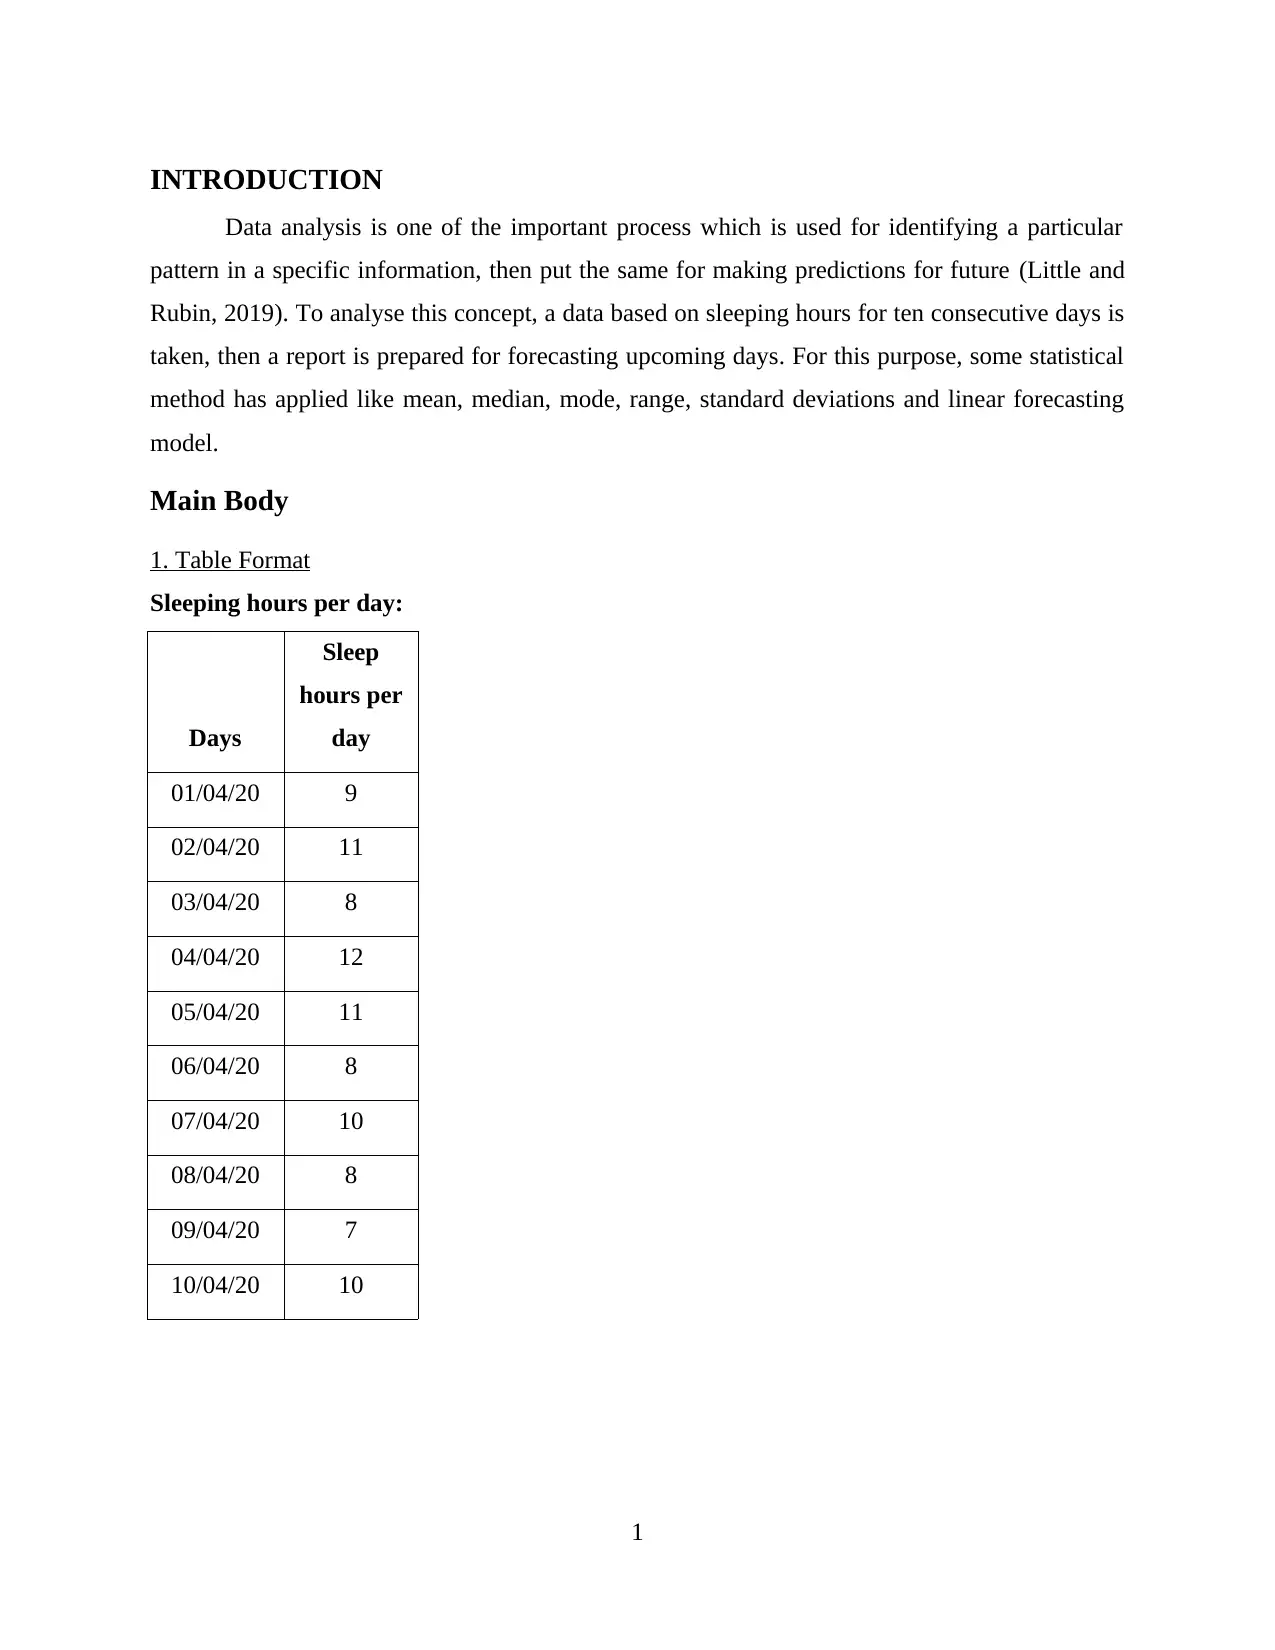
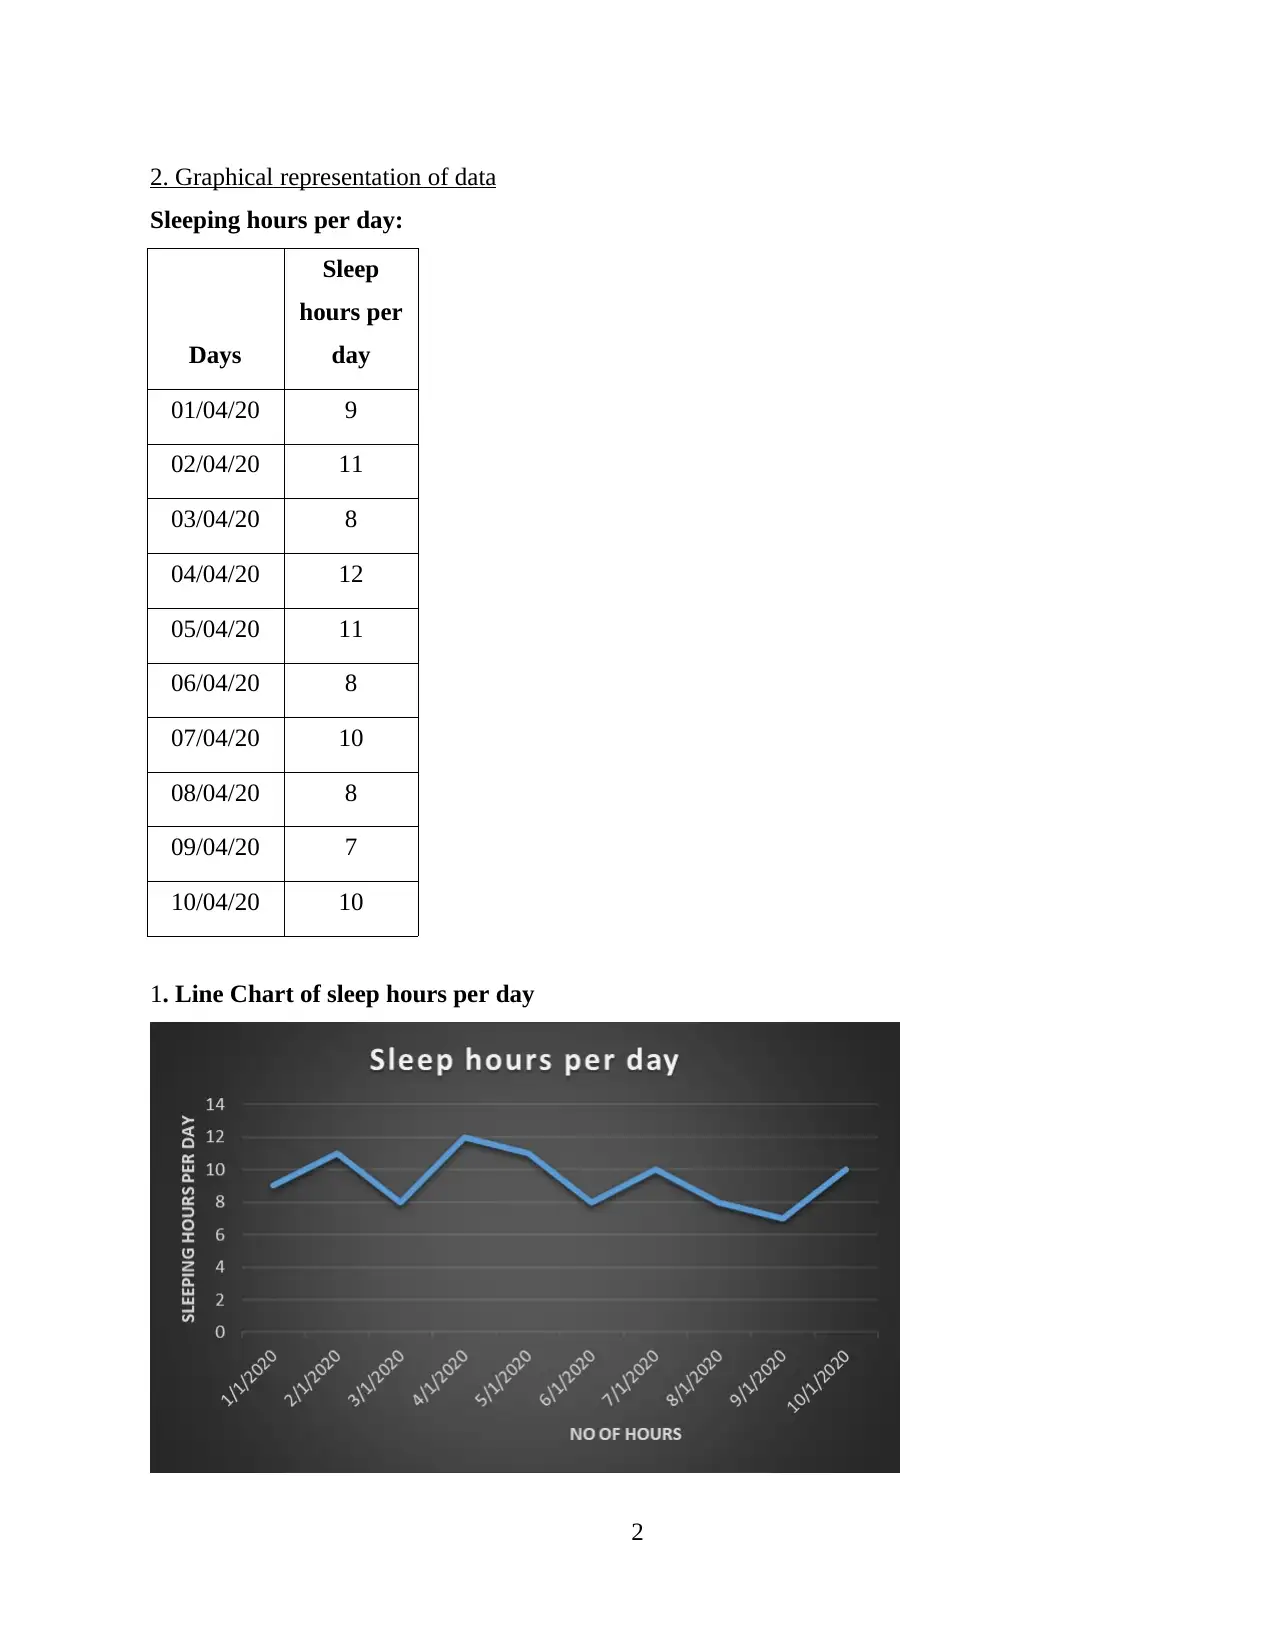
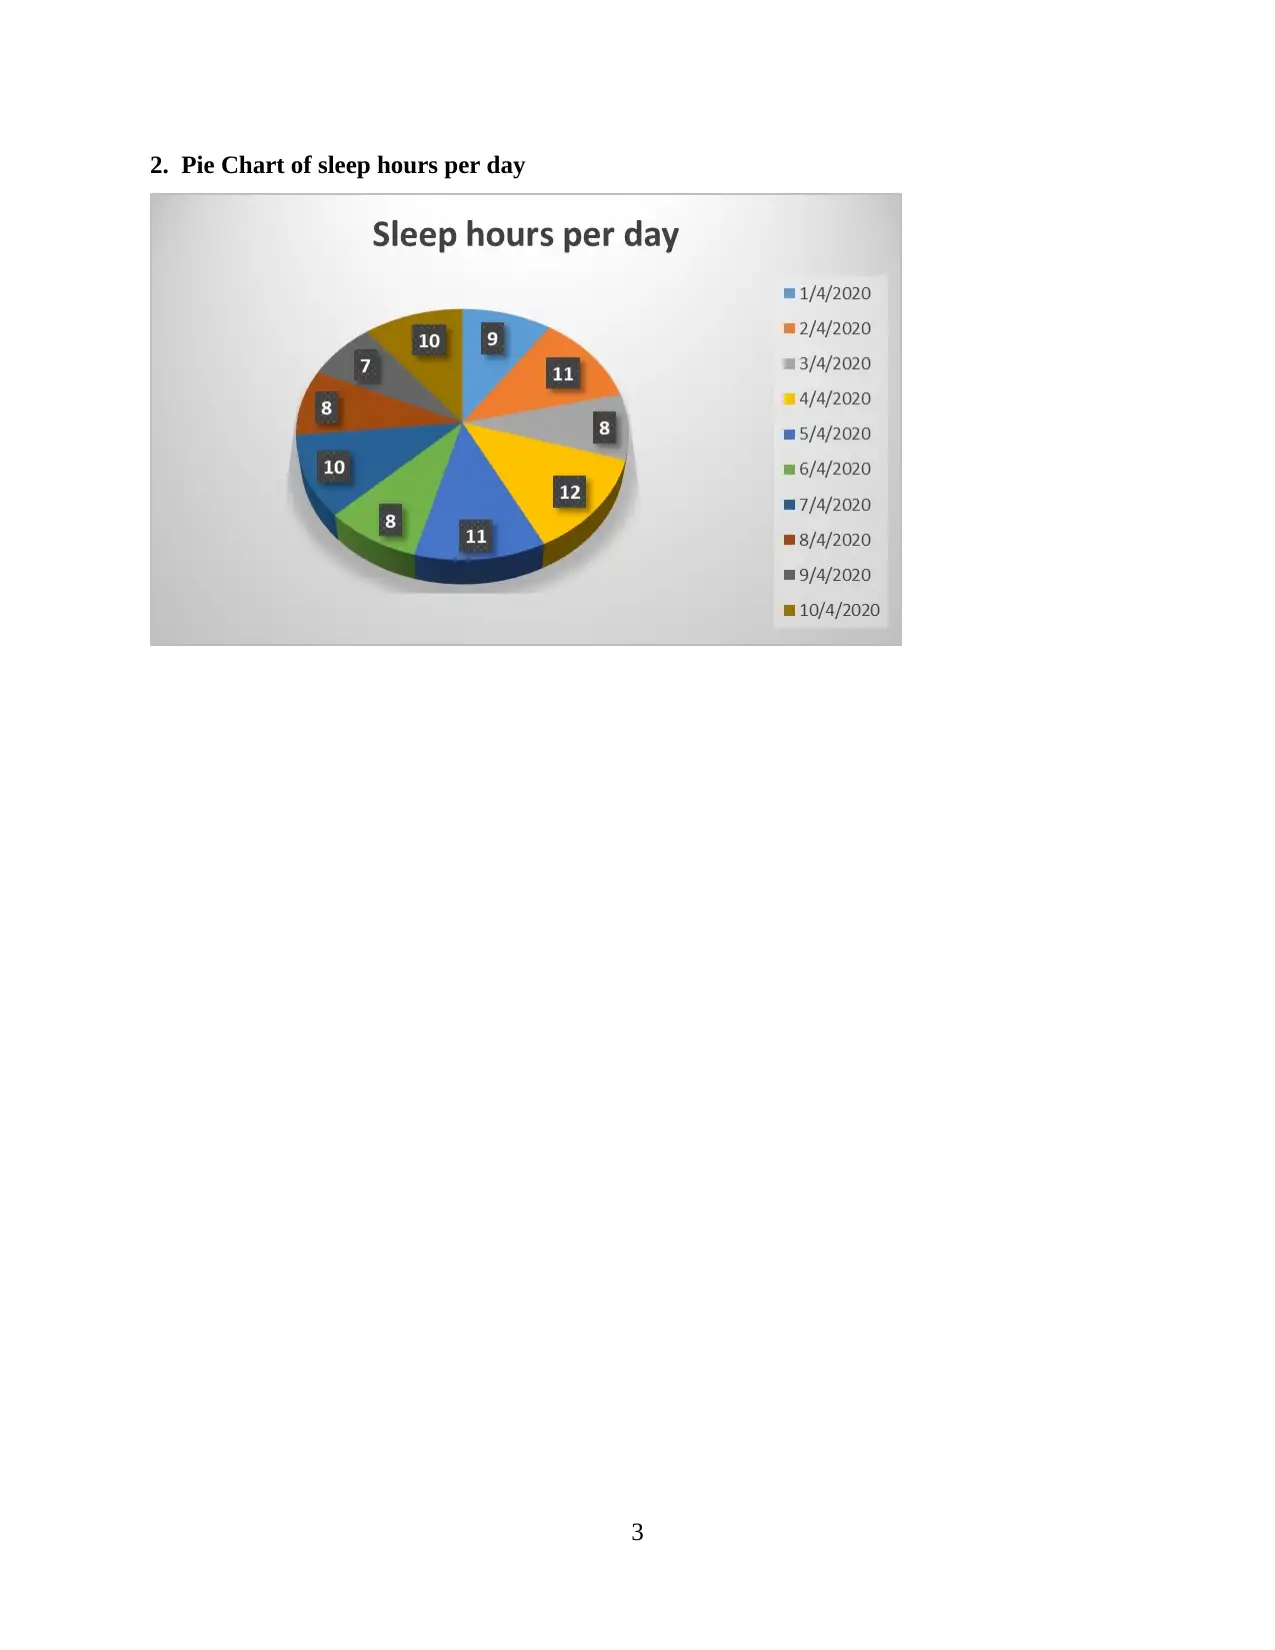
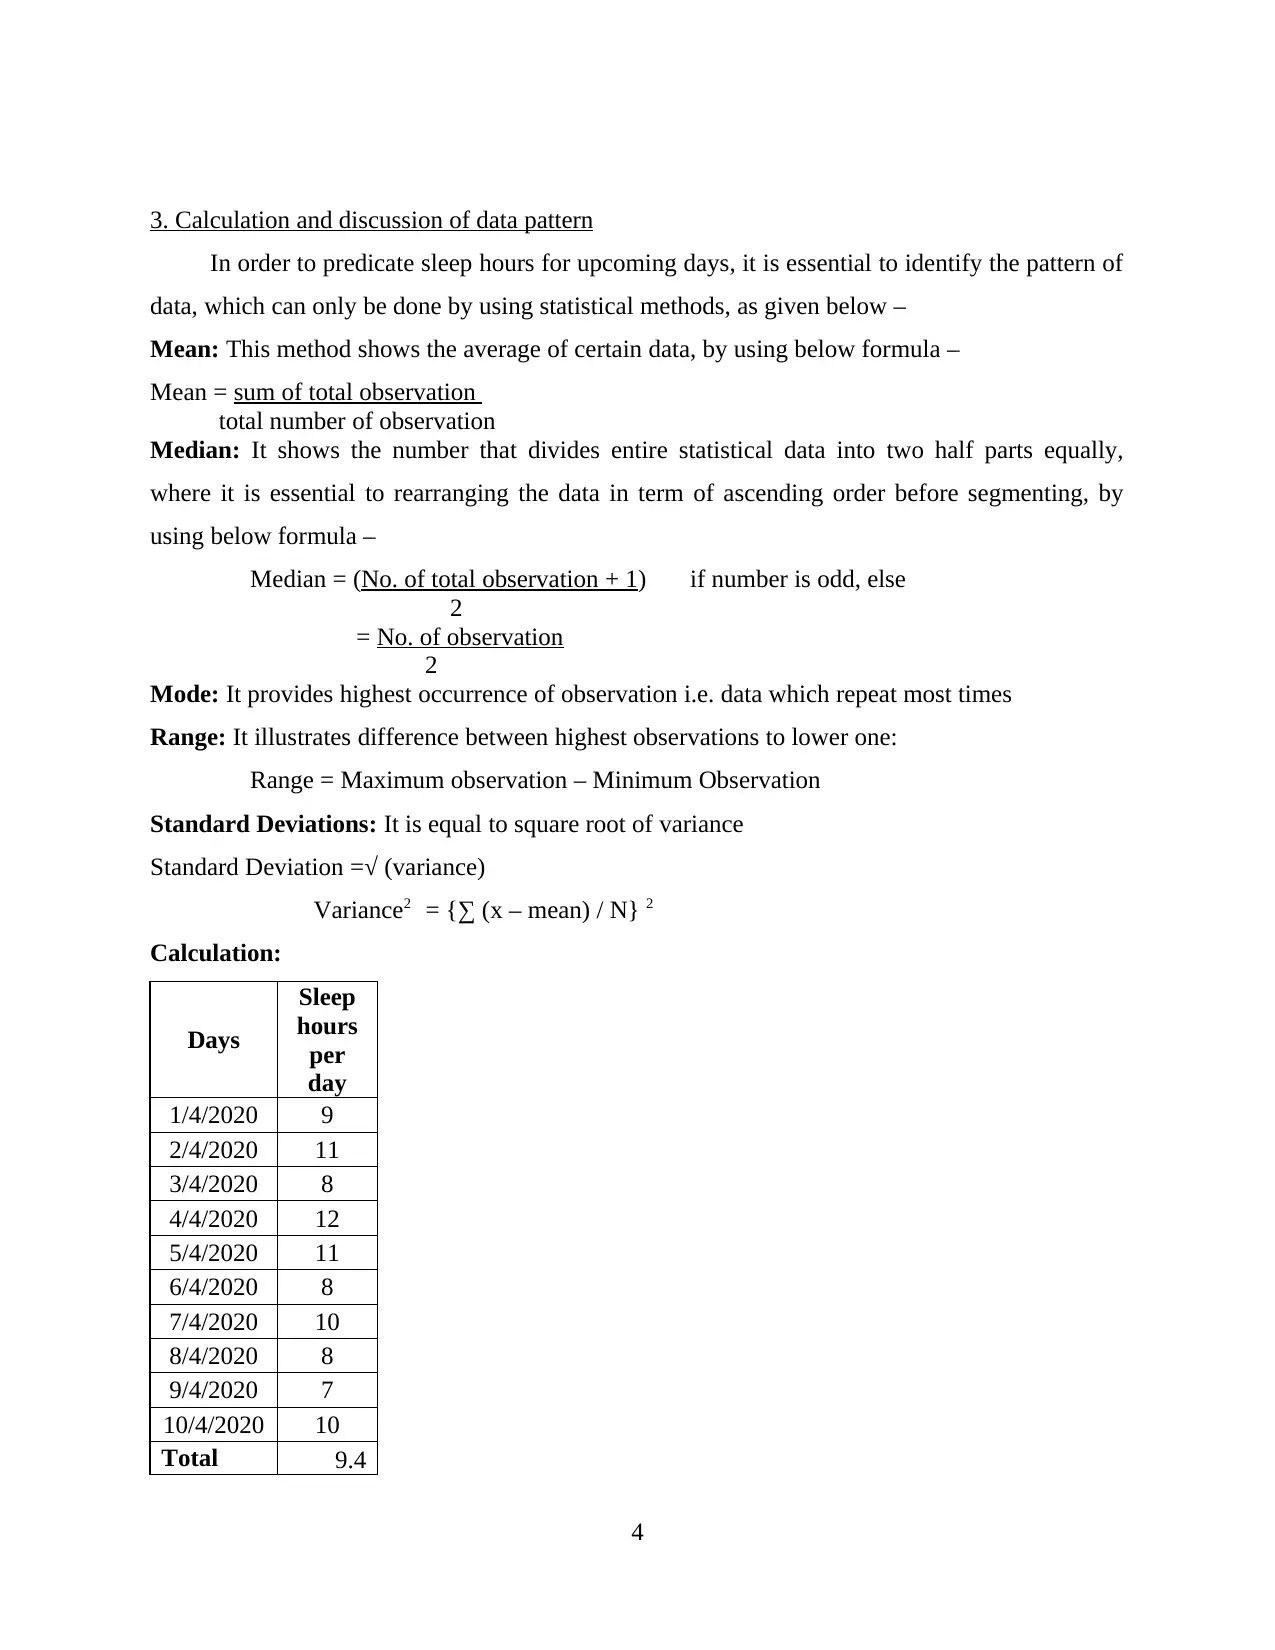
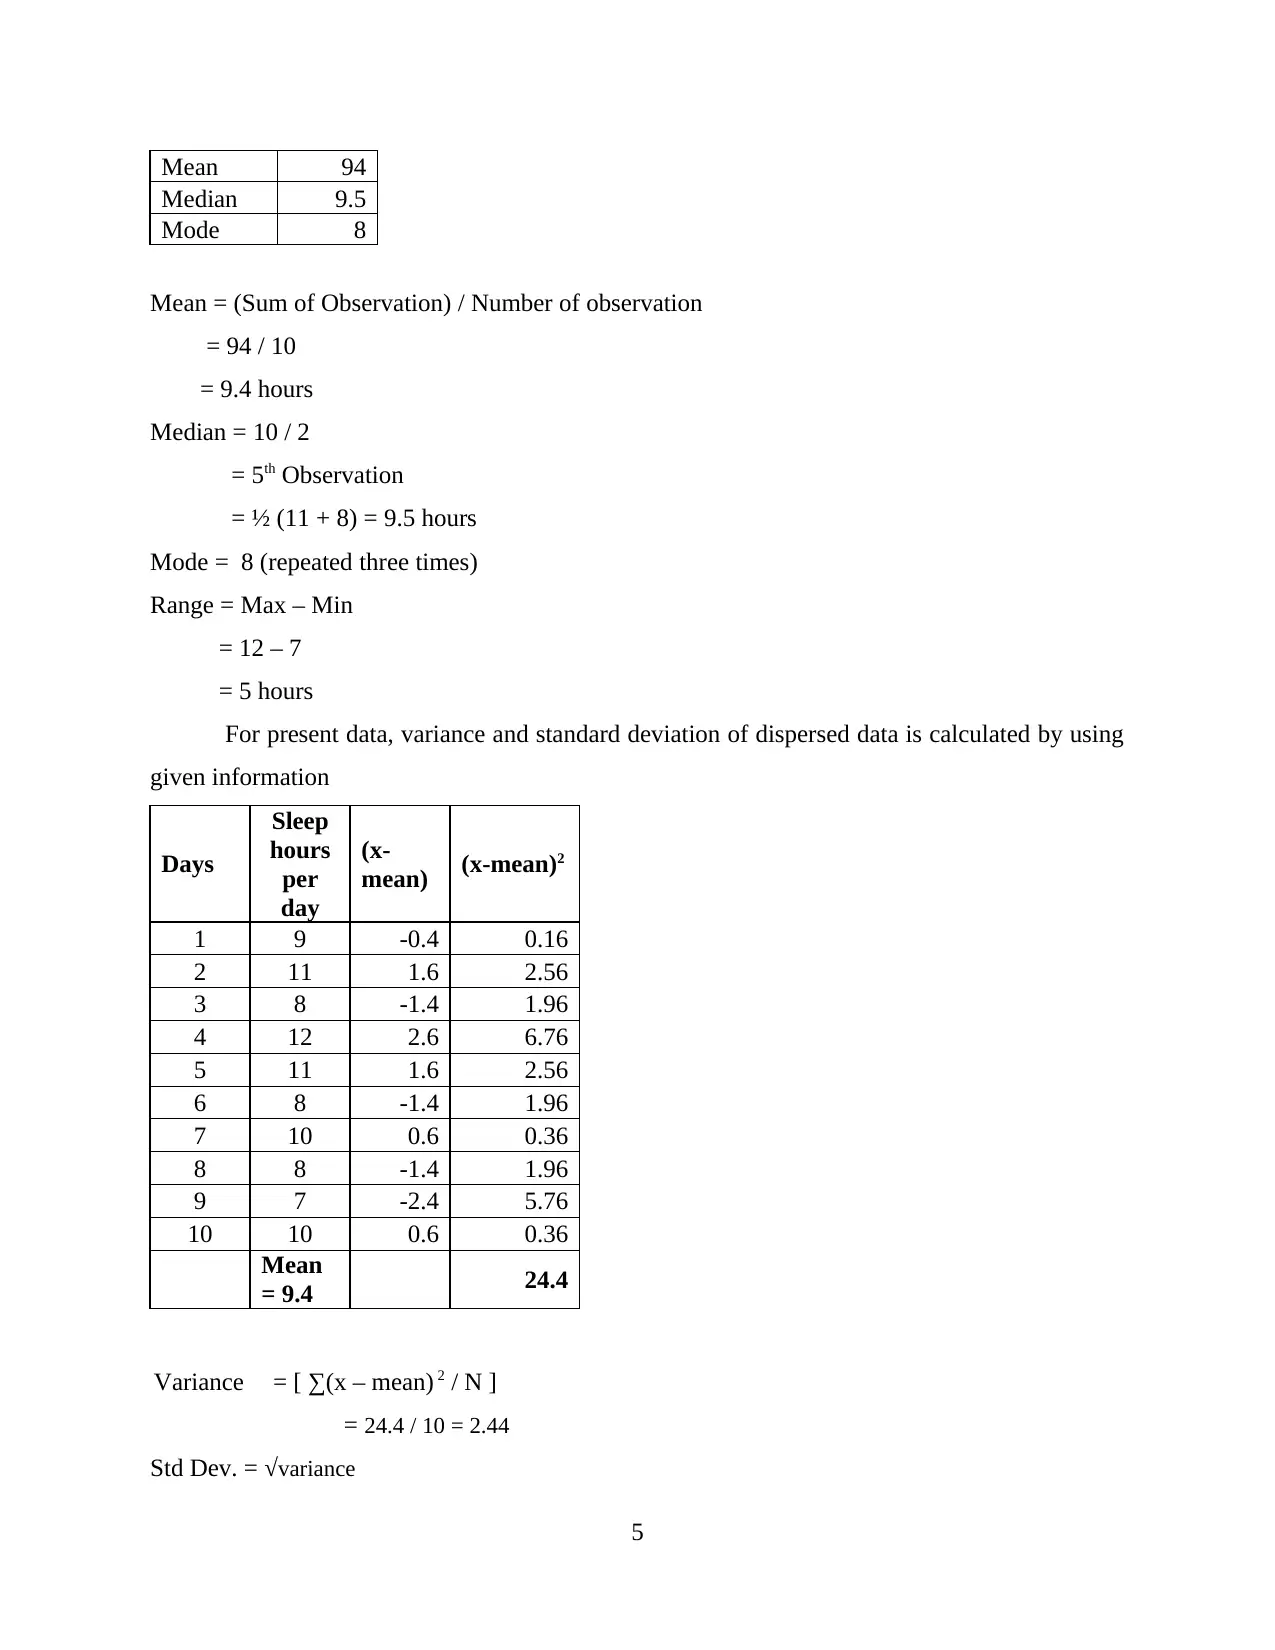
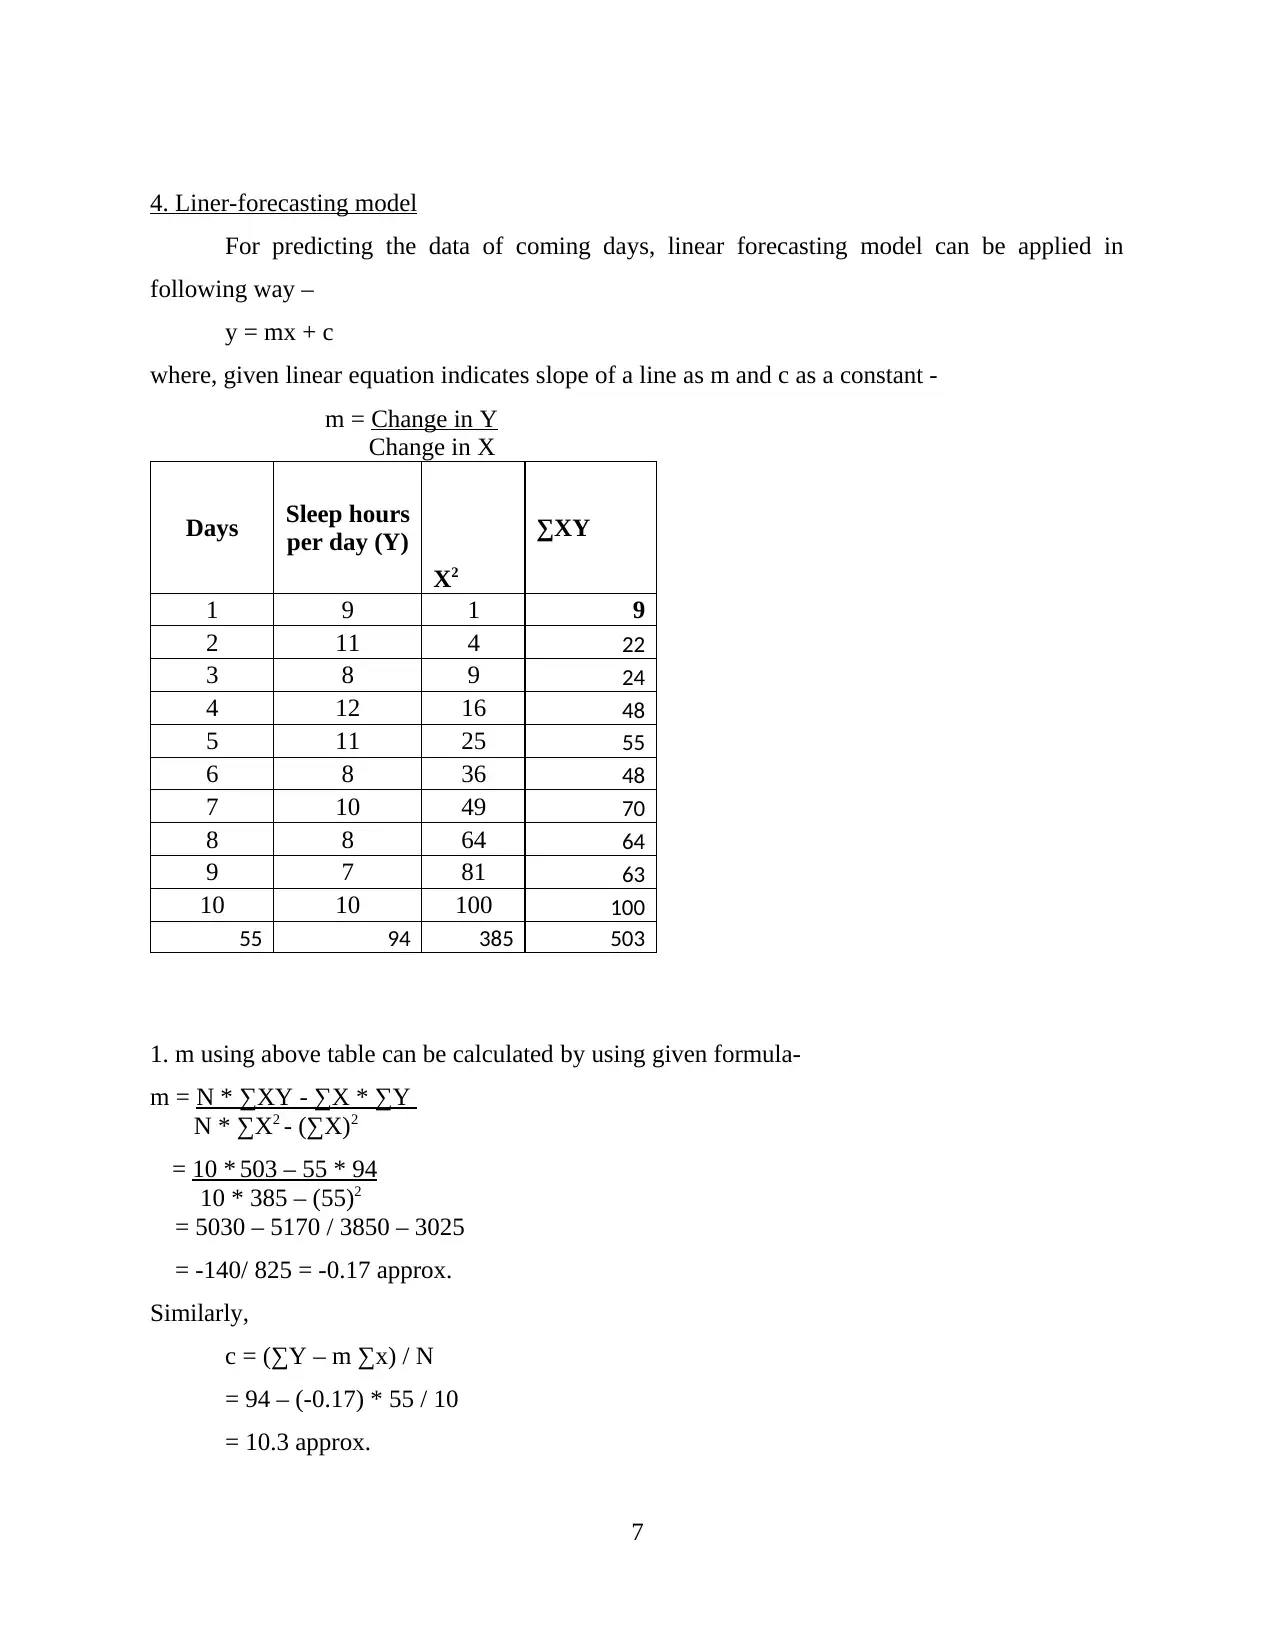
This report presents a comprehensive data analysis and forecasting study based on sleep hours data collected over ten consecutive days. The analysis begins with a table summarizing the data, followed by graphical representations using line and pie charts to visualize the sleep patterns. The core of the report involves calculating and discussing various statistical measures, including mean, median, mode, range, and standard deviation, to identify patterns and trends within the data. Furthermore, a linear forecasting model is applied to predict sleep hours for upcoming days, providing insights into potential future sleep patterns. The report concludes with the application of the linear forecasting model, which allows for the prediction of sleep hours for the 11th and 15th days, demonstrating the practical application of statistical methods in making informed predictions. References to relevant books and journals are also provided to support the analysis and findings presented in this report.

1 out of 11
Related Documents


Your All-in-One AI-Powered Toolkit for Academic Success.
+13062052269
info@desklib.com
Available 24*7 on WhatsApp / Email
![[object Object]](/_next/static/media/star-bottom.7253800d.svg)
Copyright © 2020–2026 A2Z Services. All Rights Reserved. Developed and managed by ZUCOL.