Forecasting Temperature: Data Analysis Report for London City

Verified

Added on  2023/06/14

|11
|1415
|338
Report
AI Summary
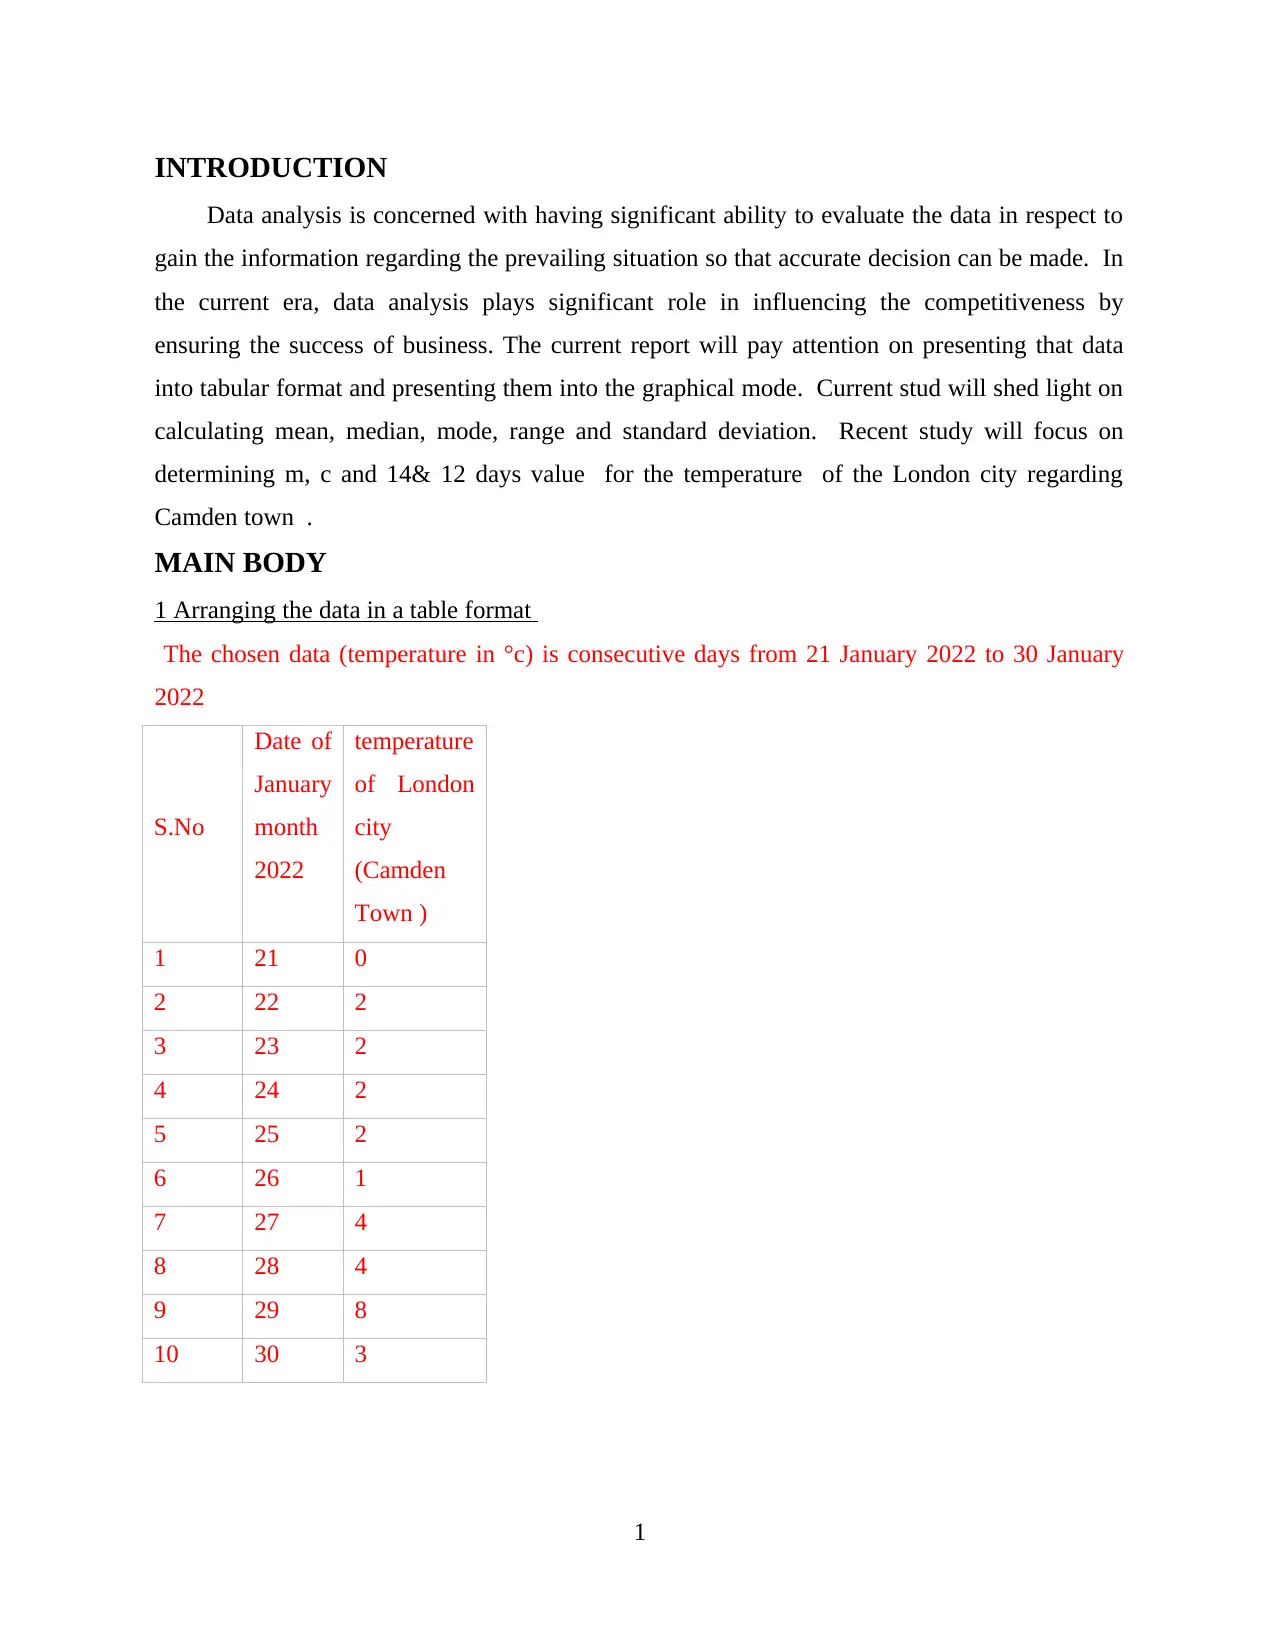
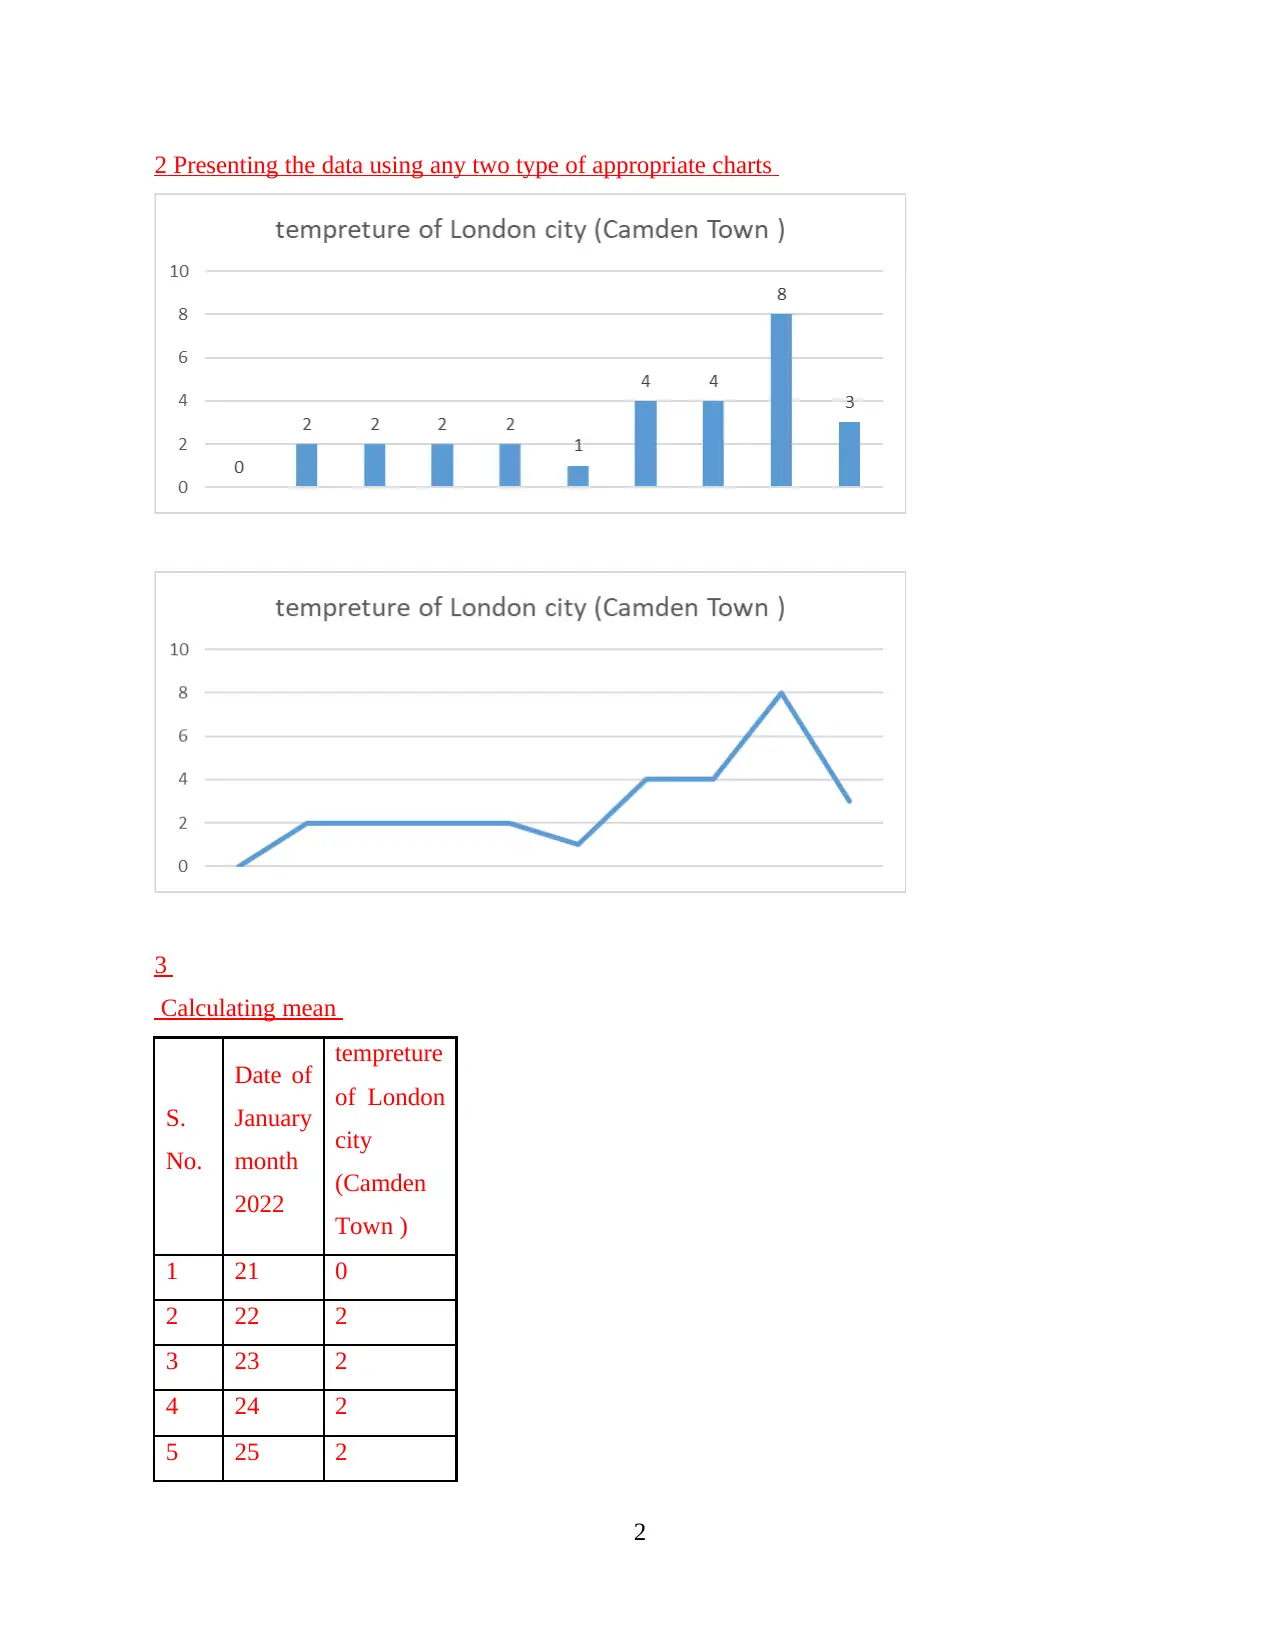
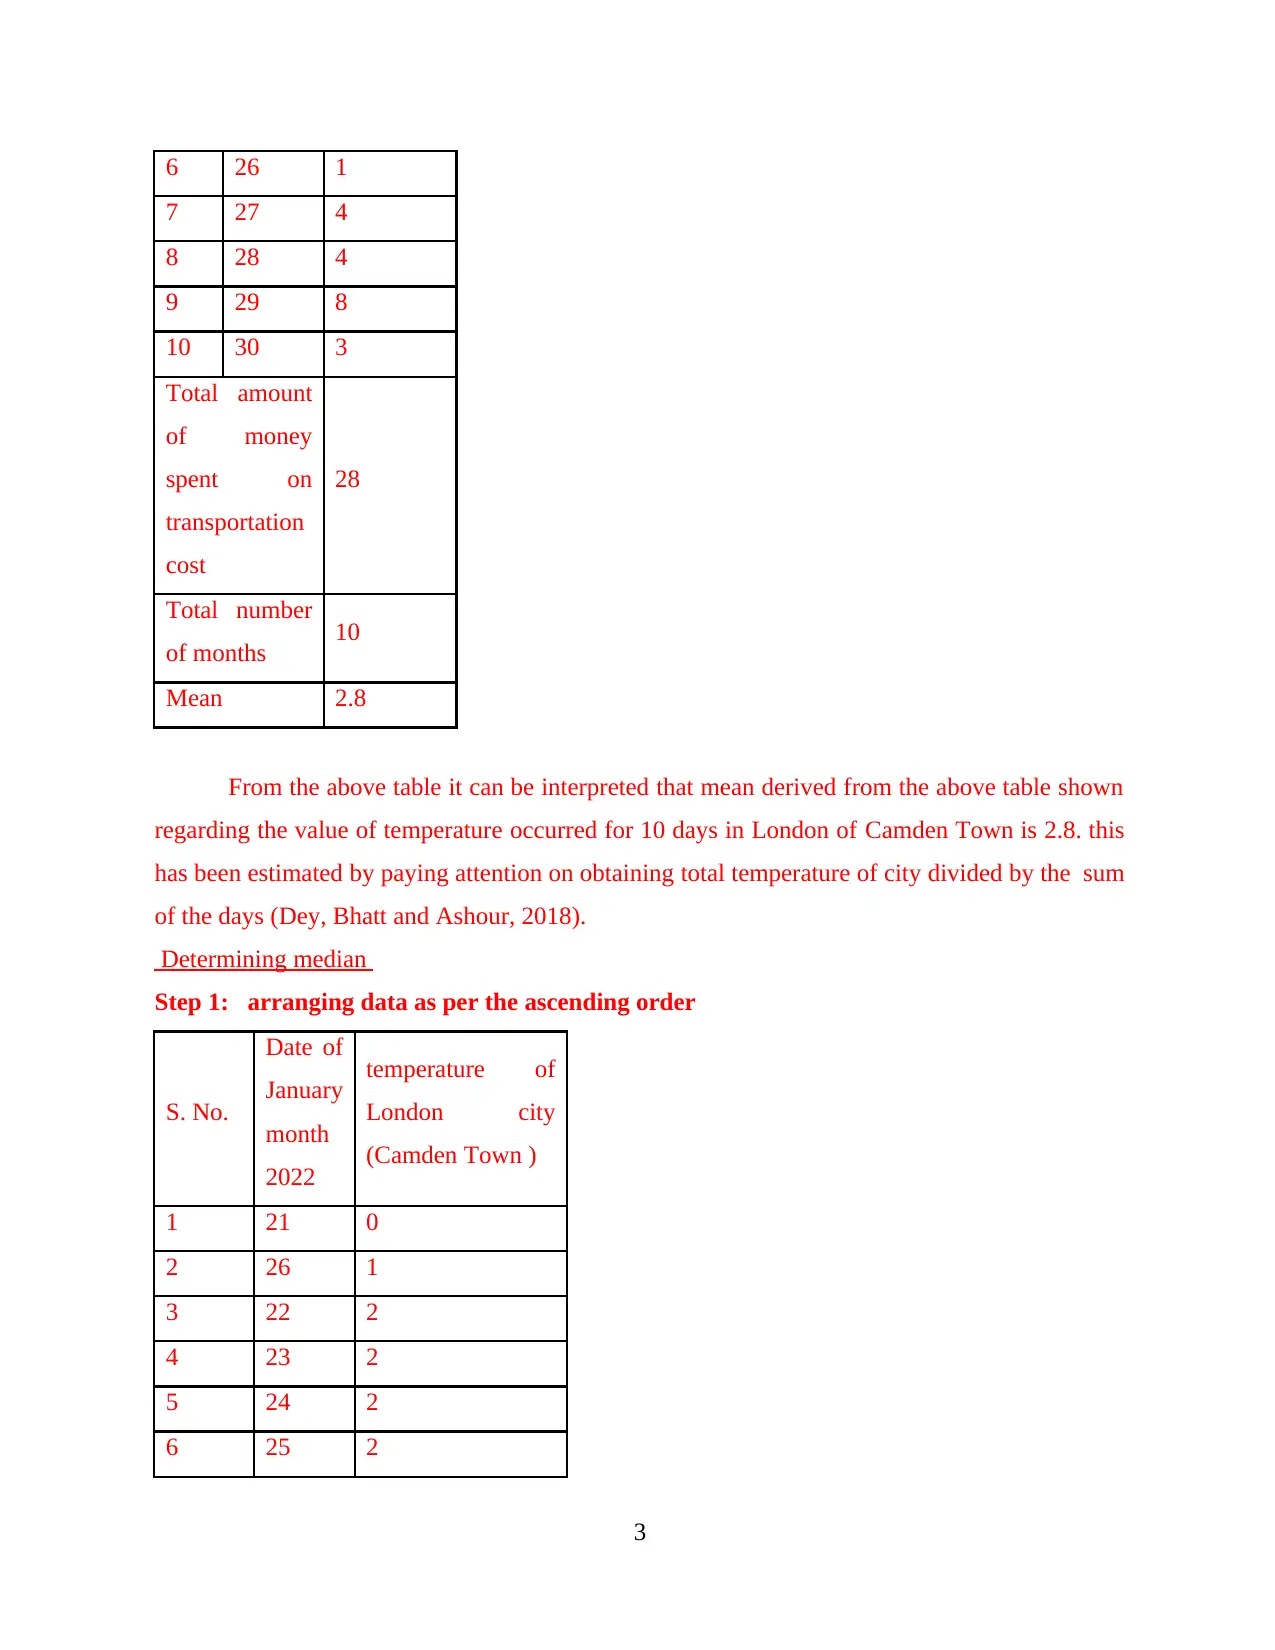
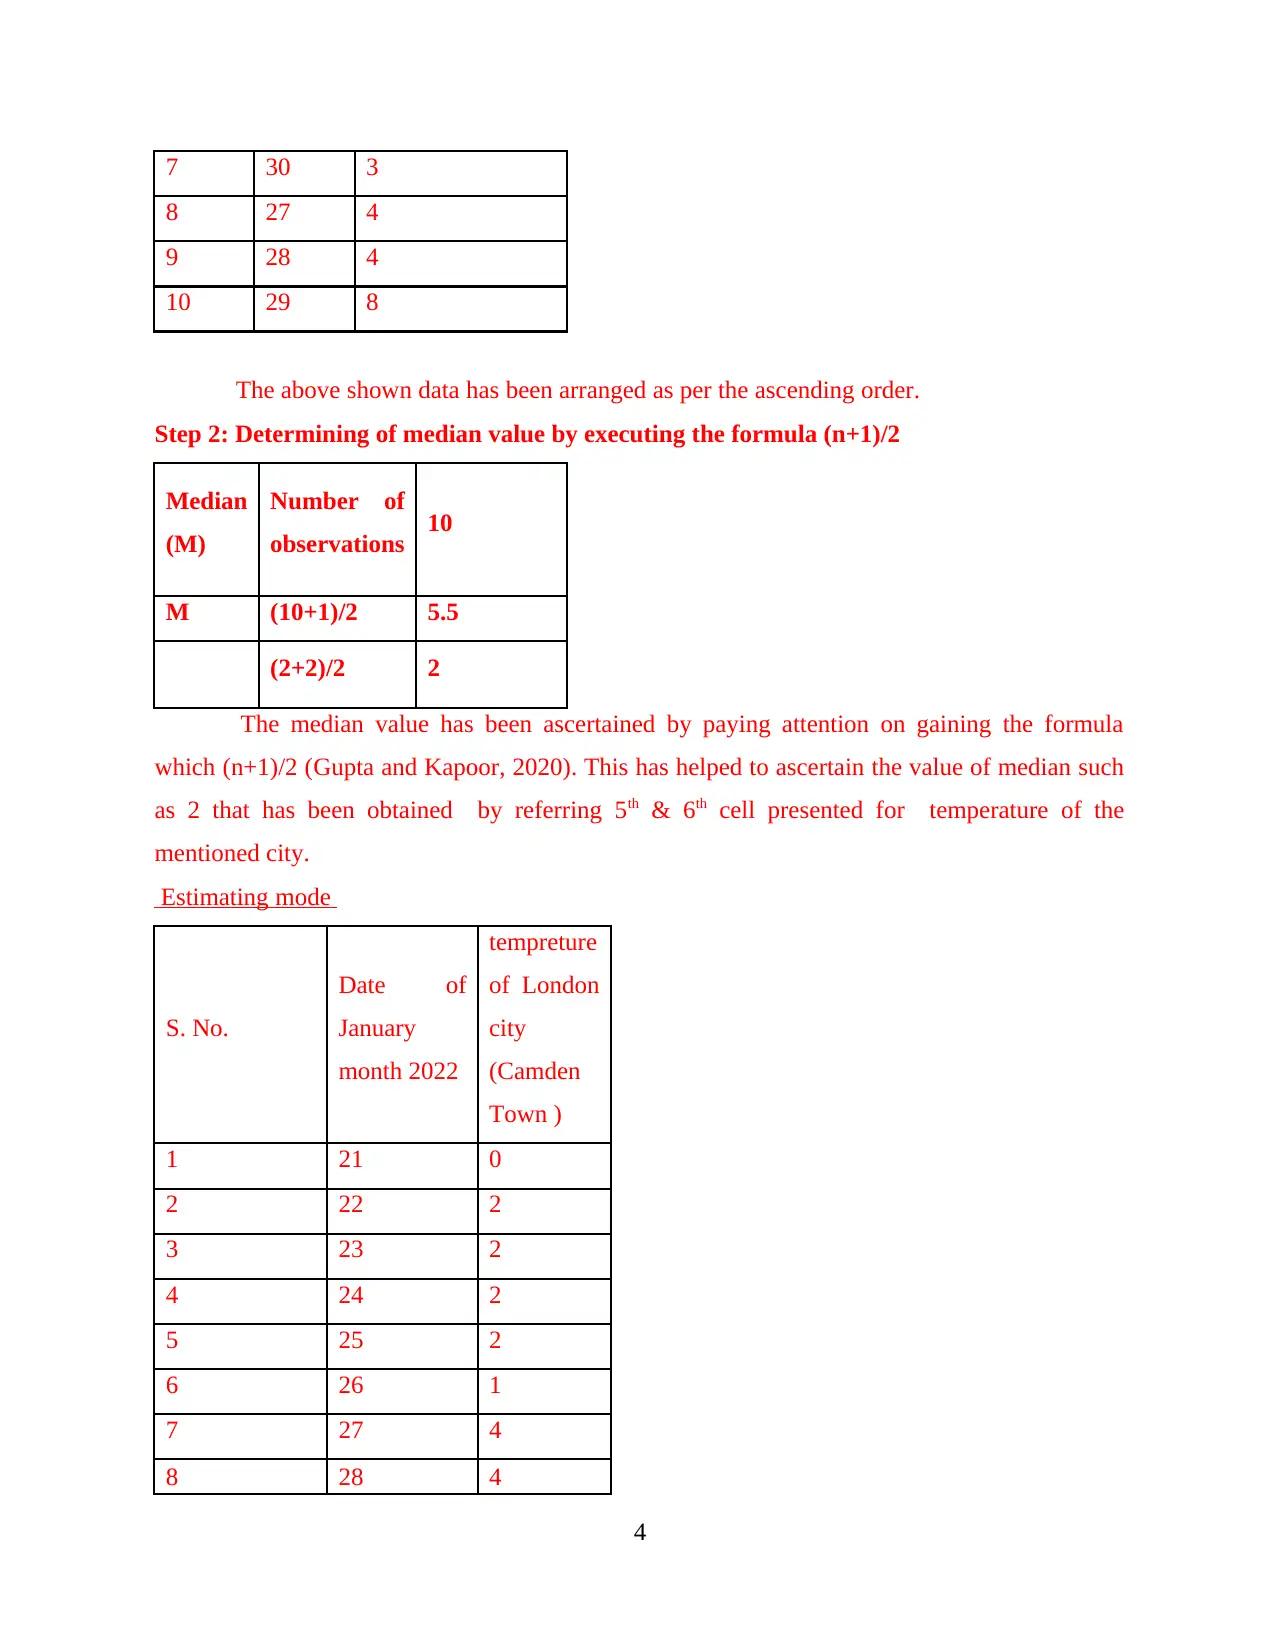
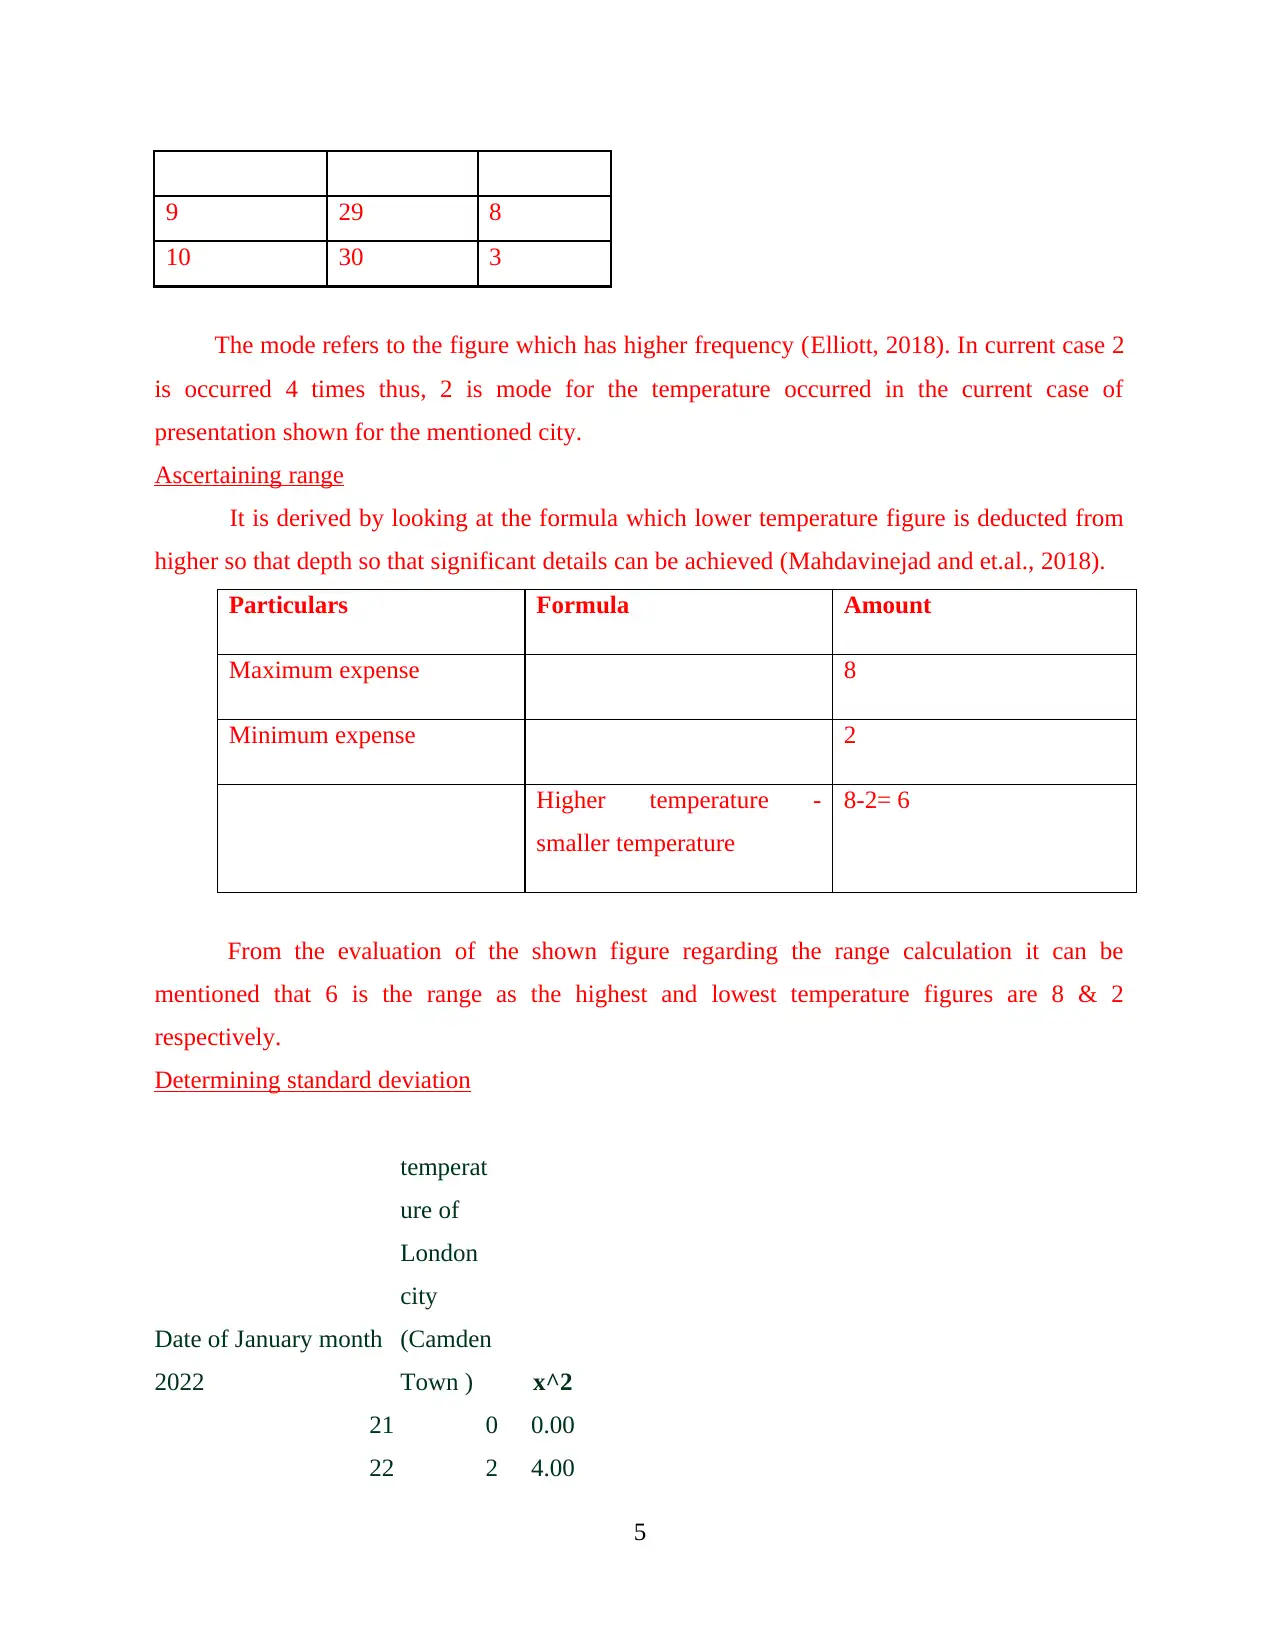
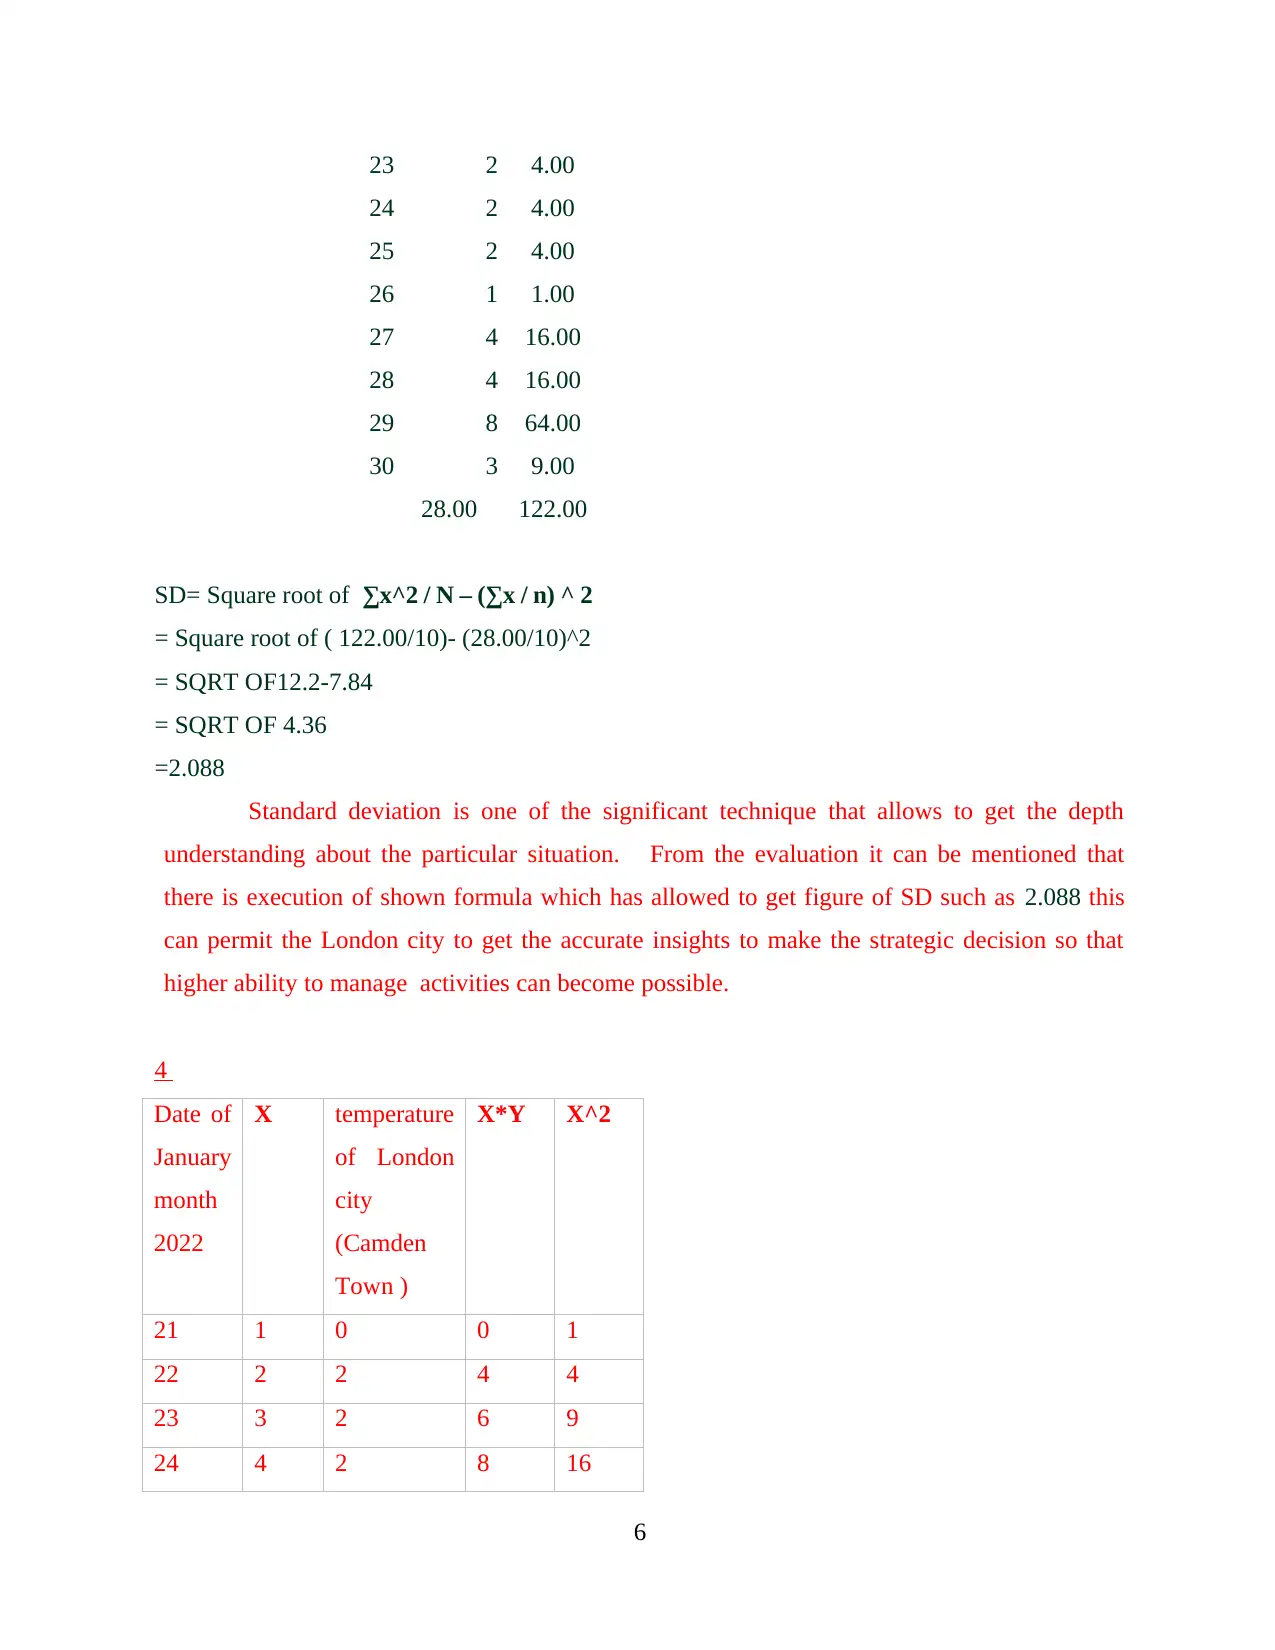
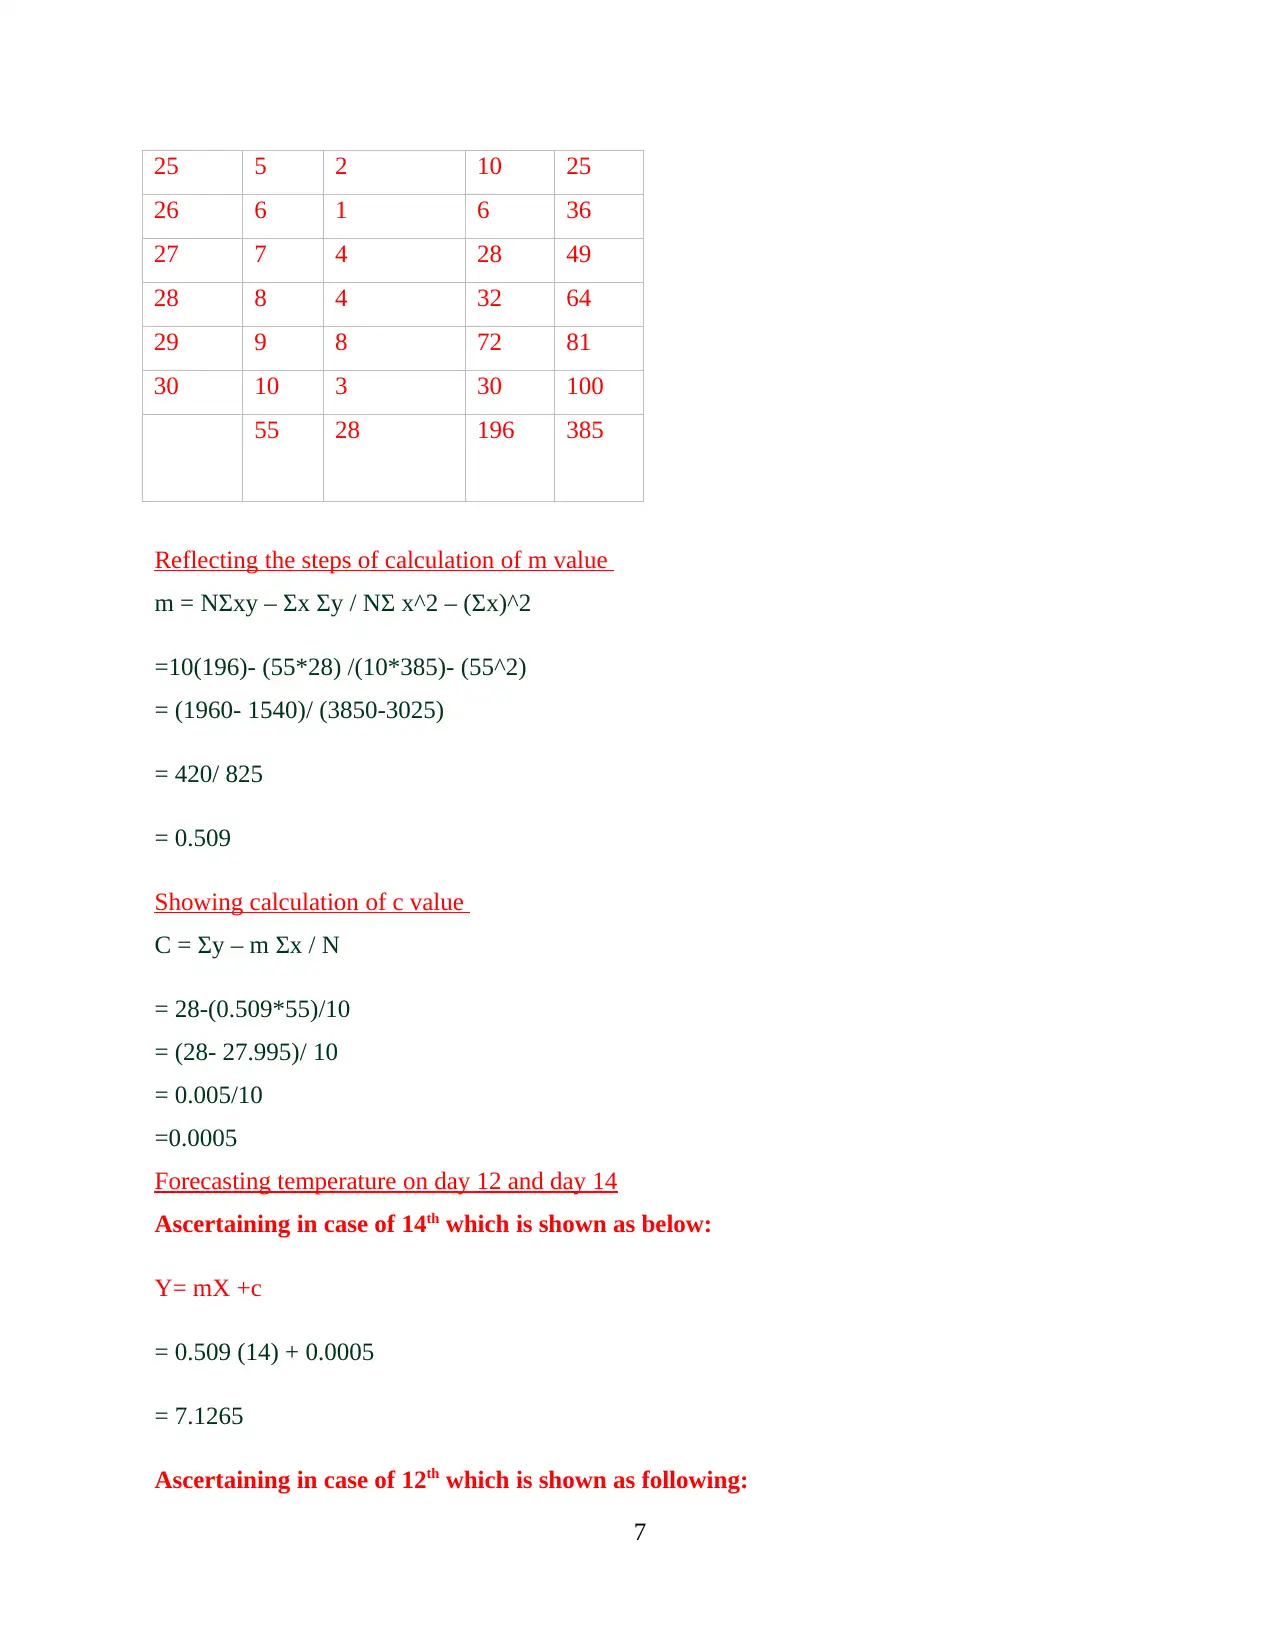
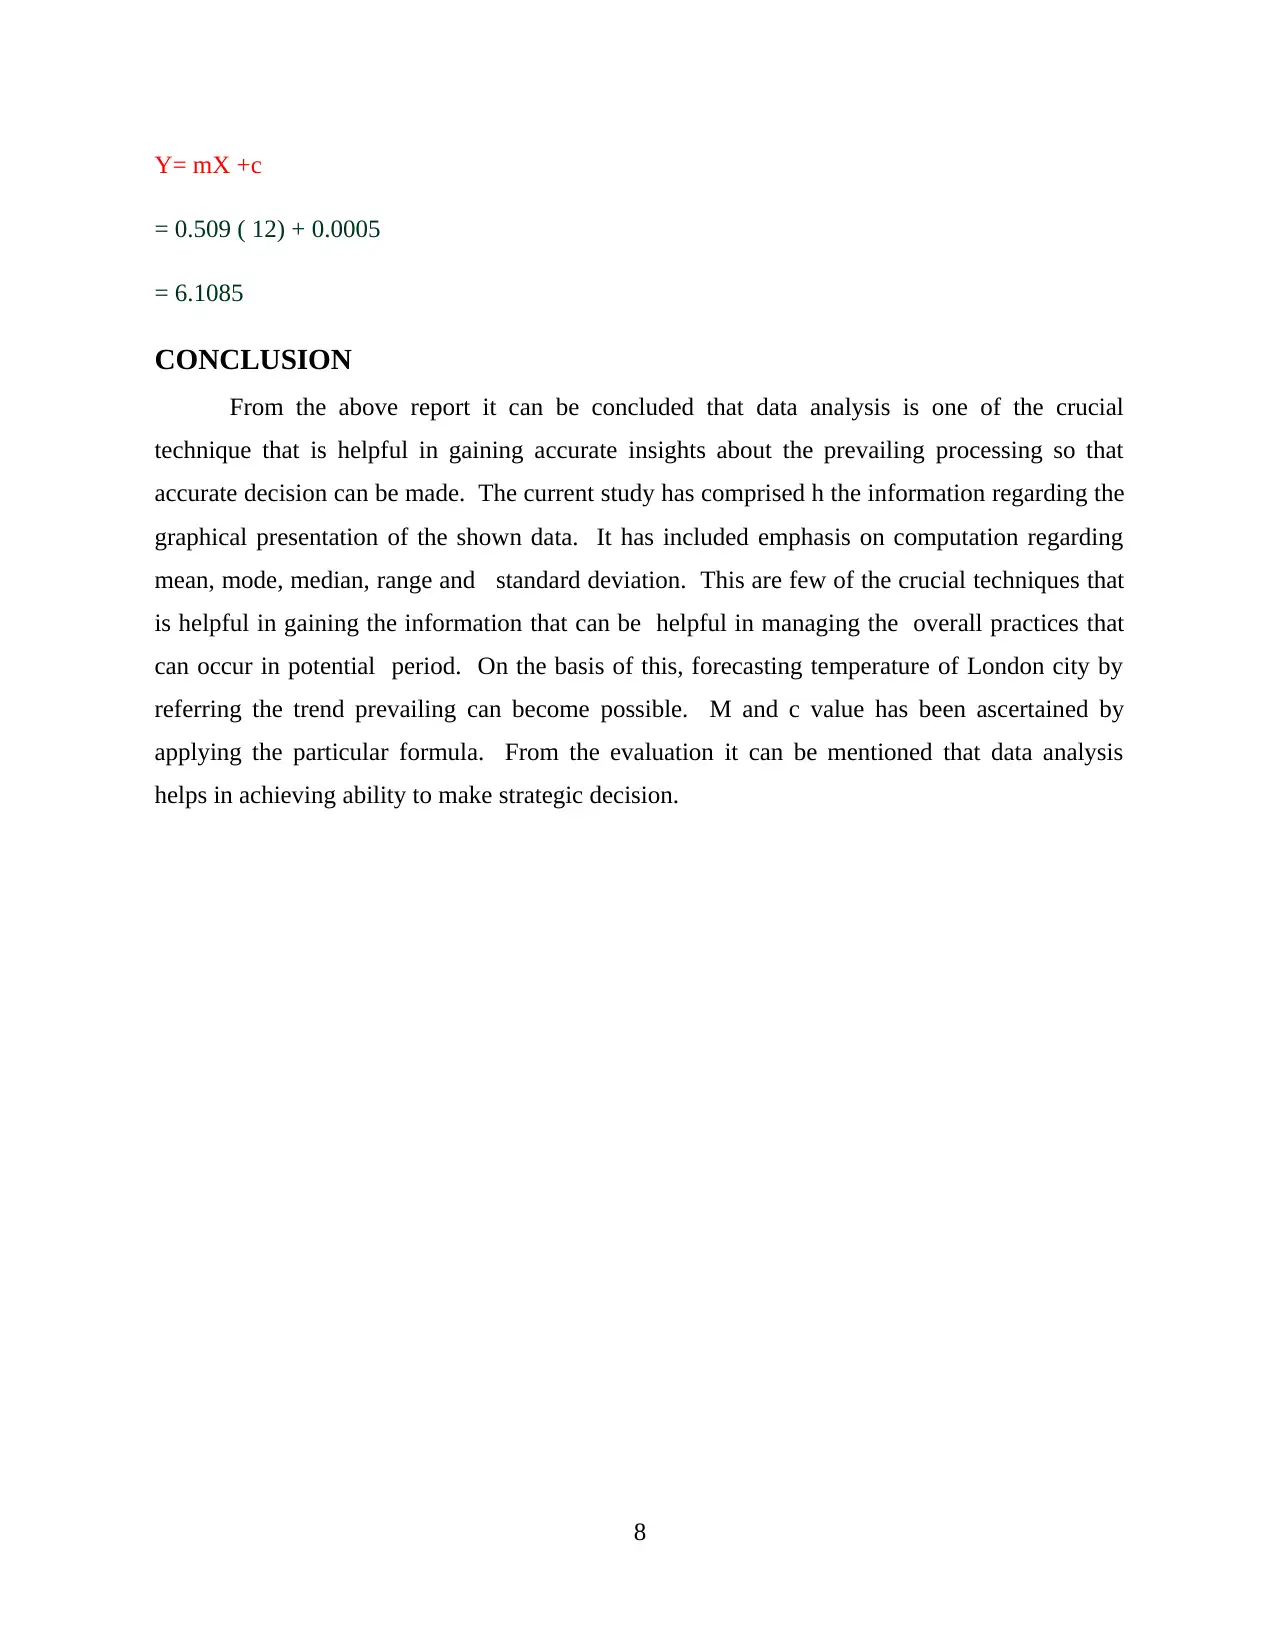
This report presents a data analysis and forecasting exercise focused on temperature trends in London, specifically Camden Town, from January 21, 2022, to January 30, 2022. The analysis includes arranging the temperature data in a tabular format, presenting it using appropriate charts, and calculating key statistical measures such as mean, median, mode, range, and standard deviation. Furthermore, the report details the calculation of 'm' and 'c' values for linear regression to forecast temperatures for day 12 and day 14. The conclusion emphasizes the importance of data analysis in gaining accurate insights for strategic decision-making, highlighting its application in forecasting temperature trends in London. The report utilizes specific formulas and methodologies to derive these insights, demonstrating the practical application of data analysis techniques.
Document Page
Data Analysis and
Forecasting
tabler-icon-diamond-filled.svg

Paraphrase This Document

Need a fresh take? Get an instant paraphrase of this document with our AI Paraphraser
Document Page
TABLE OF CONTENTS
INTRODUCTION...........................................................................................................................1
MAIN BODY..................................................................................................................................1
1 Arranging the data in a table format.........................................................................................1
2 Presenting the data using any two type of appropriate charts..................................................2
3...................................................................................................................................................2
Calculating mean.........................................................................................................................2
Determining median....................................................................................................................3
Estimating mode..........................................................................................................................4
Ascertaining range.......................................................................................................................4
Determining standard deviation...................................................................................................5
4...................................................................................................................................................6
Reflecting the steps of calculation of m value.............................................................................6
Showing calculation of c value....................................................................................................7
Forecasting temperature on day 12 and day 14...........................................................................7
CONCLUSION................................................................................................................................7
REFERENCES................................................................................................................................8
Document Page
INTRODUCTION
Data analysis is concerned with having significant ability to evaluate the data in respect to
gain the information regarding the prevailing situation so that accurate decision can be made. In
the current era, data analysis plays significant role in influencing the competitiveness by
ensuring the success of business. The current report will pay attention on presenting that data
into tabular format and presenting them into the graphical mode. Current stud will shed light on
calculating mean, median, mode, range and standard deviation. Recent study will focus on
determining m, c and 14& 12 days value for the temperature of the London city regarding
Camden town .
MAIN BODY
1 Arranging the data in a table format
The chosen data (temperature in °c) is consecutive days from 21 January 2022 to 30 January
2022
S.No
Date of
January
month
2022
temperature
of London
city
(Camden
Town )
1 21 0
2 22 2
3 23 2
4 24 2
5 25 2
6 26 1
7 27 4
8 28 4
9 29 8
10 30 3
1
Document Page
2 Presenting the data using any two type of appropriate charts
3
Calculating mean
S.
No.
Date of
January
month
2022
tempreture
of London
city
(Camden
Town )
1 21 0
2 22 2
3 23 2
4 24 2
5 25 2
2
tabler-icon-diamond-filled.svg

Paraphrase This Document

Need a fresh take? Get an instant paraphrase of this document with our AI Paraphraser
Document Page
6 26 1
7 27 4
8 28 4
9 29 8
10 30 3
Total amount
of money
spent on
transportation
cost
28
Total number
of months 10
Mean 2.8
From the above table it can be interpreted that mean derived from the above table shown
regarding the value of temperature occurred for 10 days in London of Camden Town is 2.8. this
has been estimated by paying attention on obtaining total temperature of city divided by the sum
of the days (Dey, Bhatt and Ashour, 2018).
Determining median
Step 1: arranging data as per the ascending order
S. No.
Date of
January
month
2022
temperature of
London city
(Camden Town )
1 21 0
2 26 1
3 22 2
4 23 2
5 24 2
6 25 2
3
Document Page
7 30 3
8 27 4
9 28 4
10 29 8
The above shown data has been arranged as per the ascending order.
Step 2: Determining of median value by executing the formula (n+1)/2
Median
(M)
Number of
observations 10
M (10+1)/2 5.5
(2+2)/2 2
The median value has been ascertained by paying attention on gaining the formula
which (n+1)/2 (Gupta and Kapoor, 2020). This has helped to ascertain the value of median such
as 2 that has been obtained by referring 5th & 6th cell presented for temperature of the
mentioned city.
Estimating mode
S. No.
Date of
January
month 2022
tempreture
of London
city
(Camden
Town )
1 21 0
2 22 2
3 23 2
4 24 2
5 25 2
6 26 1
7 27 4
8 28 4
4
Document Page
9 29 8
10 30 3
The mode refers to the figure which has higher frequency (Elliott, 2018). In current case 2
is occurred 4 times thus, 2 is mode for the temperature occurred in the current case of
presentation shown for the mentioned city.
Ascertaining range
It is derived by looking at the formula which lower temperature figure is deducted from
higher so that depth so that significant details can be achieved (Mahdavinejad and et.al., 2018).
Particulars Formula Amount
Maximum expense 8
Minimum expense 2
Higher temperature -
smaller temperature
8-2= 6
From the evaluation of the shown figure regarding the range calculation it can be
mentioned that 6 is the range as the highest and lowest temperature figures are 8 & 2
respectively.
Determining standard deviation
Date of January month
2022
temperat
ure of
London
city
(Camden
Town ) x^2
21 0 0.00
22 2 4.00
5
tabler-icon-diamond-filled.svg

Paraphrase This Document

Need a fresh take? Get an instant paraphrase of this document with our AI Paraphraser
Document Page
23 2 4.00
24 2 4.00
25 2 4.00
26 1 1.00
27 4 16.00
28 4 16.00
29 8 64.00
30 3 9.00
28.00 122.00
SD= Square root of ∑x^2 / N – (∑x / n) ^ 2
= Square root of ( 122.00/10)- (28.00/10)^2
= SQRT OF12.2-7.84
= SQRT OF 4.36
=2.088
Standard deviation is one of the significant technique that allows to get the depth
understanding about the particular situation. From the evaluation it can be mentioned that
there is execution of shown formula which has allowed to get figure of SD such as 2.088 this
can permit the London city to get the accurate insights to make the strategic decision so that
higher ability to manage activities can become possible.
4
Date of
January
month
2022
X temperature
of London
city
(Camden
Town )
X*Y X^2
21 1 0 0 1
22 2 2 4 4
23 3 2 6 9
24 4 2 8 16
6
Document Page
25 5 2 10 25
26 6 1 6 36
27 7 4 28 49
28 8 4 32 64
29 9 8 72 81
30 10 3 30 100
55 28 196 385
Reflecting the steps of calculation of m value
m = NΣxy – Σx Σy / NΣ x^2 – (Σx)^2
=10(196)- (55*28) /(10*385)- (55^2)
= (1960- 1540)/ (3850-3025)
= 420/ 825
= 0.509
Showing calculation of c value
C = Σy – m Σx / N
= 28-(0.509*55)/10
= (28- 27.995)/ 10
= 0.005/10
=0.0005
Forecasting temperature on day 12 and day 14
Ascertaining in case of 14th which is shown as below:
Y= mX +c
= 0.509 (14) + 0.0005
= 7.1265
Ascertaining in case of 12th which is shown as following:
7
Document Page
Y= mX +c
= 0.509 ( 12) + 0.0005
= 6.1085
CONCLUSION
From the above report it can be concluded that data analysis is one of the crucial
technique that is helpful in gaining accurate insights about the prevailing processing so that
accurate decision can be made. The current study has comprised h the information regarding the
graphical presentation of the shown data. It has included emphasis on computation regarding
mean, mode, median, range and standard deviation. This are few of the crucial techniques that
is helpful in gaining the information that can be helpful in managing the overall practices that
can occur in potential period. On the basis of this, forecasting temperature of London city by
referring the trend prevailing can become possible. M and c value has been ascertained by
applying the particular formula. From the evaluation it can be mentioned that data analysis
helps in achieving ability to make strategic decision.
8
tabler-icon-diamond-filled.svg

Paraphrase This Document

Need a fresh take? Get an instant paraphrase of this document with our AI Paraphraser
Document Page
REFERENCES
Books and Journals
Dey, N., Bhatt, C. and Ashour, A.S., 2018. Big data for remote sensing: Visualization, analysis
and interpretation. Cham: Springe. p.104.
Elliott, V., 2018. Thinking about the coding process in qualitative data analysis. The Qualitative
Report. 23(11). pp.2850-2861.
Gupta, S.C. and Kapoor, V.K., 2020. Fundamentals of mathematical statistics. Sultan Chand &
Sons.
Mahdavinejad, M.S. and et.al., 2018. Machine learning for Internet of Things data analysis: A
survey. Digital Communications and Networks. 4(3). pp.161-175.
9
chevron_up_icon
1 out of 11
circle_padding
hide_on_mobile
zoom_out_icon
[object Object]