Data Analysis and Forecasting: Urban Vehicle Analysis Project
VerifiedAdded on 2023/01/12
|10
|1838
|39
Project
AI Summary
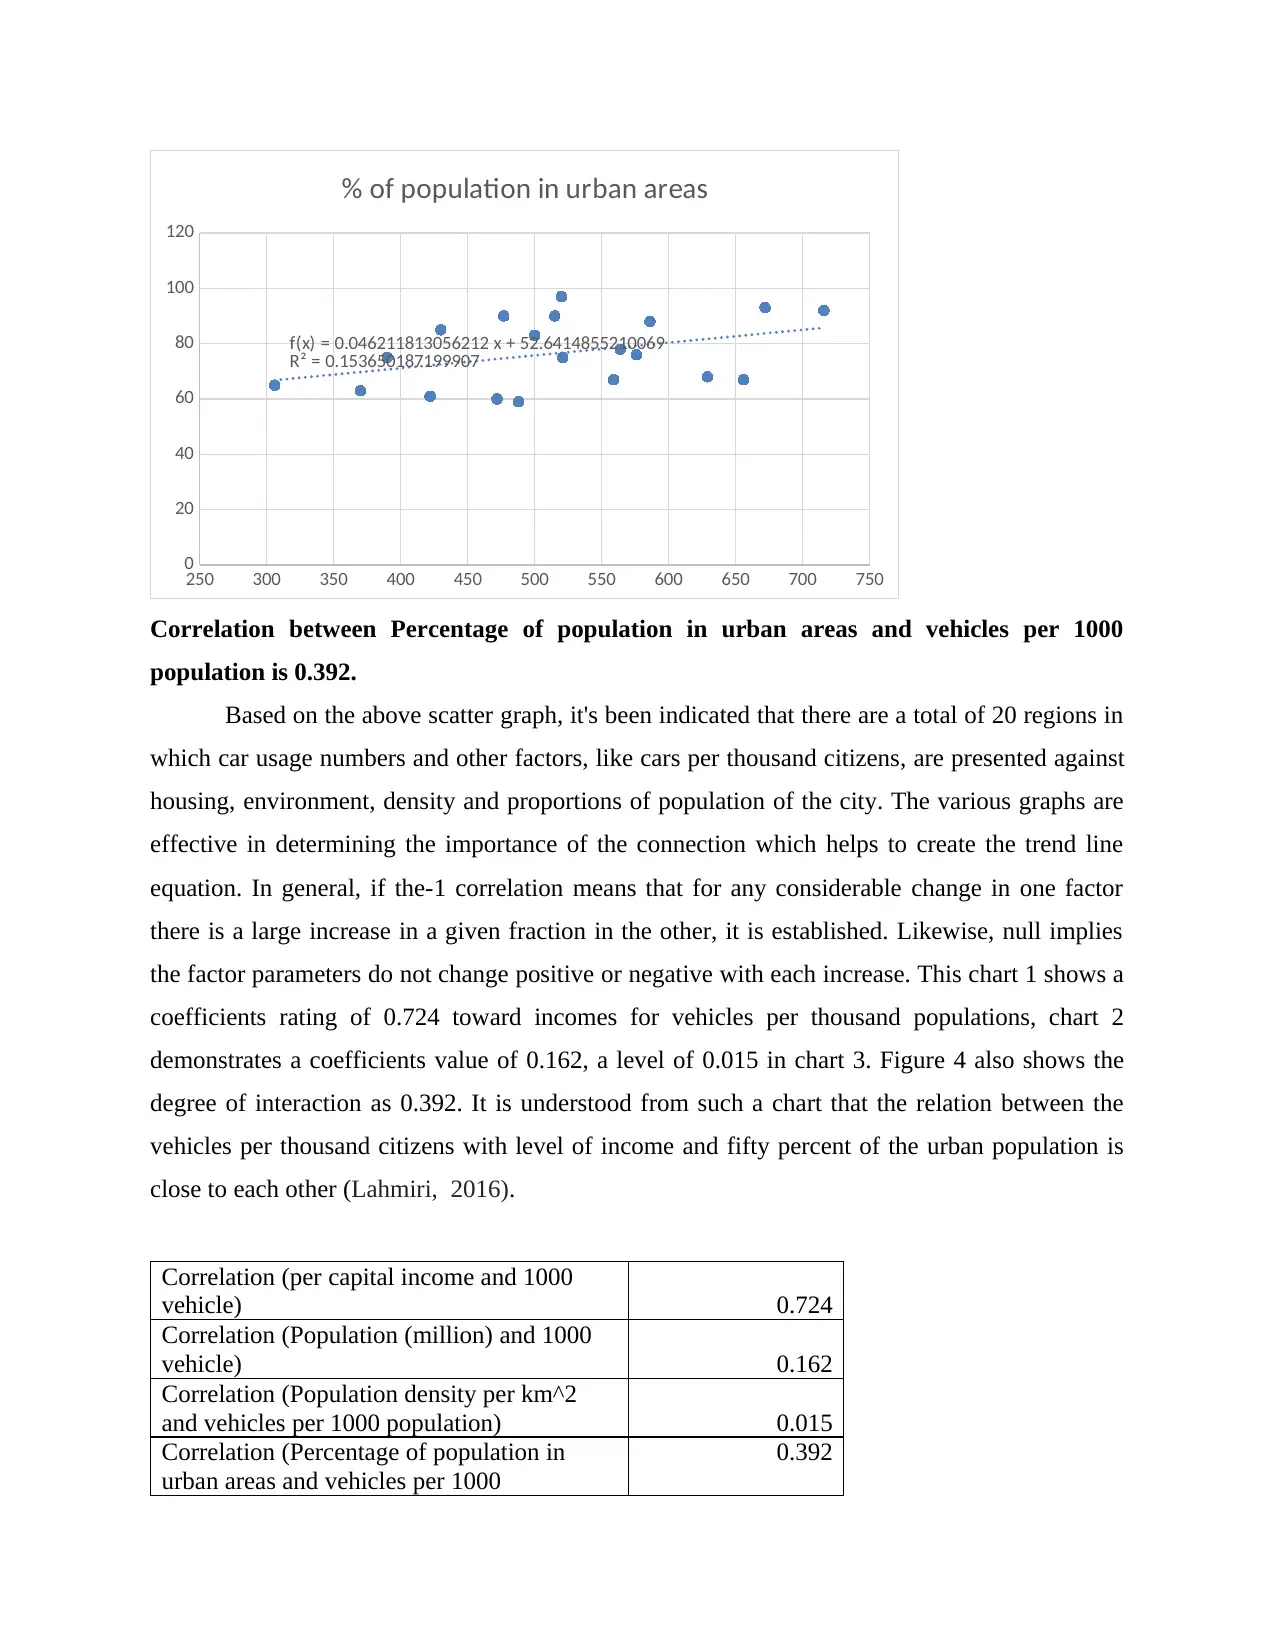
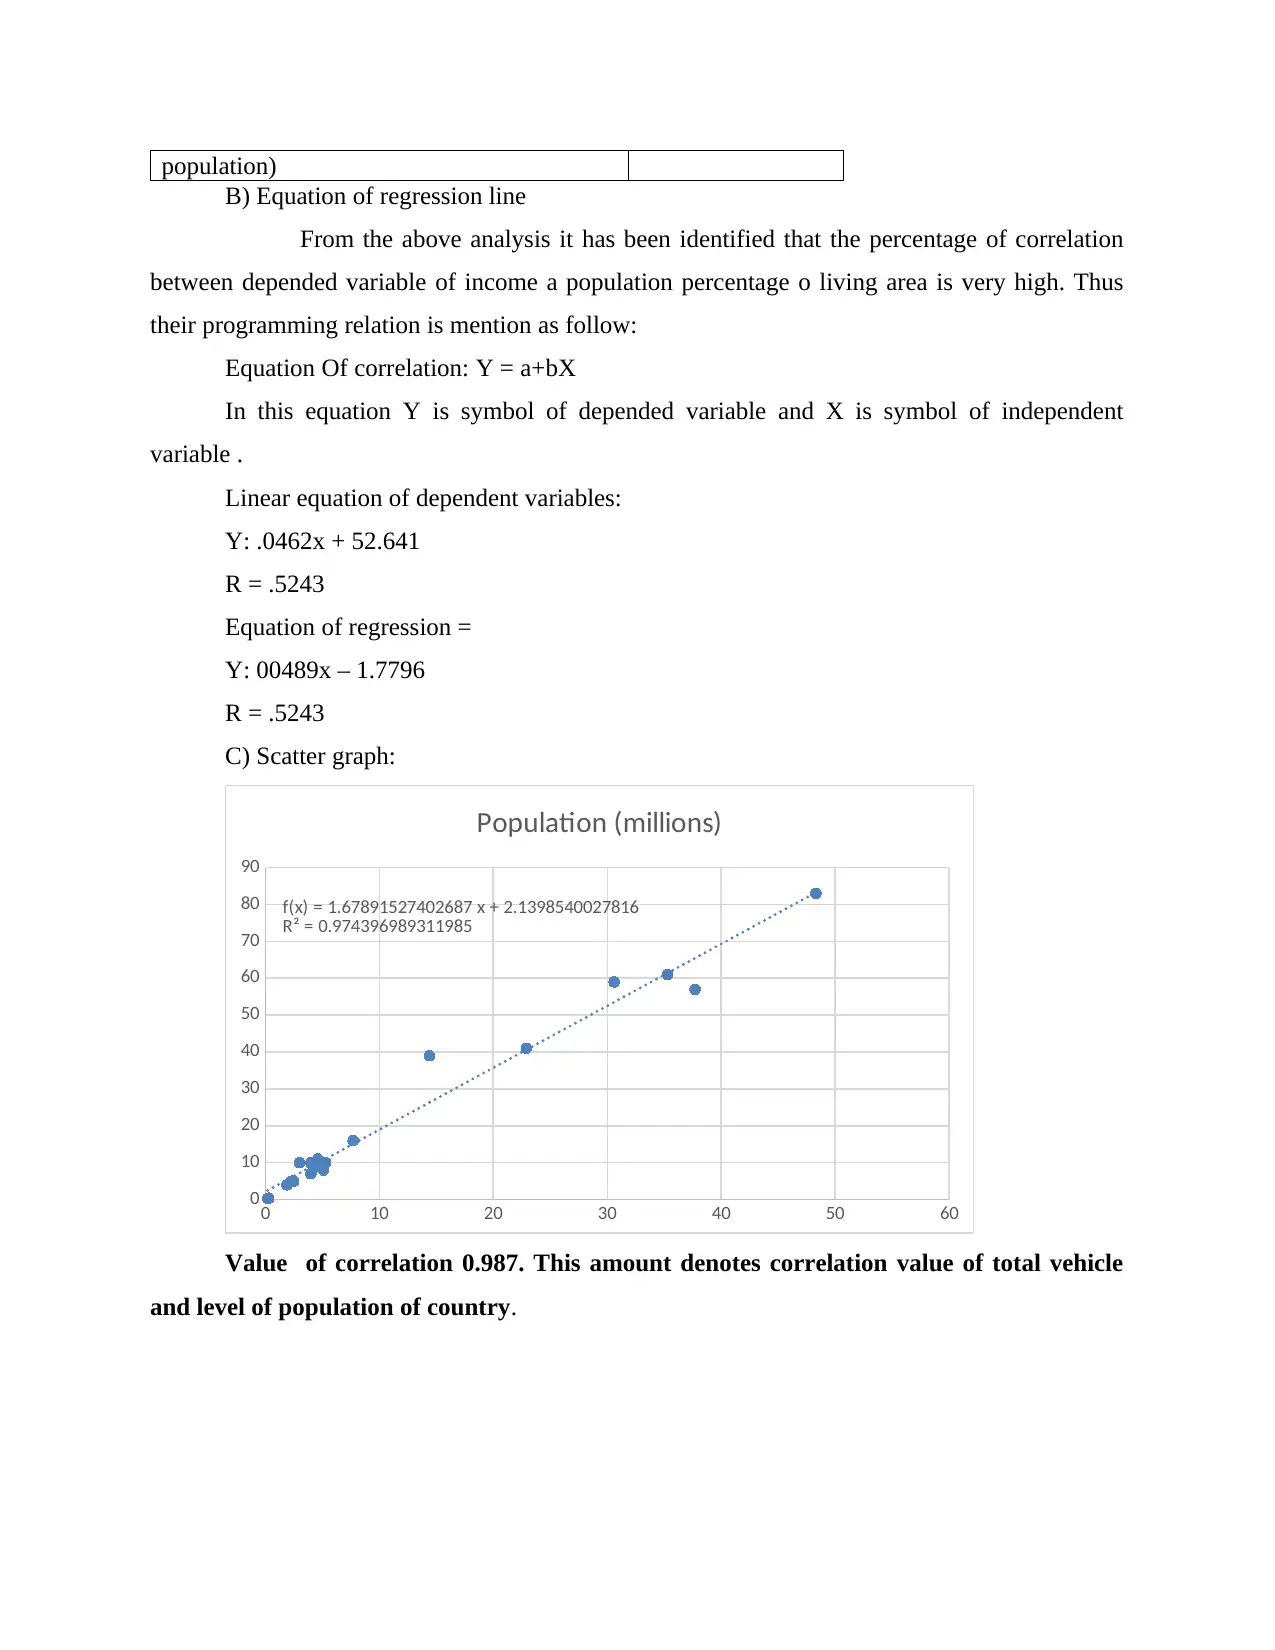
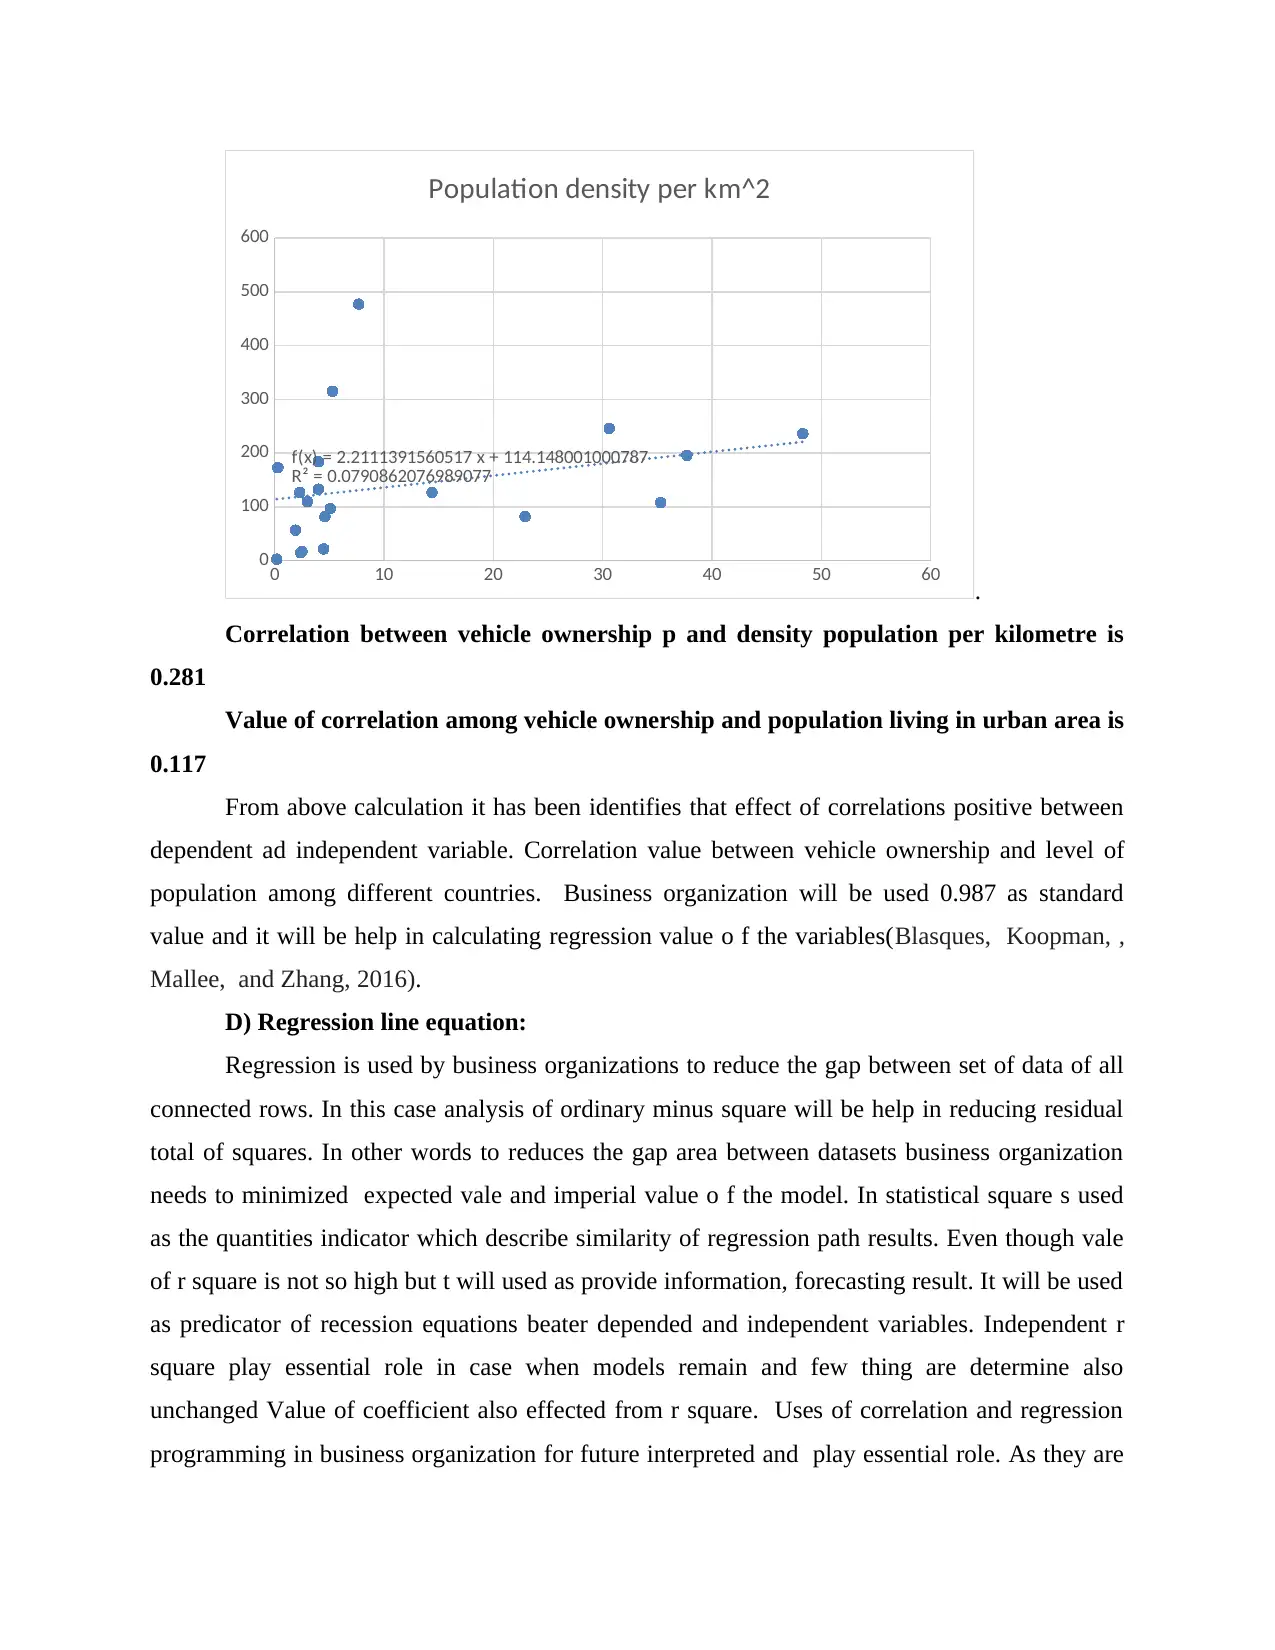
This project analyzes and forecasts vehicle trends in urban areas of Turkey using data analysis and forecasting techniques. The study employs scatter graphs, regression analysis, and correlation to determine the relationship between variables such as per capita income, population, population density, and the percentage of the population in urban areas, with vehicle ownership. The report includes calculations of correlation coefficients and the development of regression equations to model these relationships. The findings indicate a positive correlation between income and urban population with vehicle ownership, which is used to forecast future trends. The project concludes with the importance of statistical techniques in making informed business decisions, forecasting, and optimizing resource allocation within the automotive industry. The analysis provides insights into how car manufacturers can leverage these techniques to improve sales and understand market dynamics.

Individual assessment
(Data Analysis and
Forecasting)
(Data Analysis and
Forecasting)
Secure Best Marks with AI Grader
Need help grading? Try our AI Grader for instant feedback on your assignments.

Abstract
This research demonstrates valuable concepts of data interpretation and estimation that
assist in determining the value of the total population and vehicles used in urban areas of Turkey.
The theory of the regression method is useful in recognizing the actual interaction of variables
which inhibits positive decision making.

INTRODUCTION
Data analysis is characterized as a process of obtaining valuable information related to a
specific project or allowing the detection of biggest problems or any other key findings within an
organization and enabling for effective analysis. Data processing can be beneficial in many ways
for organizations that deal in huge numbers, as it offers a concise summary of the particular
occurrence of operation that leads to successful decision-making. It also helps to create accurate
forecasts of future prospects and business results which can be accomplished by diligent
execution of a strategy. This report shows various graph and line of correlation estimates.
MAIN BODY
A) Scatter graphs
Scatter graphs are basically a type of chart or diagram to be used as a mathematical
Matrix multiplication that allows show as part of the data set the importance of two kinds of
variables. The orientation of each symbol indicates values for a data point on the horizontally
and vertically axes (Zhang, and en.at, 2016.
250 300 350 400 450 500 550 600 650 700 750
0
5
10
15
20
25
30
35
40
45
f(x) = 0.0489334761627906 x − 1.77956071659877
R² = 0.524276234325444
Per capita income

Correlation between per capita income and vehicles per 1000 population is 0.724.
250 300 350 400 450 500 550 600 650 700 750
0
10
20
30
40
50
60
70
80
90
f(x) = 0.0382113047764338 x + 2.22434903865789
R² = 0.0261604503904177
Population (millions)
Correlation between Population and vehicles per 1000 population is 0.162.
250 300 350 400 450 500 550 600 650 700 750
0
100
200
300
400
500
600
f(x) = 0.0168472976576774 x + 131.615518529377
R² = 0.000237964518570277
Population density per km^2
Correlation between Population density per km^2 and vehicles per 1000 population is
0.015 (Wang, and Sun, 2015).
250 300 350 400 450 500 550 600 650 700 750
0
10
20
30
40
50
60
70
80
90
f(x) = 0.0382113047764338 x + 2.22434903865789
R² = 0.0261604503904177
Population (millions)
Correlation between Population and vehicles per 1000 population is 0.162.
250 300 350 400 450 500 550 600 650 700 750
0
100
200
300
400
500
600
f(x) = 0.0168472976576774 x + 131.615518529377
R² = 0.000237964518570277
Population density per km^2
Correlation between Population density per km^2 and vehicles per 1000 population is
0.015 (Wang, and Sun, 2015).
Secure Best Marks with AI Grader
Need help grading? Try our AI Grader for instant feedback on your assignments.

250 300 350 400 450 500 550 600 650 700 750
0
20
40
60
80
100
120
f(x) = 0.046211813056212 x + 52.6414855210069
R² = 0.153650187199907
% of population in urban areas
Correlation between Percentage of population in urban areas and vehicles per 1000
population is 0.392.
Based on the above scatter graph, it's been indicated that there are a total of 20 regions in
which car usage numbers and other factors, like cars per thousand citizens, are presented against
housing, environment, density and proportions of population of the city. The various graphs are
effective in determining the importance of the connection which helps to create the trend line
equation. In general, if the-1 correlation means that for any considerable change in one factor
there is a large increase in a given fraction in the other, it is established. Likewise, null implies
the factor parameters do not change positive or negative with each increase. This chart 1 shows a
coefficients rating of 0.724 toward incomes for vehicles per thousand populations, chart 2
demonstrates a coefficients value of 0.162, a level of 0.015 in chart 3. Figure 4 also shows the
degree of interaction as 0.392. It is understood from such a chart that the relation between the
vehicles per thousand citizens with level of income and fifty percent of the urban population is
close to each other (Lahmiri, 2016).
Correlation (per capital income and 1000
vehicle) 0.724
Correlation (Population (million) and 1000
vehicle) 0.162
Correlation (Population density per km^2
and vehicles per 1000 population) 0.015
Correlation (Percentage of population in
urban areas and vehicles per 1000
0.392

population)
B) Equation of regression line
From the above analysis it has been identified that the percentage of correlation
between depended variable of income a population percentage o living area is very high. Thus
their programming relation is mention as follow:
Equation Of correlation: Y = a+bX
In this equation Y is symbol of depended variable and X is symbol of independent
variable .
Linear equation of dependent variables:
Y: .0462x + 52.641
R = .5243
Equation of regression =
Y: 00489x – 1.7796
R = .5243
C) Scatter graph:
0 10 20 30 40 50 60
0
10
20
30
40
50
60
70
80
90
f(x) = 1.67891527402687 x + 2.1398540027816
R² = 0.974396989311985
Population (millions)
Value of correlation 0.987. This amount denotes correlation value of total vehicle
and level of population of country.

0 10 20 30 40 50 60
0
100
200
300
400
500
600
f(x) = 2.2111391560517 x + 114.148001000787
R² = 0.0790862076989077
Population density per km^2
.
Correlation between vehicle ownership p and density population per kilometre is
0.281
Value of correlation among vehicle ownership and population living in urban area is
0.117
From above calculation it has been identifies that effect of correlations positive between
dependent ad independent variable. Correlation value between vehicle ownership and level of
population among different countries. Business organization will be used 0.987 as standard
value and it will be help in calculating regression value o f the variables(Blasques, Koopman, ,
Mallee, and Zhang, 2016).
D) Regression line equation:
Regression is used by business organizations to reduce the gap between set of data of all
connected rows. In this case analysis of ordinary minus square will be help in reducing residual
total of squares. In other words to reduces the gap area between datasets business organization
needs to minimized expected vale and imperial value o f the model. In statistical square s used
as the quantities indicator which describe similarity of regression path results. Even though vale
of r square is not so high but t will used as provide information, forecasting result. It will be used
as predicator of recession equations beater depended and independent variables. Independent r
square play essential role in case when models remain and few thing are determine also
unchanged Value of coefficient also effected from r square. Uses of correlation and regression
programming in business organization for future interpreted and play essential role. As they are
Paraphrase This Document
Need a fresh take? Get an instant paraphrase of this document with our AI Paraphraser

cost effective tools and they held in providing accurate an reliable result. With theses of these
tools business organization get relevant knowledge.
From the Above scatter plot analysis it has been analysis identify that most relevant value
of coefficient founded in between total vehicle ownerships and level of population in countries.
Thus equation of linear regression is calculated as follows:
Y: 1.6789x + 2.1399
R: .09744
Regression equation for total vehicle and population density in different countries:
Value of vehicles per 1000 population:
Y:0.0489x-1.7796
R: .5243
Total vehicle ownership and population is follows:
Y: 2.211x+114.15
R: 0.0791
With the use of these these two equation of regression car manufacturing business entity
will increases their sales a\volume through providing best qualities of product to their customers
according to their preferences.
Mangers of car industries use linear programming equation for forecasting future plans
and policies success rate. Negative impact of of coefficient value show negative interaction with
coefficient of regression which showcase positive affect on automobile industry. Foe each model
of mathematics essential elements are the determination of the topic of research and martek area
of the relevet topc. Regression and coffrcient of regessrion hel in mangeming indusir resors in
significant way. It will provides and imact positively on whole business organization. Hese tools
of statisc help in provdig direction in oreder to achibe business goals syametice maner. It will
helo in transforming valuea nafinformation inreal life industries. All theses methoes will help in
innovating ne techniwa, sevixe qad products in maket aea. Car manufactung ndusties uses this
tols to minimixae thei cost an maximize return th the uses of tcrrelatin techniques.It will hel in
incsesn operationa quality of thebusness entities.
Future values by using liner regression:

Values calculates of linear programming regression equation in part b and part c it is
analyses the vehicle per 1000 population with turkey would be 518 on te other hand the total
vehicle per owner is 11.85(Wang, Wang, and Zhang, 2018).
CONCLUSION:
From the above analysis it has been concluded that statistical techniques and tools
play essential p art in successfully run business organizations. They will help in taking effective
business decision by identify element and accurate future information. It will also used in
comparisons and for performance evolution f business organization with their rival industries,
Regression and correlation equations help in in taking decision which help in reducing cost of
producing predict. Manger uses these tools to optimum utilization of their scare resource.

REFERENCES
Books and Journals
Zhang, Y., Zhang, G., Chen, H., Porter, A.L., Zhu, D. and Lu, J., 2016. Topic analysis and
forecasting for science, technology and innovation: Methodology with a case study
focusing on big data research. Technological Forecasting and Social Change, 105,
pp.179-191.
Wang, D. and Sun, Z., 2015. Big data analysis and parallel load forecasting of electric power
user side. Proceedings of the CSEE, 35(3), pp.527-537.
Lahmiri, S., 2016. A variational mode decompoisition approach for analysis and forecasting of
economic and financial time series. Expert Systems with Applications, 55, pp.268-273.
Li, X., Lv, Z., Wang, W., Zhang, B., Hu, J., Yin, L. and Feng, S., 2016. WebVRGIS based traffic
analysis and visualization system. Advances in Engineering Software, 93, pp.1-8.
Blasques, F., Koopman, S.J., Mallee, M. and Zhang, Z., 2016. Weighted maximum likelihood for
dynamic factor analysis and forecasting with mixed frequency data. Journal of
Econometrics, 193(2), pp.405-417.
Wang, J., Wang, C. and Zhang, W., 2018. Data Analysis and Forecasting of Tuberculosis
Prevalence Rates for Smart Healthcare Based on a Novel Combination Model. Applied
Sciences, 8(9), p.1693.
1 out of 10
Related Documents

Your All-in-One AI-Powered Toolkit for Academic Success.
+13062052269
info@desklib.com
Available 24*7 on WhatsApp / Email
Unlock your academic potential
© 2024 | Zucol Services PVT LTD | All rights reserved.