Data Analysis and Forecasting Project Report - Manchester Wind Speed

Verified

Added on  2021/02/21

|8
|838
|103
Project
AI Summary
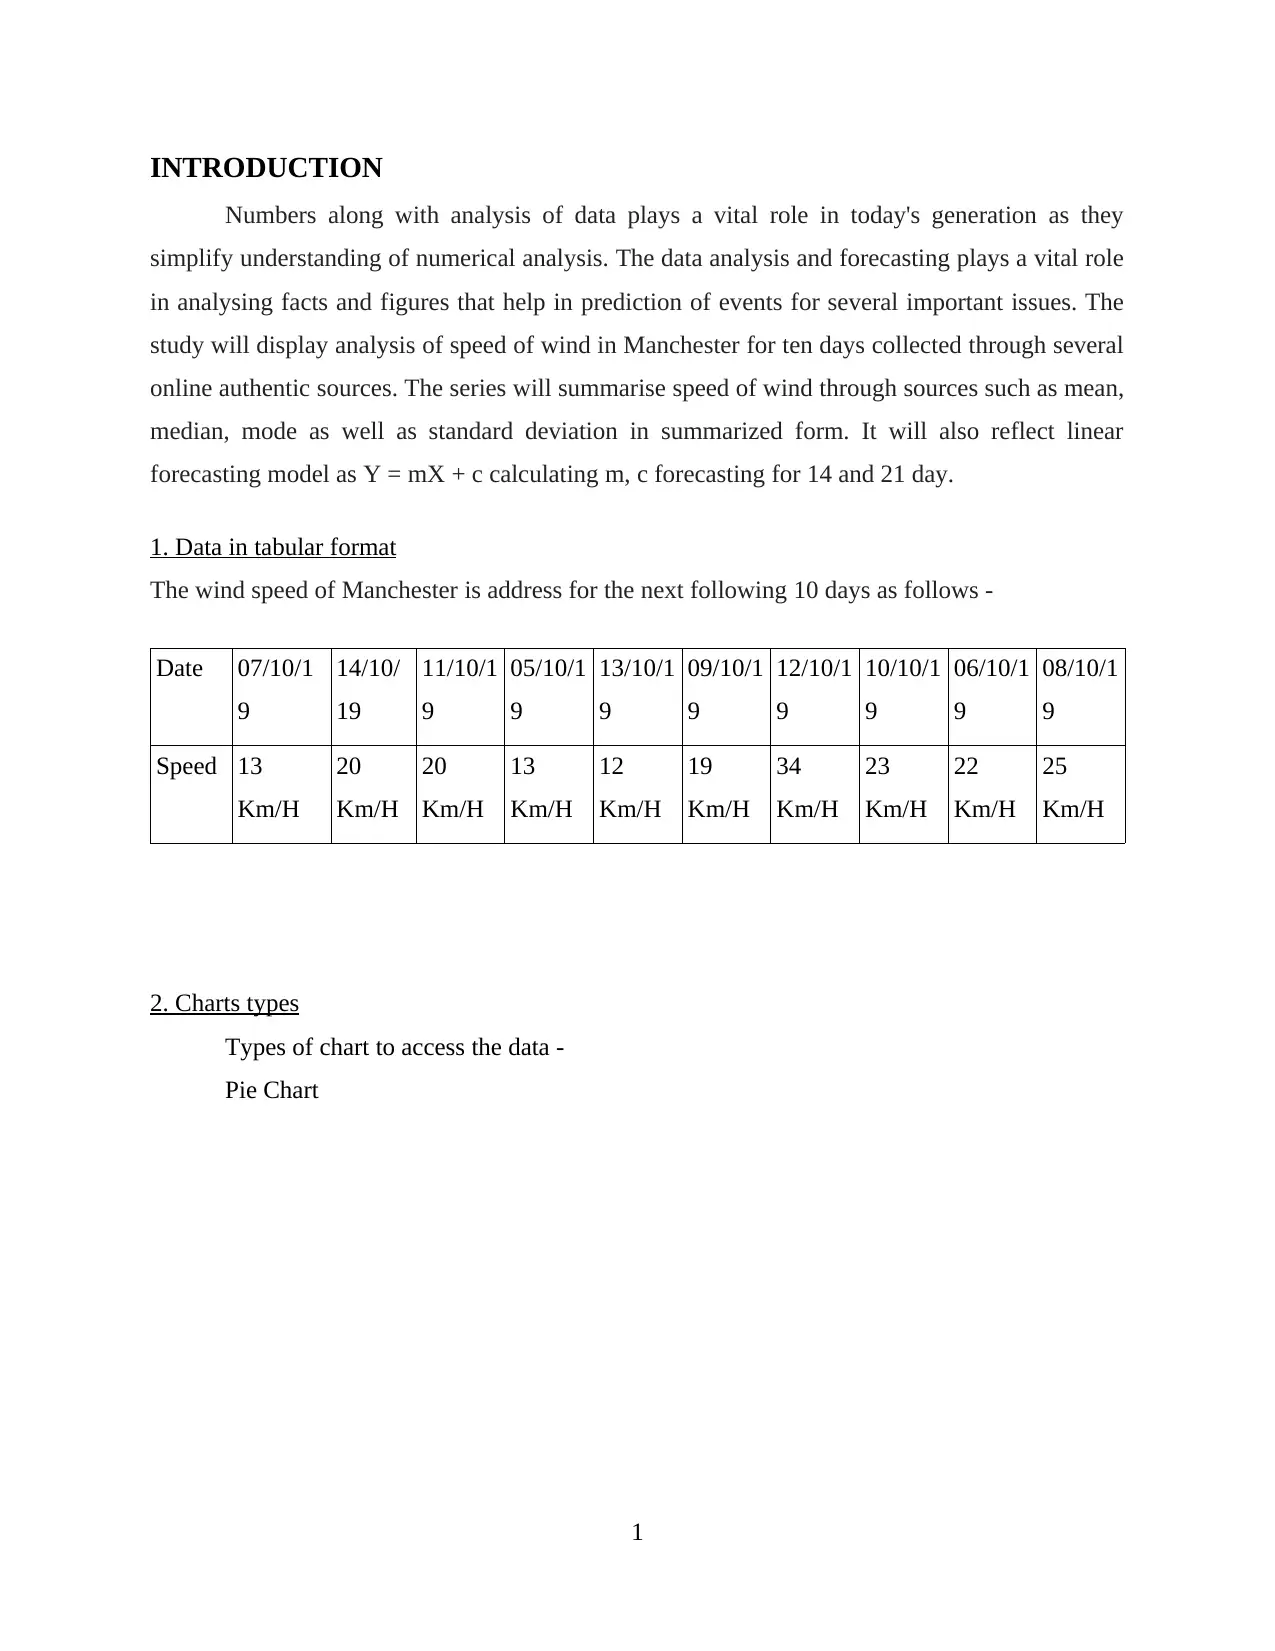
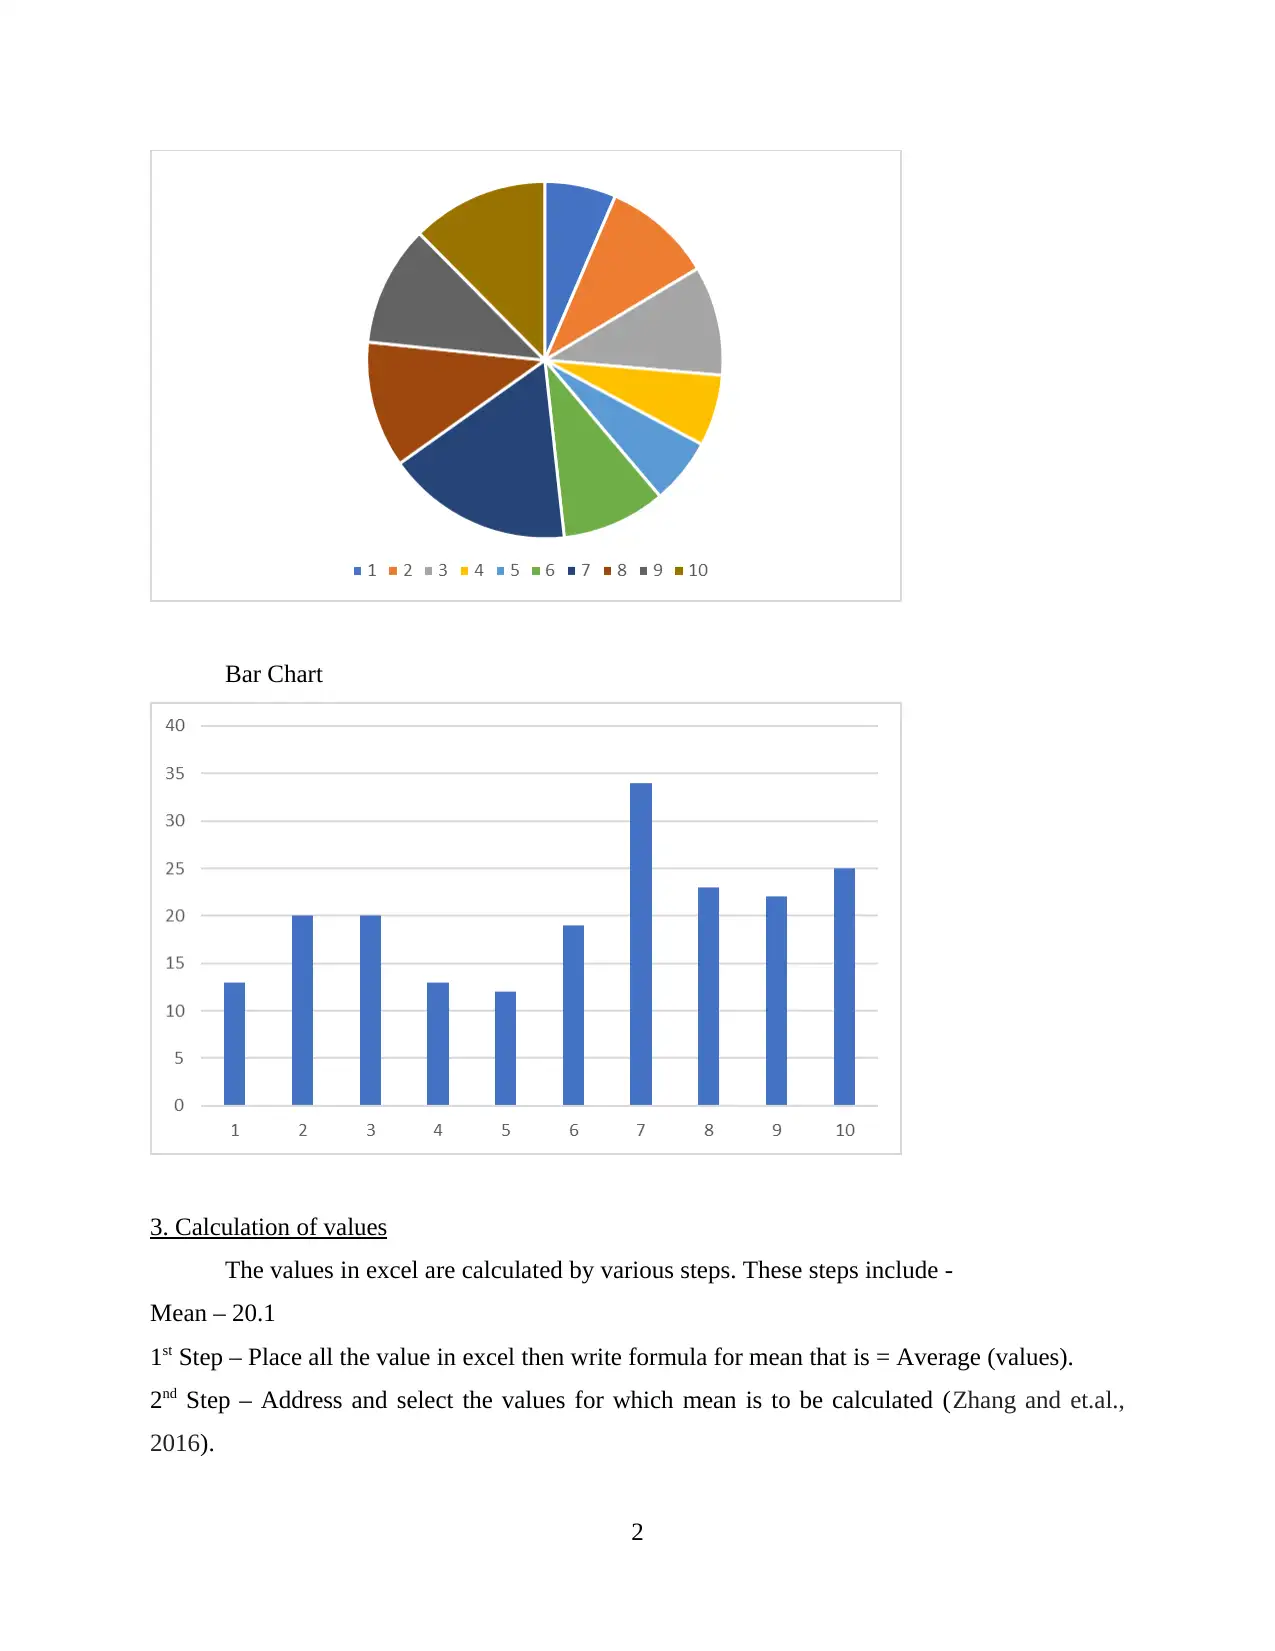
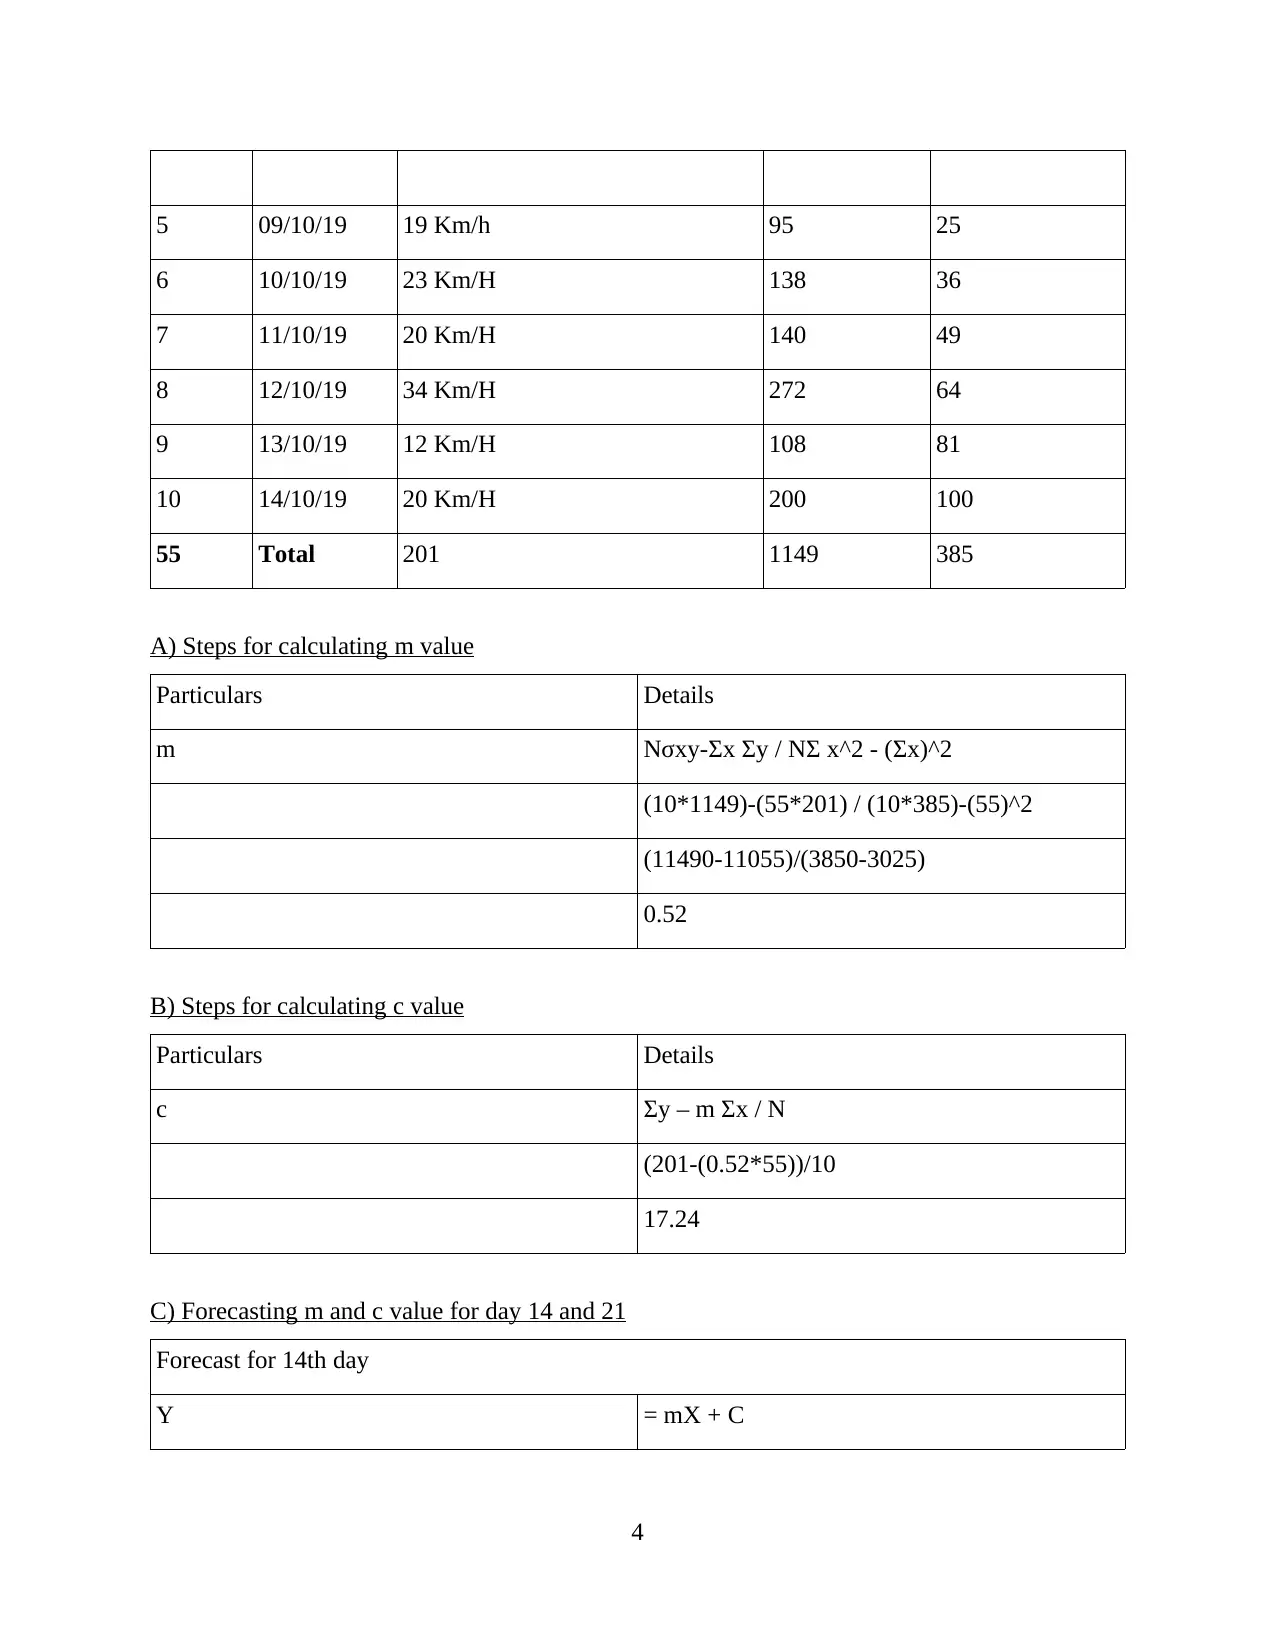
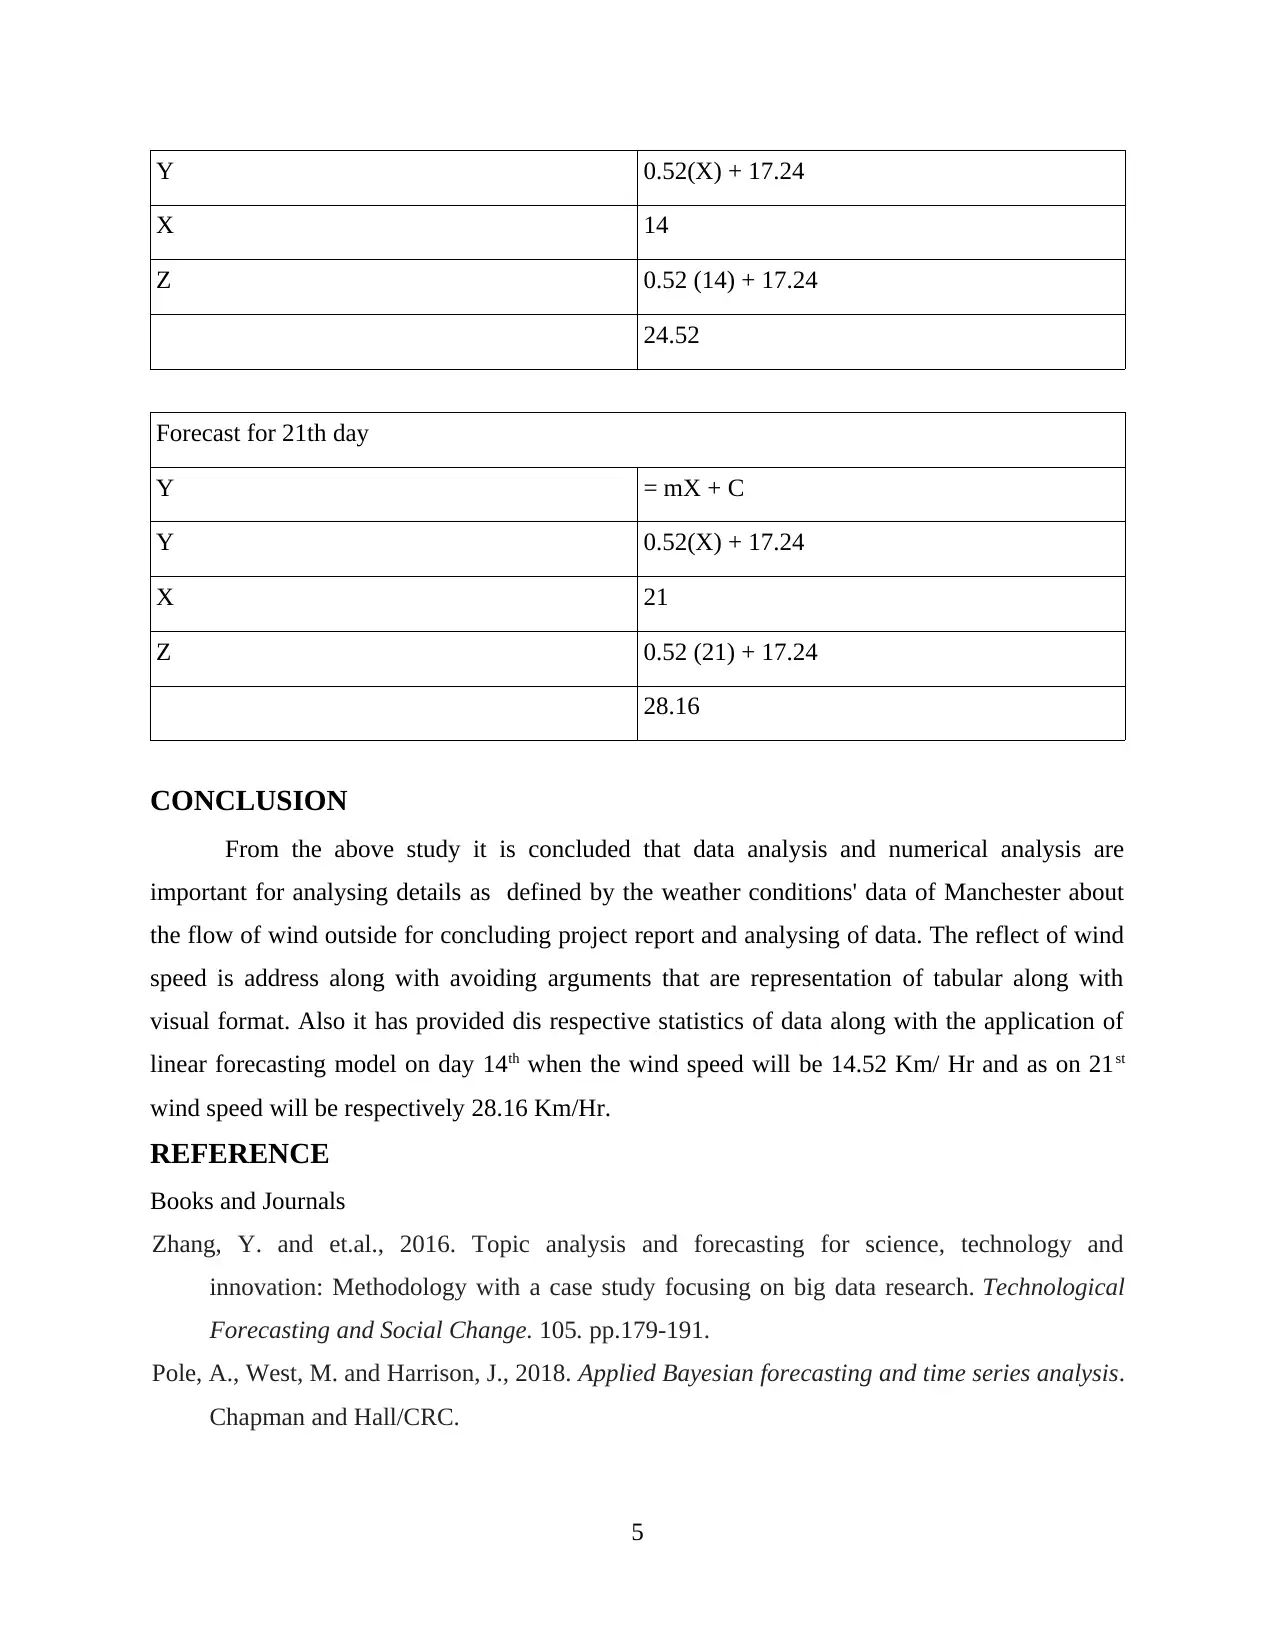
This project report presents a data analysis and forecasting study focused on wind speed in Manchester. The report begins with an introduction to data analysis and its importance, followed by a tabular representation of wind speed data over ten days. Various data analysis techniques are applied, including the calculation of mean, median, mode, and standard deviation. The core of the report involves the implementation of a linear forecasting model (Y = mX + c) to predict future wind speeds. The report details the steps for calculating the 'm' and 'c' values, followed by forecasts for wind speeds on the 14th and 21st days. The conclusion summarizes the findings and emphasizes the significance of data analysis in predicting events. The report also includes a list of relevant references.
Document Page
PROJECT REPORT ON DATA ANALYSIS
AND FORECASTING
tabler-icon-diamond-filled.svg

Secure Best Marks with AI Grader

Need help grading? Try our AI Grader for instant feedback on your assignments.
Document Page
Table of Contents
INTRODUCTION...........................................................................................................................1
1. Data in tabular format..............................................................................................................1
2. Charts types.............................................................................................................................1
3. Calculation of values...............................................................................................................2
4. Apply linear forecasting model...............................................................................................3
A) Steps for calculating m value.................................................................................................4
B) Steps for calculating c value...................................................................................................4
C) Forecasting m and c value for day 14 and 21.........................................................................4
CONCLUSION................................................................................................................................5
REFERENCE..................................................................................................................................5
Document Page
INTRODUCTION
Numbers along with analysis of data plays a vital role in today's generation as they
simplify understanding of numerical analysis. The data analysis and forecasting plays a vital role
in analysing facts and figures that help in prediction of events for several important issues. The
study will display analysis of speed of wind in Manchester for ten days collected through several
online authentic sources. The series will summarise speed of wind through sources such as mean,
median, mode as well as standard deviation in summarized form. It will also reflect linear
forecasting model as Y = mX + c calculating m, c forecasting for 14 and 21 day.
1. Data in tabular format
The wind speed of Manchester is address for the next following 10 days as follows -
Date 07/10/1
9
14/10/
19
11/10/1
9
05/10/1
9
13/10/1
9
09/10/1
9
12/10/1
9
10/10/1
9
06/10/1
9
08/10/1
9
Speed 13
Km/H
20
Km/H
20
Km/H
13
Km/H
12
Km/H
19
Km/H
34
Km/H
23
Km/H
22
Km/H
25
Km/H
2. Charts types
Types of chart to access the data -
Pie Chart
1
Document Page
Bar Chart
3. Calculation of values
The values in excel are calculated by various steps. These steps include -
Mean – 20.1
1st Step – Place all the value in excel then write formula for mean that is = Average (values).
2nd Step – Address and select the values for which mean is to be calculated (Zhang and et.al.,
2016).
2
tabler-icon-diamond-filled.svg

Secure Best Marks with AI Grader

Need help grading? Try our AI Grader for instant feedback on your assignments.
Document Page
3rd Step – Press enter after selection of values.
Median – 20
1st Step – Below the values write formula for median which is = median (values).
2nd Step – Address and select the values for which mean is to be calculated.
3rd Step – Press enter after selection of values (Shah, Yokoyama and Kakimoto, 2015).
Mode – 13
1st Step – Open excel and mention all the values in it.
2nd Step – Place formula of mode below the values which is = mode (values).
3rd Step – Select column to calculate the answer (Wang and Sun, 2015).
4th Step – To generate results press enter (Ferlito, Adinolfi and Graditi, 2017).
Range – 22
1st Step – Open excel and mention all the values in it.
2nd Step – Place formula of range that is = max (value) – min (value)
3rd Step – To calculate range select dedicated columns
4th Step – Press enter thereafter.
Standard Deviation – 6.64
1st Step – Open excel and mention all the values in it.
2nd Step – Place formula of standard deviation below that is = Stdev (value)
3rd Step – Note down the answer after pressing enter key (Jaiswal and Das, 2018).
The statistics stated that mean value of speed of wind in Manchester is 20.1 Km/H. The
value of median is similar to mean that is 20 Km/H (Zgurovsky and Zaychenko, 2016). The
mode of data is 13 which is repeated twice. The range of data is 22 whereas standard deviation is
6.64 (Pole, West and Harrison, 2018).
4. Apply linear forecasting model.
Linear forecasting model -
Days (x) Date Speed of wind(km/h) XY X^2
1 05/10/19 13 Km/H 13 1
2 06/10/19 22 Km/H 44 4
3 07/10/19 13 Km/H 39 9
4 08/10/19 25 Km/H 100 16
3
Document Page
5 09/10/19 19 Km/h 95 25
6 10/10/19 23 Km/H 138 36
7 11/10/19 20 Km/H 140 49
8 12/10/19 34 Km/H 272 64
9 13/10/19 12 Km/H 108 81
10 14/10/19 20 Km/H 200 100
55 Total 201 1149 385
A) Steps for calculating m value
Particulars Details
m Nσxy-Σx Σy / NΣ x^2 - (Σx)^2
(10*1149)-(55*201) / (10*385)-(55)^2
(11490-11055)/(3850-3025)
0.52
B) Steps for calculating c value
Particulars Details
c Σy – m Σx / N
(201-(0.52*55))/10
17.24
C) Forecasting m and c value for day 14 and 21
Forecast for 14th day
Y = mX + C
4
Document Page
Y 0.52(X) + 17.24
X 14
Z 0.52 (14) + 17.24
24.52
Forecast for 21th day
Y = mX + C
Y 0.52(X) + 17.24
X 21
Z 0.52 (21) + 17.24
28.16
CONCLUSION
From the above study it is concluded that data analysis and numerical analysis are
important for analysing details as defined by the weather conditions' data of Manchester about
the flow of wind outside for concluding project report and analysing of data. The reflect of wind
speed is address along with avoiding arguments that are representation of tabular along with
visual format. Also it has provided dis respective statistics of data along with the application of
linear forecasting model on day 14th when the wind speed will be 14.52 Km/ Hr and as on 21st
wind speed will be respectively 28.16 Km/Hr.
REFERENCE
Books and Journals
Zhang, Y. and et.al., 2016. Topic analysis and forecasting for science, technology and
innovation: Methodology with a case study focusing on big data research. Technological
Forecasting and Social Change. 105. pp.179-191.
Pole, A., West, M. and Harrison, J., 2018. Applied Bayesian forecasting and time series analysis.
Chapman and Hall/CRC.
5
tabler-icon-diamond-filled.svg

Paraphrase This Document

Need a fresh take? Get an instant paraphrase of this document with our AI Paraphraser
Document Page
Wang, D. and Sun, Z., 2015. Big data analysis and parallel load forecasting of electric power
user side. Proceedings of the CSEE. 35(3). pp.527-537.
Shah, A.S.B.M., Yokoyama, H. and Kakimoto, N., 2015. High-precision forecasting model of
solar irradiance based on grid point value data analysis for an efficient photovoltaic
system. IEEE Transactions on Sustainable Energy. 6(2). pp.474-481.
Jaiswal, J.K. and Das, R., 2018. Artificial Neural Network Algorithms based Nonlinear Data
Analysis for Forecasting in the Finance Sector. International Journal of Engineering &
Technology. 7(4.10). pp.169-176.
Zgurovsky, M.Z. and Zaychenko, Y.P., 2016. Inductive Modeling Method (GMDH) in Problems
of Intellectual Data Analysis and Forecasting. In The Fundamentals of Computational
Intelligence: System Approach (pp. 221-260). Springer, Cham.
Ferlito, S., Adinolfi, G. and Graditi, G., 2017. Comparative analysis of data-driven methods
online and offline trained to the forecasting of grid-connected photovoltaic plant
production. Applied energy. 205. pp.116-129.
6
chevron_up_icon
1 out of 8
circle_padding
hide_on_mobile
zoom_out_icon
logo.png

Your All-in-One AI-Powered Toolkit for Academic Success.

Available 24*7 on WhatsApp / Email

[object Object]