Forensic Medicine Assignment Module 2: Mortality Statistics Analysis
VerifiedAdded on 2020/04/15
|7
|2184
|108
Report
AI Summary
This forensic medicine assignment analyzes mortality statistics across different age groups and races in the United States. The report begins with an introduction to epidemiological studies and then presents tabular data on the causes of death among 20-24 and 35-44 year olds, including accidents, intentional self-harm, assault, malignant neoplasms, and diseases of the heart. The assignment then discusses similarities and differences in the data, highlighting trends such as the increasing rates of unintentional harm, falls, and suicides, and the decline in motor vehicle accidents. The second task evaluates racial and ethnic differences in mortality rates, comparing the data for African Americans, Hispanics, Asian Americans, and Pacific Islanders. It examines reasons for the observed disparities and similarities, such as the impact of socioeconomic status, access to healthcare, and lifestyle factors on mortality rates. The report concludes by summarizing the key findings and emphasizing the variation in mortality across different ethnic groups.
Running head; Forensic task assignment
UNIVERSITY:
NAME :
STUDENT ID:
COURSE CODE
COURSE NAME
ASSIGNMENT
FORENSIC MEDICINE ASSIGNMENT MODULE 2
UNIVERSITY:
NAME :
STUDENT ID:
COURSE CODE
COURSE NAME
ASSIGNMENT
FORENSIC MEDICINE ASSIGNMENT MODULE 2
Paraphrase This Document
Need a fresh take? Get an instant paraphrase of this document with our AI Paraphraser
FORENSIC MEDICINE ASSIGNMENT MODULE 2
Task 1
Introduction
Epidemiological studies entail the study and distribution if health related determinants
and the implications it has on control of disease and other related health problems. In
epidemiology various methodological study designs are used to estimate this prevalence’s.
This task will assess the two different age groups that are cause of death among the 20-
24 year olds and the 35-44 year old deaths causes. This will generate an in-depth
understanding of the genesis of the difference in between the causes of deaths and the reasons
for the apparent deaths.
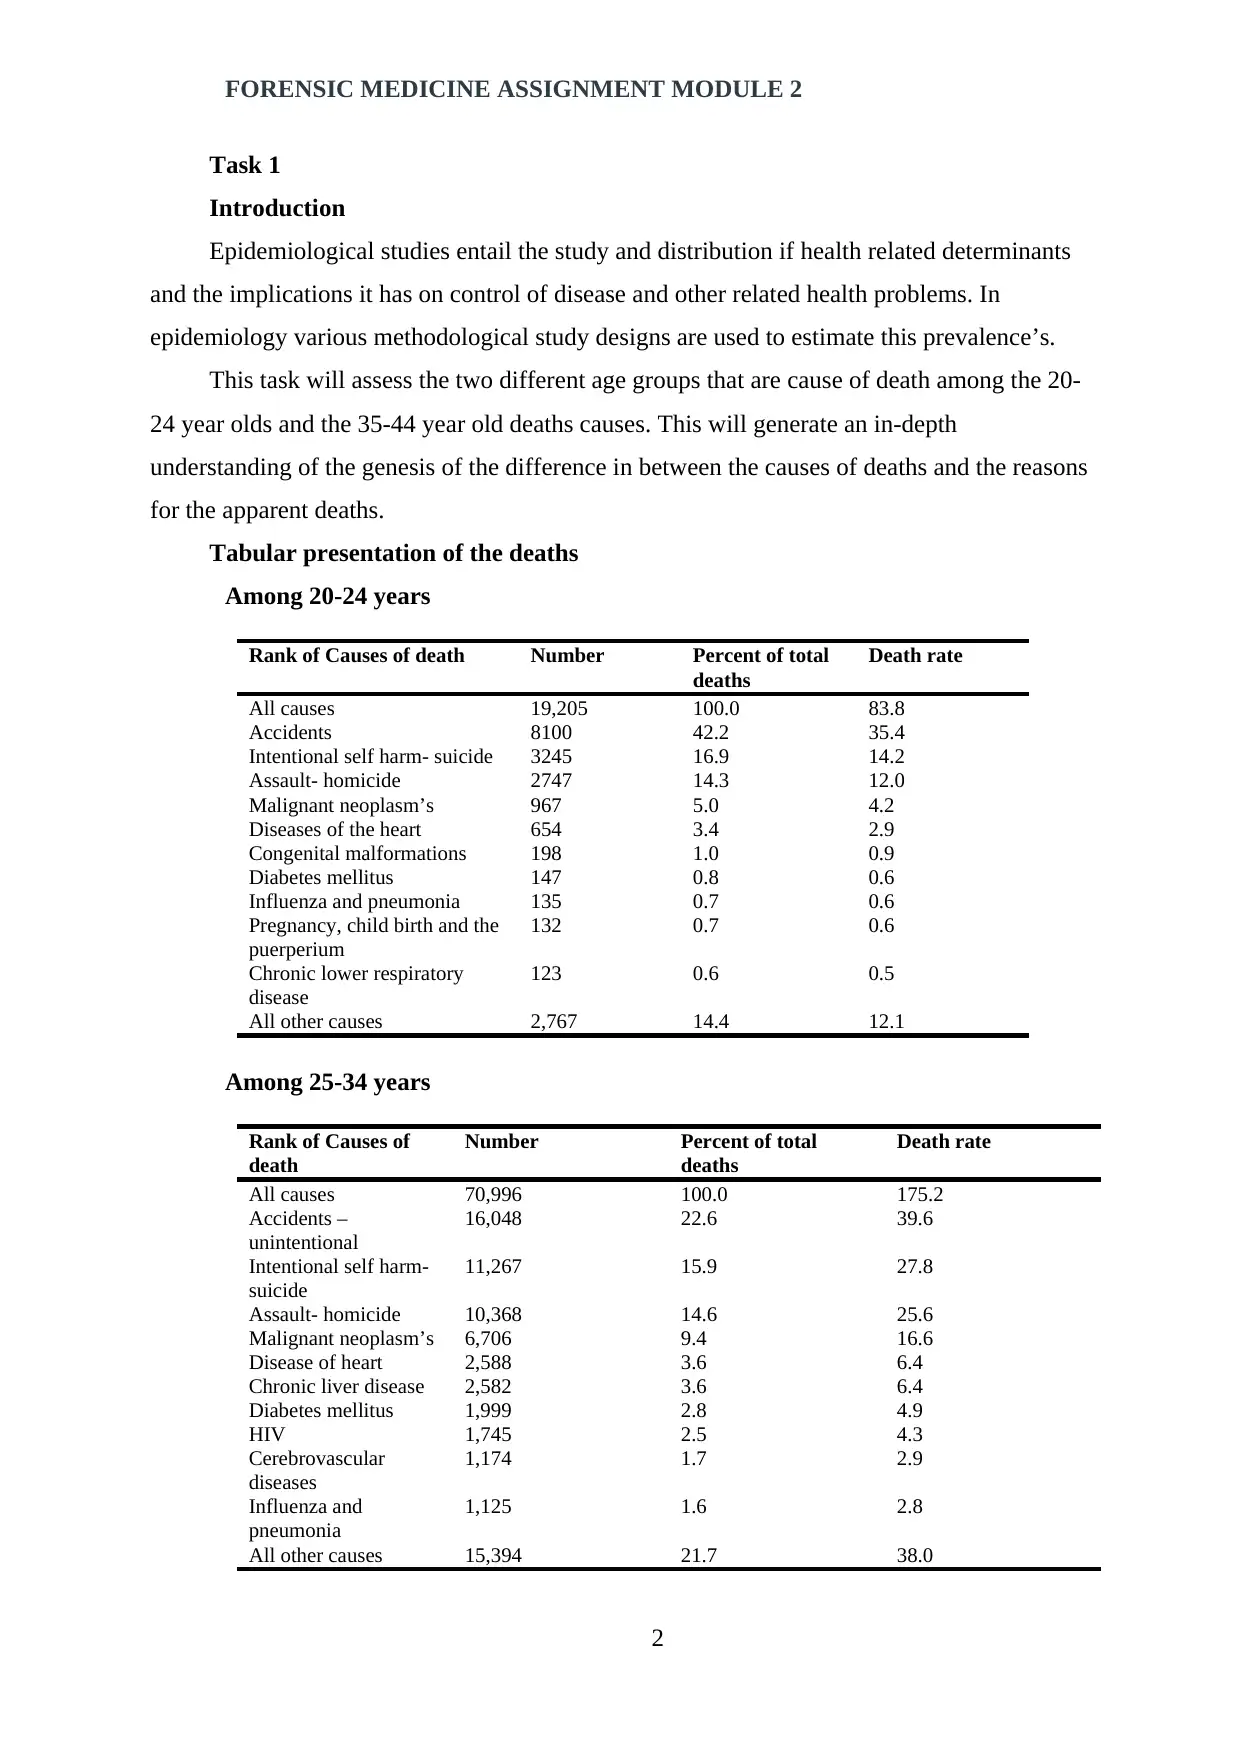
Tabular presentation of the deaths
Among 20-24 years
Rank of Causes of death Number Percent of total
deaths
Death rate
All causes 19,205 100.0 83.8
Accidents 8100 42.2 35.4
Intentional self harm- suicide 3245 16.9 14.2
Assault- homicide 2747 14.3 12.0
Malignant neoplasm’s 967 5.0 4.2
Diseases of the heart 654 3.4 2.9
Congenital malformations 198 1.0 0.9
Diabetes mellitus 147 0.8 0.6
Influenza and pneumonia 135 0.7 0.6
Pregnancy, child birth and the
puerperium
132 0.7 0.6
Chronic lower respiratory
disease
123 0.6 0.5
All other causes 2,767 14.4 12.1
Among 25-34 years
Rank of Causes of
death
Number Percent of total
deaths
Death rate
All causes 70,996 100.0 175.2
Accidents –
unintentional
16,048 22.6 39.6
Intentional self harm-
suicide
11,267 15.9 27.8
Assault- homicide 10,368 14.6 25.6
Malignant neoplasm’s 6,706 9.4 16.6
Disease of heart 2,588 3.6 6.4
Chronic liver disease 2,582 3.6 6.4
Diabetes mellitus 1,999 2.8 4.9
HIV 1,745 2.5 4.3
Cerebrovascular
diseases
1,174 1.7 2.9
Influenza and
pneumonia
1,125 1.6 2.8
All other causes 15,394 21.7 38.0
2
Task 1
Introduction
Epidemiological studies entail the study and distribution if health related determinants
and the implications it has on control of disease and other related health problems. In
epidemiology various methodological study designs are used to estimate this prevalence’s.
This task will assess the two different age groups that are cause of death among the 20-
24 year olds and the 35-44 year old deaths causes. This will generate an in-depth
understanding of the genesis of the difference in between the causes of deaths and the reasons
for the apparent deaths.
Tabular presentation of the deaths
Among 20-24 years
Rank of Causes of death Number Percent of total
deaths
Death rate
All causes 19,205 100.0 83.8
Accidents 8100 42.2 35.4
Intentional self harm- suicide 3245 16.9 14.2
Assault- homicide 2747 14.3 12.0
Malignant neoplasm’s 967 5.0 4.2
Diseases of the heart 654 3.4 2.9
Congenital malformations 198 1.0 0.9
Diabetes mellitus 147 0.8 0.6
Influenza and pneumonia 135 0.7 0.6
Pregnancy, child birth and the
puerperium
132 0.7 0.6
Chronic lower respiratory
disease
123 0.6 0.5
All other causes 2,767 14.4 12.1
Among 25-34 years
Rank of Causes of
death
Number Percent of total
deaths
Death rate
All causes 70,996 100.0 175.2
Accidents –
unintentional
16,048 22.6 39.6
Intentional self harm-
suicide
11,267 15.9 27.8
Assault- homicide 10,368 14.6 25.6
Malignant neoplasm’s 6,706 9.4 16.6
Disease of heart 2,588 3.6 6.4
Chronic liver disease 2,582 3.6 6.4
Diabetes mellitus 1,999 2.8 4.9
HIV 1,745 2.5 4.3
Cerebrovascular
diseases
1,174 1.7 2.9
Influenza and
pneumonia
1,125 1.6 2.8
All other causes 15,394 21.7 38.0
2
FORENSIC MEDICINE ASSIGNMENT MODULE 2
Discussion on the data, similarities and differences
It is evident that the data presented have shown a statistical trend in dissimilarities. The
common top five causes of death among the two age groups are observable. The cause of
death among the group is similar in between the groups. The top five causes of death include
intentional self harm, assault and suicide, malignant neoplasms and diseases of the heart.
These diseases are common for the younger generation and it is seen to be transmitted to the
middle young generation of the age bracket of 25-35 years.
Observable difference among the data is the lower bottom five differences that have
shown dissimilarity. Among the younger age group of 20-24 years, congenital;
malformations takes centre stage with a death rate of 0.8. This is followed by diabetes
mellitus with a death rate of 0.6, both which are similar to influenza and pneumonia,
pregnancy child birth and puerperium and chronic lower respiratory diseases.
Among the 25-34 years old, chronic liver diseases take centre stage has a death rate of
1.7, while HIV has 1.3 death rates. There are similarities among HIV , cerebrovasuclar
diseases, influenza & pneumonia with a death rate of 1.3.
Reasons for similarities and differences
The mortality statistics of unintentional harm, falls and suicidal case have increased in
the past decade, with statistics showing that poisoning has gone up by 128%, while falls
death increased to 71% while suicide case increased by 15%.
Motor vehicle accidents have shown to declined in the past few years by 25%. However
when ranked, suicide comes first, followed by motor vehicle traffic accidents, poisoning,
accidental falls and finally homicides cases. While comparing the gender statistics it shows
that female experience lower injury mortality than the male counterparts, (Peden et al., 2012).
The increasing trends of intentional and intentional deaths have been shown to have
spillover effect to the older generation. The characteristics of deaths and injuries occurring in
the age bracket of 20-24 years have shown to spill over to the age bracket of 35-44 years as
observed from the similarity in the trends shown.
In both age groups it is evidence that mortality rates for the suicidal actions, poisoning
and falls have increased substantially. Thus, affecting directly the population in both gender
groups. When compared interdependently, it is noted that suicide has surpassed the motor
vehicle accidents. Comprehensive traffic rules initiated have had a major impact in the
reduction of traffic accidents mortality deaths.
Homicidal cases have shown that there is similarity on age, gender and race. There is
variation among the Hispanics and the whites. Hispanics and black males have indicated an
3
⊘ This is a preview!⊘
Do you want full access?
Subscribe today to unlock all pages.
Trusted by 1+ million students worldwide
FORENSIC MEDICINE ASSIGNMENT MODULE 2
increased in the relative risks which increases with age, (MacAnininch et al., 2014).
Thus the injury mortality trend among the younger generation has shift upwards in the
last decade. In this category there is increased rise in the rates associated with poisoning, falls
and suicidal. The reason for this is the reduced sustainable safety measures which have
significantly reduces over the past decade thus exacerbating the increasing trends in both
groups, (WHO, 2011).
Task 2
Introduction
This task seeks to evaluate the statistical evidence regarding racial and ethnic
differences in mortality deaths in United States among two specific age group brackets that is
20-24 and 35-44 years of age. The statistical information replicated here is similar to the
above on the causes of death; however narrow of focus will be the all races.
The major groups that comprise the American population included in the statistical
report include the African Americans, Hispanic, Asian Americans, and Pacific Islanders
among other minority small groups.
Differences among and in between the races
The mortality rates for the whites and the African Americans shows that the vital
statistics and the census, indicate that the Black Death rates often are more prevalent than the
white rates. There has been stiff competition on how the racial characteristics behave in terms
of the vital characteristics.
At younger ages the age specific death rates for the African American mix, have shown
that the mortality rates exceeds the white rates in a ratio of 2:1 and there is gradual steady
rise of narrowing of the age bracket. Currently, white mortality rates have been
characteristically disadvantages the blacks in the middle ages which this trend has followed
the relative increase in death rates compared to the white rates, (Kochanek, Arais &
Anderson,2013).
This crossover effect has been attributed to the fact that survival for the fittest has taken
centre stage. This indicates that the African American at younger ages have on adverse
conditions faced various subjects to weakest members to high mortality incidences.
Data suggest that individual races which have experienced the crossover effect have
experienced unfavourable conditions in the early life tend to have experienced in elevated
mortality later as years goes by, (Turra & Elo, 2008).
Reasons for the differences
4
Paraphrase This Document
Need a fresh take? Get an instant paraphrase of this document with our AI Paraphraser
FORENSIC MEDICINE ASSIGNMENT MODULE 2
On a racial platform, black Americans have been observed as having the highest death
rates among any of the Americas racial and ethnographic representation. In a wider part, this
has been linked to the fact that inequalities and economic status, education and further their
occupational jobs, which is linked to risks of mortality death rates.
The racial differences with respect to mortality often persist in studies where those aged
between 20-24 and 35-44 can be compared among individual’s similar levels of income and
security status. The blacks often have the disadvantage in that often the black race appears in
all the major cases of death, which include those of heart diseases, cancer and stroke related
deaths. However the disadvantage is that greatest death especially among the 35-44 is the
HIV infection which is often at risks for the blacks at over estimate over seven times the risks
associated with the white Americans.
The death rates associated with American Indians are showing similar trends for the
most cases; however they are substantially higher for the cirrhosis of the liver and for both
intentional injuries like suicide and homicide cases. The Asian and pacific islanders and
Hispanics by difference often show lower rates of mortality than the expected in the social
economic status as seen in the united states, (Wallace & Kulu, 2015).
Similarities
However, the death rates across the racial parameters have declined among the
Hispanic, black and Asians/ pacific islanders among the American population. This is in line
with the trends with other countries such as the Canada and UK. A comprehensive study
undertaken shows that there is increase emergences of American Indians in United States.
The declining rates of disease occurrences have been attributed to the fact that deaths in
the age bracket of 35-44 years among the blocks, Hispanics and Asian pacific islanders were
few in terms diseases such as heart diseases, HIV and Cancer however not included in the
overall CDC list, (Botmann et al., 2004).
This decline can be attributed to the fact that there has been a lot of effort among the
public officers in an effort to reduce tobacco smoking and increase on the use of advance
medical facilities. Also the whites experienced fewer deaths in terms of heart related diseases.
However despite these tremendous efforts, there has been slow decline in terms of rates
among the black men and the whites women.
However, the overall mortality rates among the whites and the islanders pacific have
been increased in the form of accidental deaths such as those of drug overdoses, suicidal
attempts and liver associated diseases. In the age bracket of 20-24 years, the whites and
islander pacific have experienced and observed an increased death rate which is higher that 2-
5
FORENSIC MEDICINE ASSIGNMENT MODULE 2
5 % which is compared to other observed racial groupings of other US population, (Borell &
Crawford, 2008).
Conclusion
To conclude is that, there is wide variation of ethnic status with regard to ethnic
mortality death as per the statistics of CDC. The ethnography of the individual indicates
whether they are more prone to mortality to any allied cause of death. There is great variation
in terms of death mortality among the different groups in the study findings. However there
are other causes of mortality which cuts across the different racial group in USA population.
6
⊘ This is a preview!⊘
Do you want full access?
Subscribe today to unlock all pages.
Trusted by 1+ million students worldwide
FORENSIC MEDICINE ASSIGNMENT MODULE 2
References
Bacong, A. M., Holub, C., & Porotesano, L. (2016). Comparing Obesity-Related Health
Disparities among Native Hawaiians/Pacific Islanders, Asians, and Whites in
California: Reinforcing the Need for Data Disaggregation and Operationalization.
Hawai'i Journal of Medicine & Public Health, 75(11), 337.
Botman, S., & Moriarity, C. L. (2000). Design and estimation for the national health
interview survey, 1995-2004.
Creanga, A. A., Berg, C. J., Syverson, C., Seed, K., Bruce, F. C., & Callaghan, W. M. (2015).
Pregnancy-related mortality in the United States, 2006–2010. Obstetrics & Gynecology,
125(1), 5-12..
Kochanek, K. D., Arias, E., & Anderson, R. N. (2013). How did cause of death contribute to
racial differences in life expectancy in the United States in 2010?.
McAninch, J., Greene, C., Sorkin, J. D., Lavoie, M. C., & Smith, G. S. (2014). Higher
psychological distress is associated with unintentional injuries in US adults. Injury
prevention, 20(4), 258-265.
Peden M, McGee K, Sharma G. The Injury Chartbook: A Graphical Overview of the Global
Burden of Injuries. World Health Organization; 2002. Available at:
http://whqlibdoc.who.int/publications/924156220X.pdf.
Turra, C. M., & Elo, I. T. (2008). The impact of salmon bias on the Hispanic mortality
advantage: New evidence from social security data. Population research and policy
review, 27(5), 515.
Wallace, M., & Kulu, H. (2015). Mortality among immigrants in England and Wales by
major causes of death, 1971–2012: a longitudinal analysis of register-based data. Social
Science & Medicine, 147, 209-221.
World Health Organization. Injuries, & Violence Prevention Department. (2002). The injury
chart book: A graphical overview of the global burden of injuries. World Health
Organization.
7
1 out of 7

Your All-in-One AI-Powered Toolkit for Academic Success.
+13062052269
info@desklib.com
Available 24*7 on WhatsApp / Email
![[object Object]](/_next/static/media/star-bottom.7253800d.svg)
Unlock your academic potential
Copyright © 2020–2026 A2Z Services. All Rights Reserved. Developed and managed by ZUCOL.