Financial Performance Analysis: Fortescue Metals Group Limited Report

Verified

Added on  2021/06/15

|16
|1088
|99
Report
AI Summary
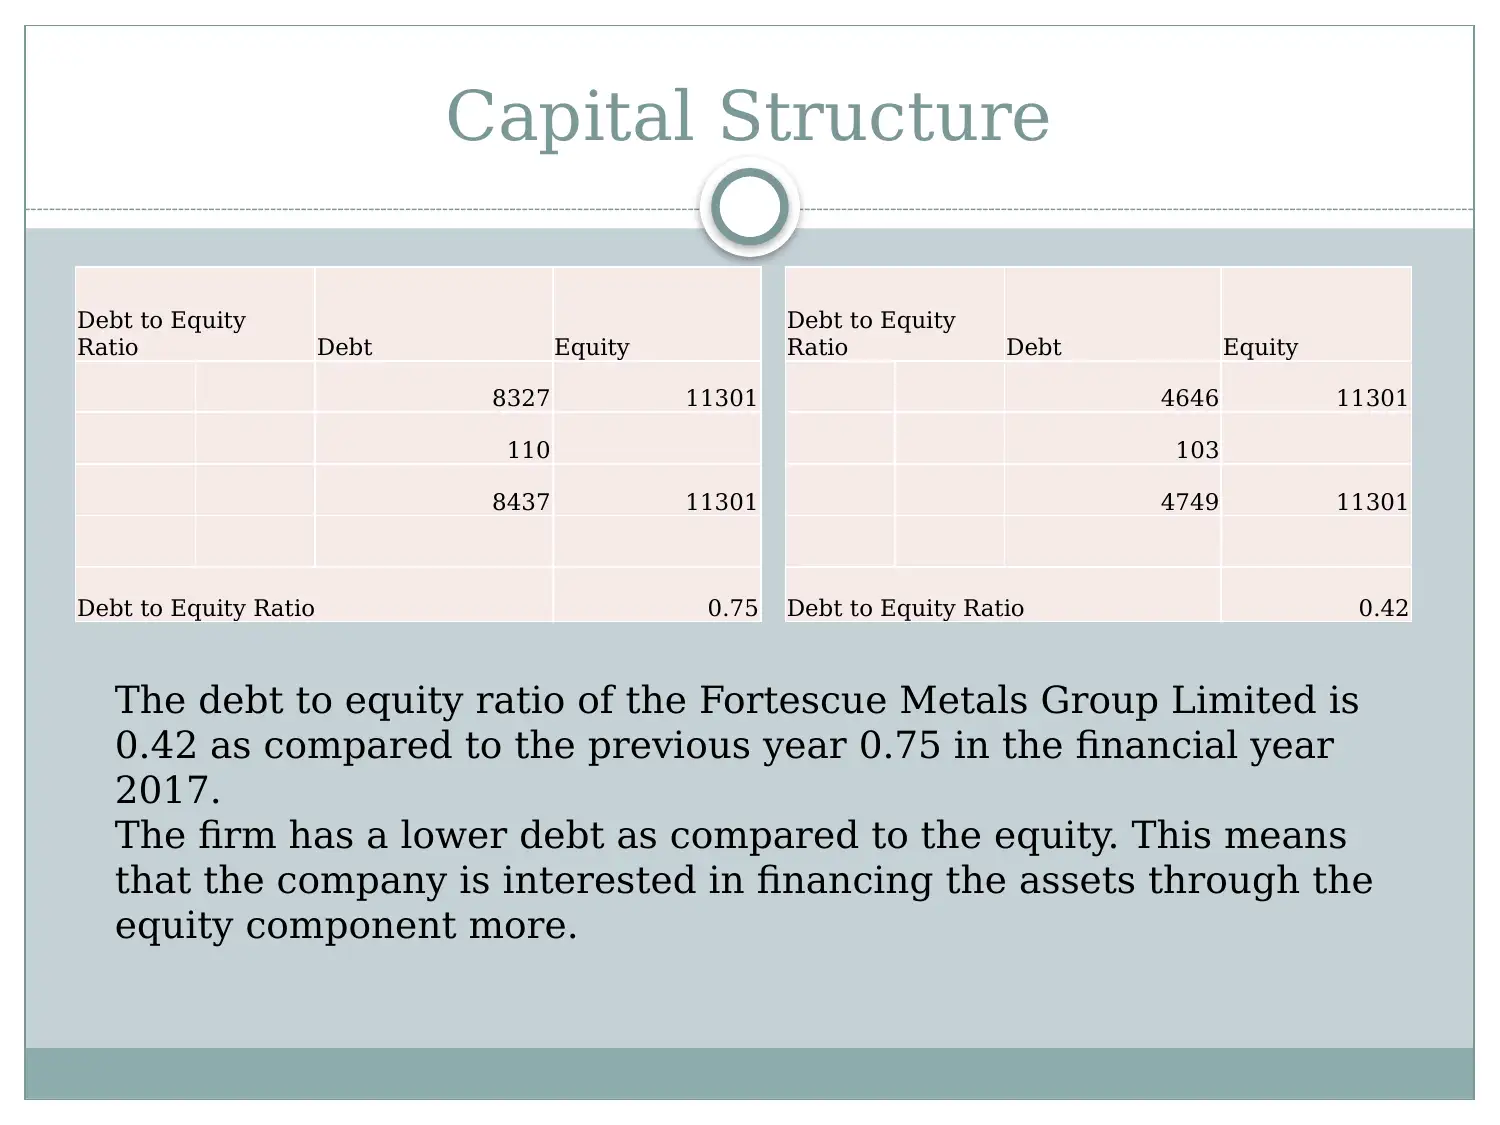
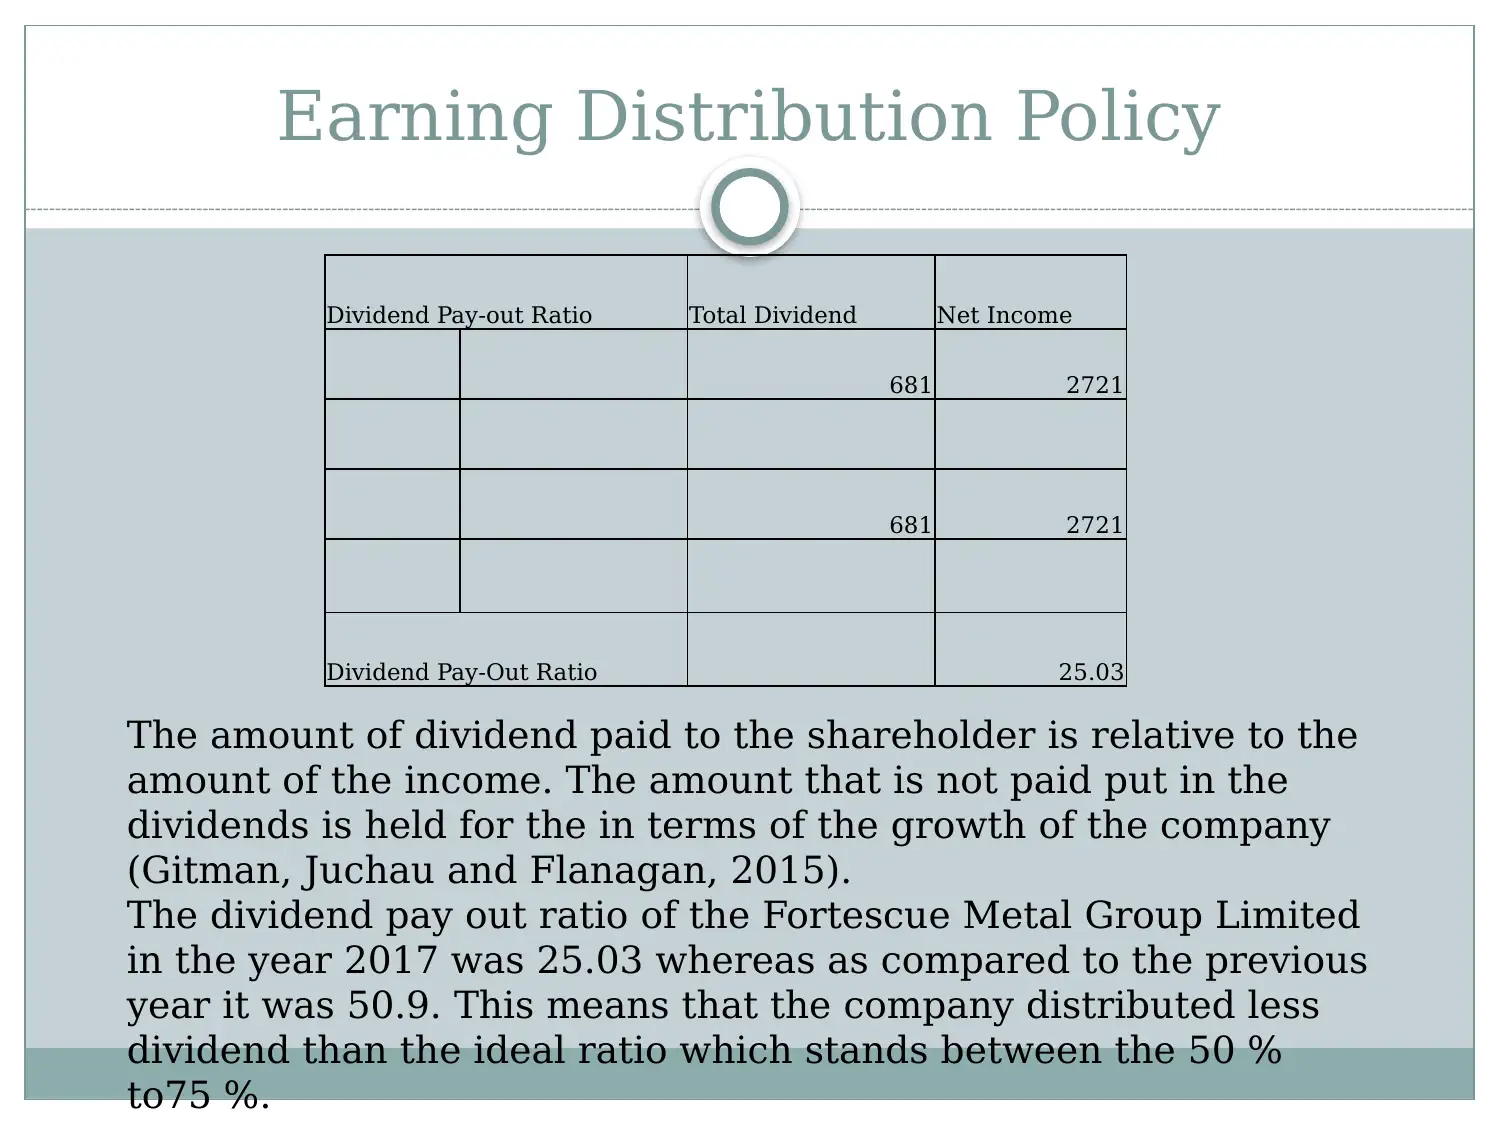
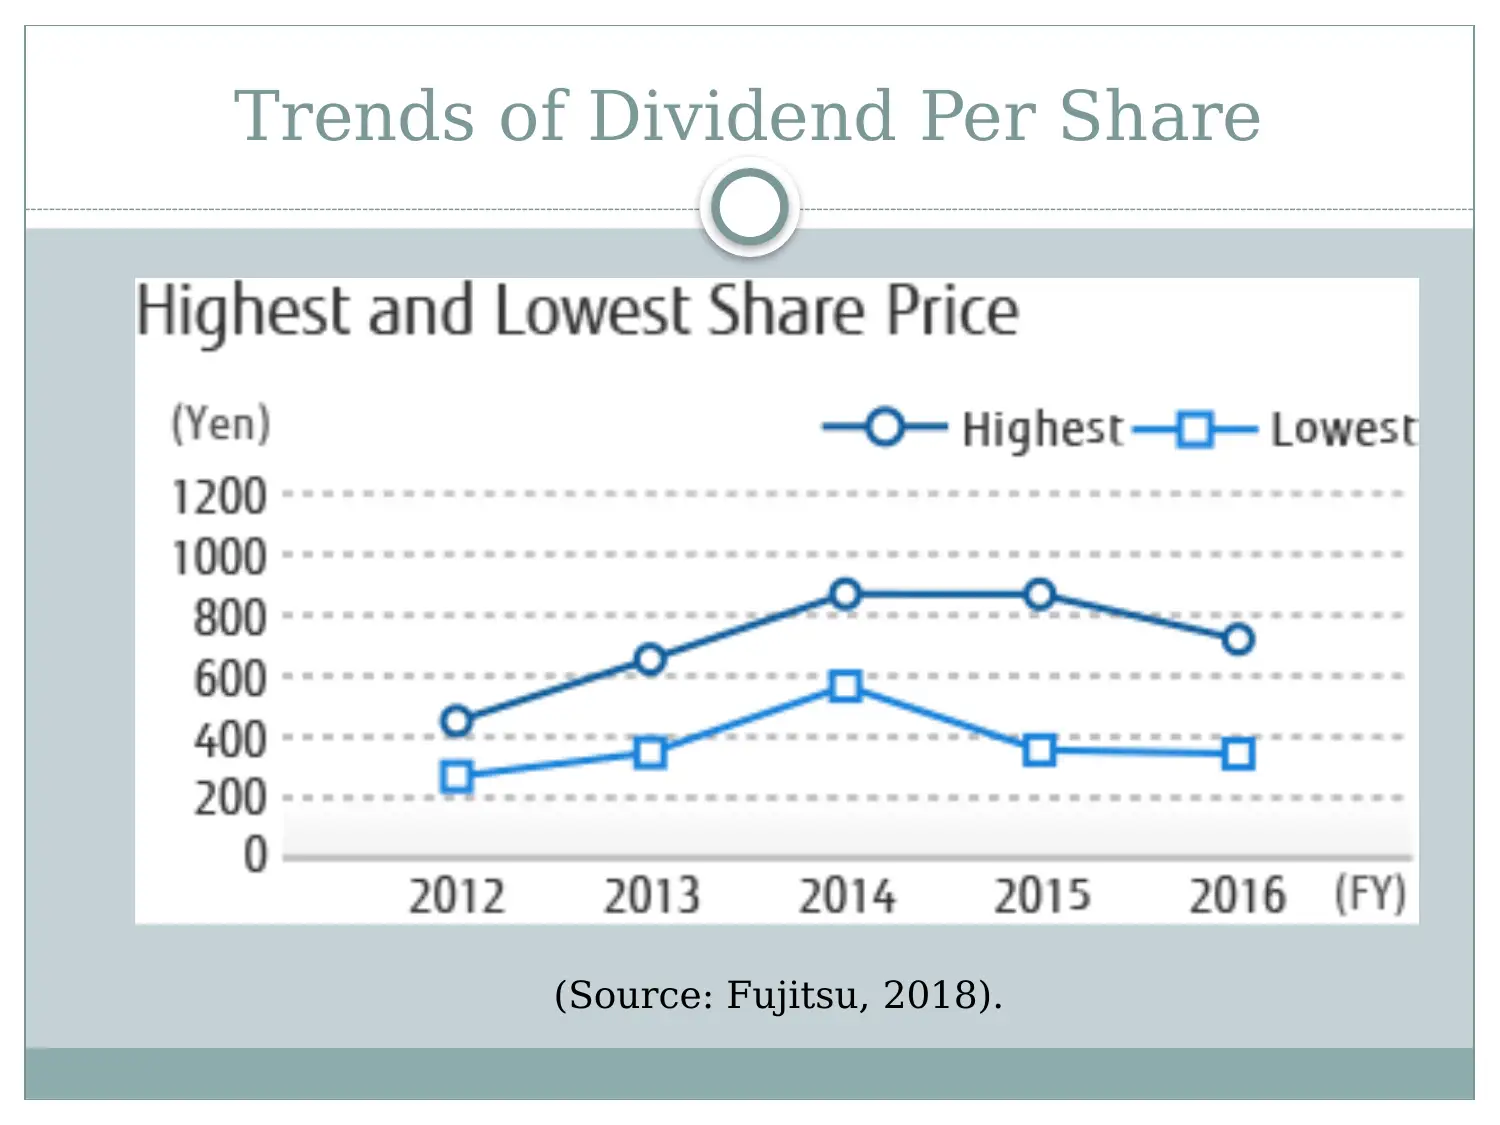
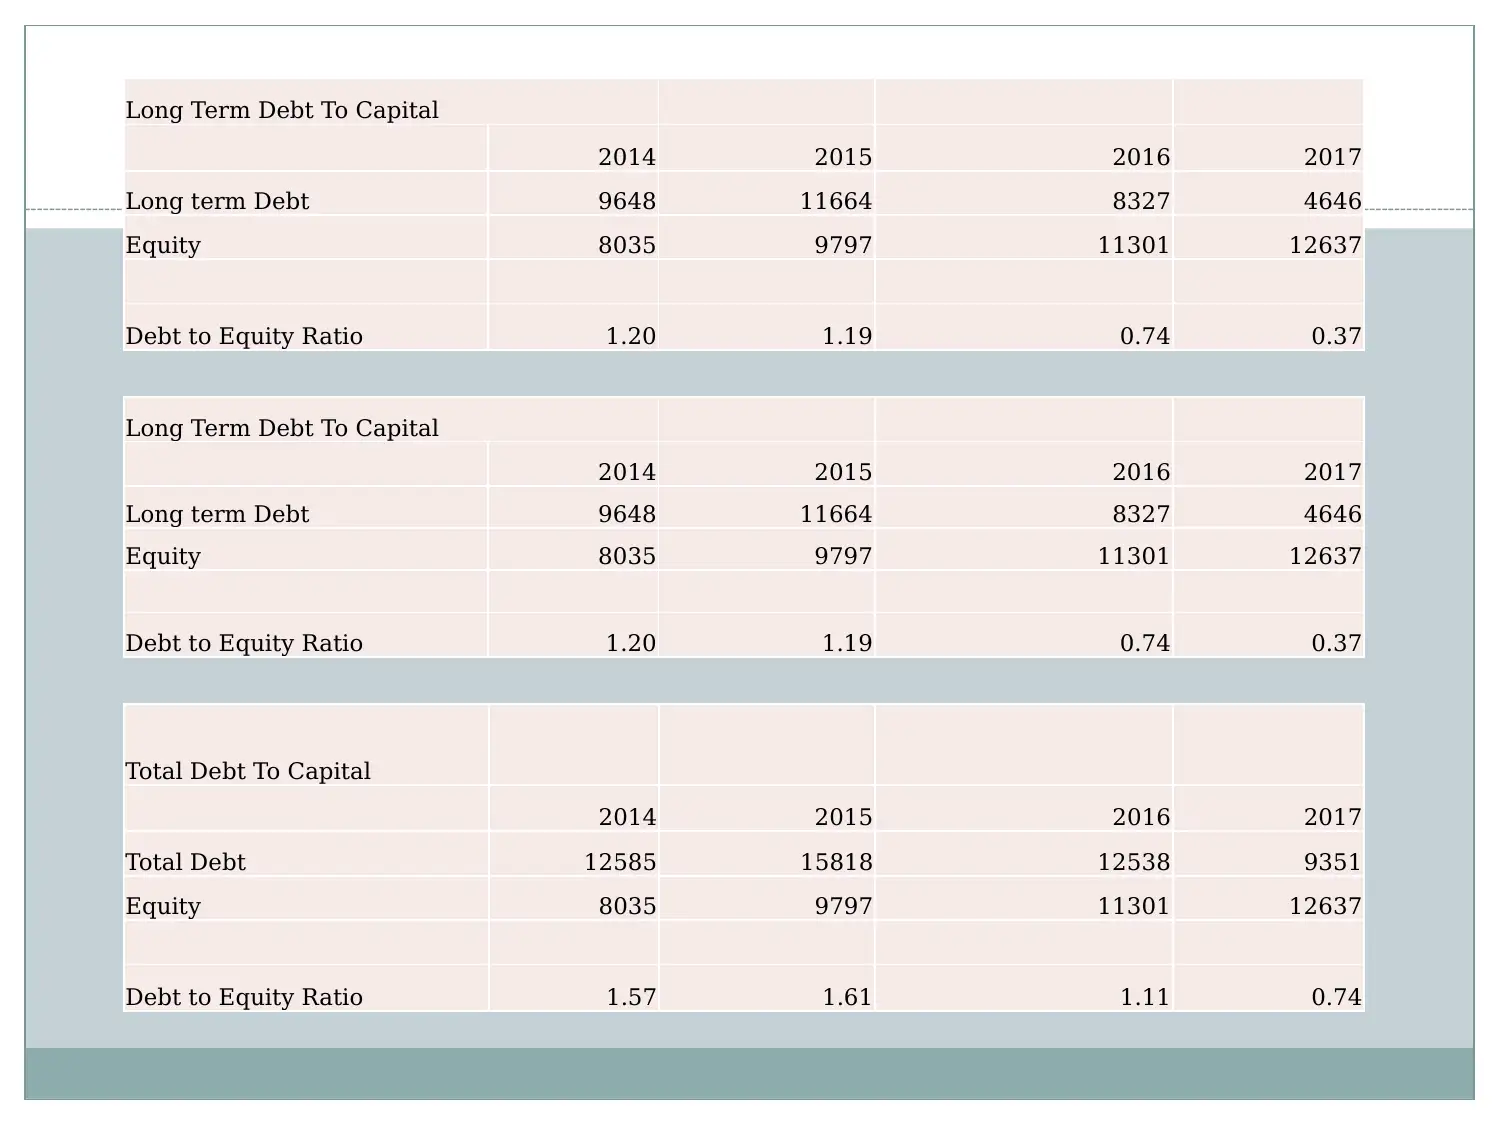
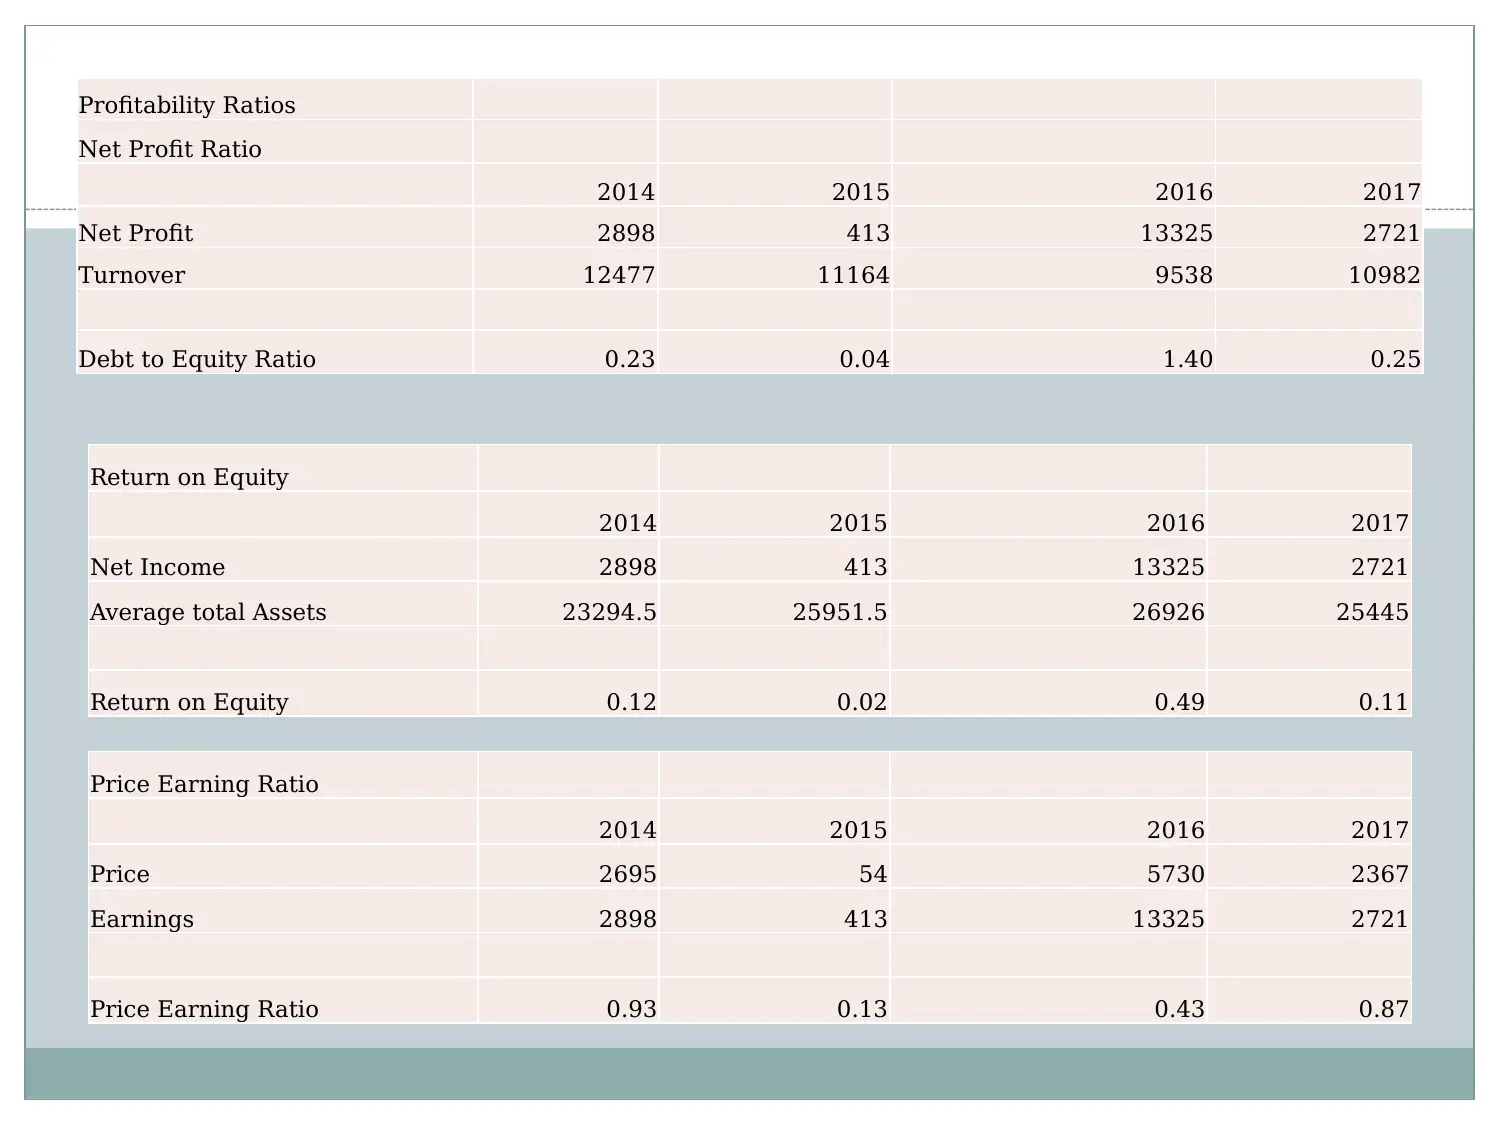
This report provides a financial analysis of Fortescue Metals Group Limited, examining its capital structure, working capital management, and dividend policies. The report details the company's debt-to-equity ratio, highlighting its preference for financing through equity. It discusses the company's relaxed approach to working capital management, emphasizing the importance of maintaining sufficient liquid assets. Furthermore, the report analyzes the company's dividend imputation tax system and its dividend payout ratio, noting trends in dividend per share and the implementation of a dividend reinvestment plan. The analysis also touches upon the impact of financial policies on market share and share price, providing an overview of the company's financial strategy and its implications.
Document Page
B A C K G R O U N D A N A LY T I C A L R E P O R T
Fortescue Metals Group
Limited
tabler-icon-diamond-filled.svg

Paraphrase This Document

Need a fresh take? Get an instant paraphrase of this document with our AI Paraphraser
Document Page
An Overview
The fourth largest iron ore producer and an Australian based
company, Forstecue Metals Group Limited founded in 2003, has
holdings of roundabout 87000km^2 in the Western region of
Australia often known as Pilbara.
The holding of the company is larger than its competitors BHP
Billiton and Rio Tinto.
The group has two main areas of operation which are the
Chichester Hub and Solomon Hub (Billett, Hribar and Liu, 2015).
The net revenue of the company as of now is US$8.547 billion.
Document Page
Determination of Costs
 Fortescue’s combination of costs involve
weightage of Equity at 36% and weightage of
debt component at 64%.
ï‚—To find out the optimal capital structure of
the company the calculation of WACC is done
under which the costs are proportionately
weighted.
ï‚—Fortescue Metals Group has reduced its total
debt levels from US$6.77B to US$4.47B,
which is a combination of both the short term
as well as long term.
Document Page
Capital Structure
Debt to Equity
Ratio Debt Equity
8327 11301
110
8437 11301
Debt to Equity Ratio 0.75
The debt to equity ratio of the Fortescue Metals Group Limited is
0.42 as compared to the previous year 0.75 in the financial year
2017.
The firm has a lower debt as compared to the equity. This means
that the company is interested in financing the assets through the
equity component more.
Debt to Equity
Ratio Debt Equity
4646 11301
103
4749 11301
Debt to Equity Ratio 0.42
tabler-icon-diamond-filled.svg

Paraphrase This Document

Need a fresh take? Get an instant paraphrase of this document with our AI Paraphraser
Document Page
Nature of Policies
ï‚—Working capital management refers to a
strategy adopted by the management to
monitor the two major components of the
capital that is current assets and the current
liabilities (Daraban, 2017).
ï‚—The analysis of the working capital is done to
evaluate the financial efficiency of the
company.
ï‚—The primary objective is to make sure the
organisation is having sufficient cash to meet
its obligations and debt.
Document Page
Current Asset Investment Policies
ï‚—Though majorly the performance of the
company is dependent on the assets and the
profit margin of the business the liquidity of
the company will be hampered if the assets
are not convertible into cash.
ï‚—There are three policies in general
Relaxed
Moderate
Restricted
Document Page
Policy adopted by Fortescue Metals
ï‚—The policy adopted by the Fortescue Metals group is
that of the relaxed nature for their working capital
current level of investment.
ï‚—Under this strategy, Fortescue limited made a choice
to keep the current assets which are convertible into
the liquid assets and operational reasons.
ï‚—This strategy can be achieved by keeping an ample
amount of cash, marketable securities and ahigh
proportion of inventories.
ï‚—Implementing a liberal policy results in large
accounts receivable (Yarram and Dollery, 2015).
tabler-icon-diamond-filled.svg

Paraphrase This Document

Need a fresh take? Get an instant paraphrase of this document with our AI Paraphraser
Document Page
Nature of the firm’s Earning
ï‚—Dividend Imputation Tax system in Australia is established
where the some of the tax paid by the company may be
allocated or imputed to the shareholders .
ï‚—This system is existing since 1987 and divided under the
broad categories of franking credits or imputed tax
credits (Magni, 2016).
ï‚—The shareholders are given the tax credit to reduce the
income tax payable on the distribution.
ï‚—The system of imputation effectively taxes the profits of
the company at the average rates of tax.
ï‚—In 2012 FMG has distributed a fully paid franked dividend
$0.08 per share.
Document Page
Earning Distribution Policy
Dividend Pay-out Ratio Total Dividend Net Income
681 2721
681 2721
Dividend Pay-Out Ratio 25.03
The amount of dividend paid to the shareholder is relative to the
amount of the income. The amount that is not paid put in the
dividends is held for the in terms of the growth of the company
(Gitman, Juchau and Flanagan, 2015).
The dividend pay out ratio of the Fortescue Metal Group Limited
in the year 2017 was 25.03 whereas as compared to the previous
year it was 50.9. This means that the company distributed less
dividend than the ideal ratio which stands between the 50 %
to75 %.
Document Page
Trends of Dividend Per Share
(Source: Fujitsu, 2018).
tabler-icon-diamond-filled.svg

Paraphrase This Document

Need a fresh take? Get an instant paraphrase of this document with our AI Paraphraser
Document Page
Long Term Debt To Capital
2014 2015 2016 2017
Long term Debt 9648 11664 8327 4646
Equity 8035 9797 11301 12637
Debt to Equity Ratio 1.20 1.19 0.74 0.37
Long Term Debt To Capital
2014 2015 2016 2017
Long term Debt 9648 11664 8327 4646
Equity 8035 9797 11301 12637
Debt to Equity Ratio 1.20 1.19 0.74 0.37
Total Debt To Capital
2014 2015 2016 2017
Total Debt 12585 15818 12538 9351
Equity 8035 9797 11301 12637
Debt to Equity Ratio 1.57 1.61 1.11 0.74
Document Page
Profitability Ratios
Net Profit Ratio
2014 2015 2016 2017
Net Profit 2898 413 13325 2721
Turnover 12477 11164 9538 10982
Debt to Equity Ratio 0.23 0.04 1.40 0.25
Return on Equity
2014 2015 2016 2017
Net Income 2898 413 13325 2721
Average total Assets 23294.5 25951.5 26926 25445
Return on Equity 0.12 0.02 0.49 0.11
Price Earning Ratio
2014 2015 2016 2017
Price 2695 54 5730 2367
Earnings 2898 413 13325 2721
Price Earning Ratio 0.93 0.13 0.43 0.87
chevron_up_icon
1 out of 16
circle_padding
hide_on_mobile
zoom_out_icon
[object Object]