Financial Analysis Report: Performance of Fortescue Metals Group (FMG)

Verified

Added on  2022/08/13

|10
|1397
|15
Report
AI Summary
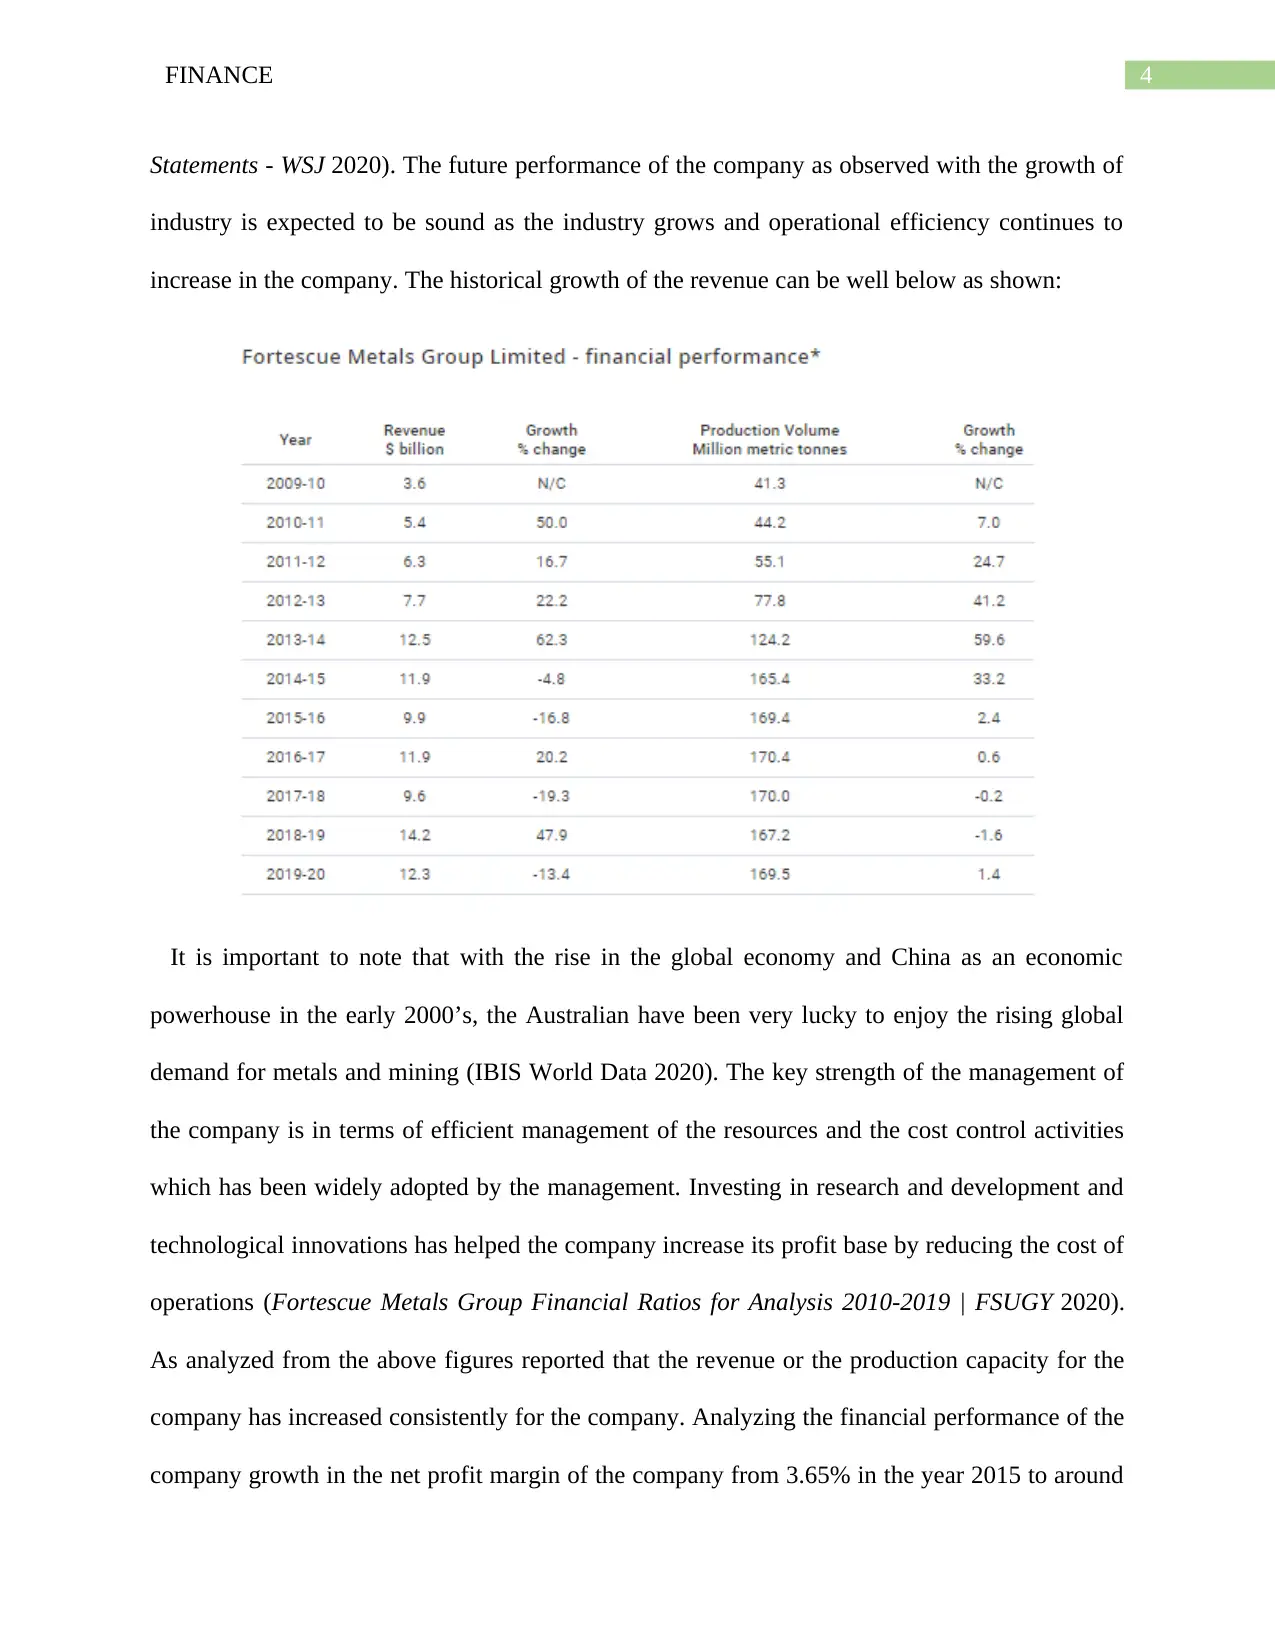
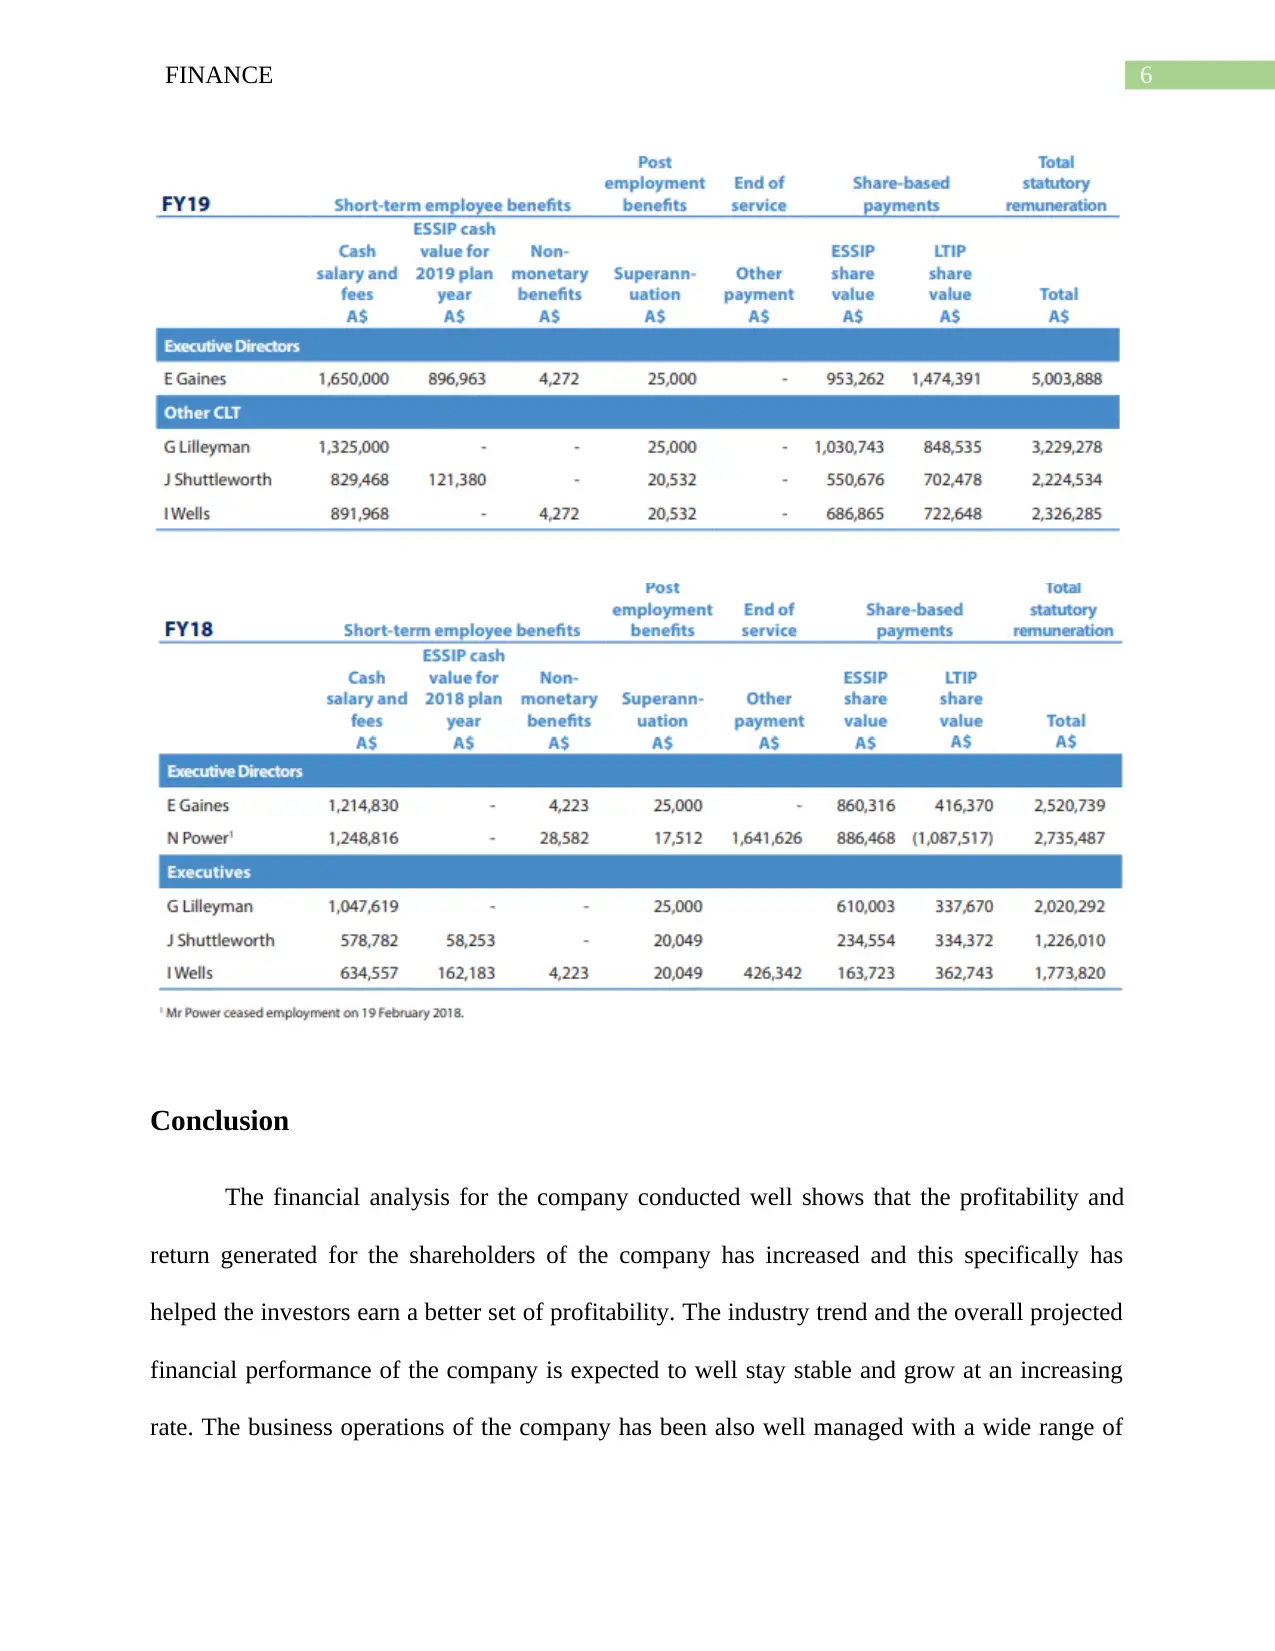
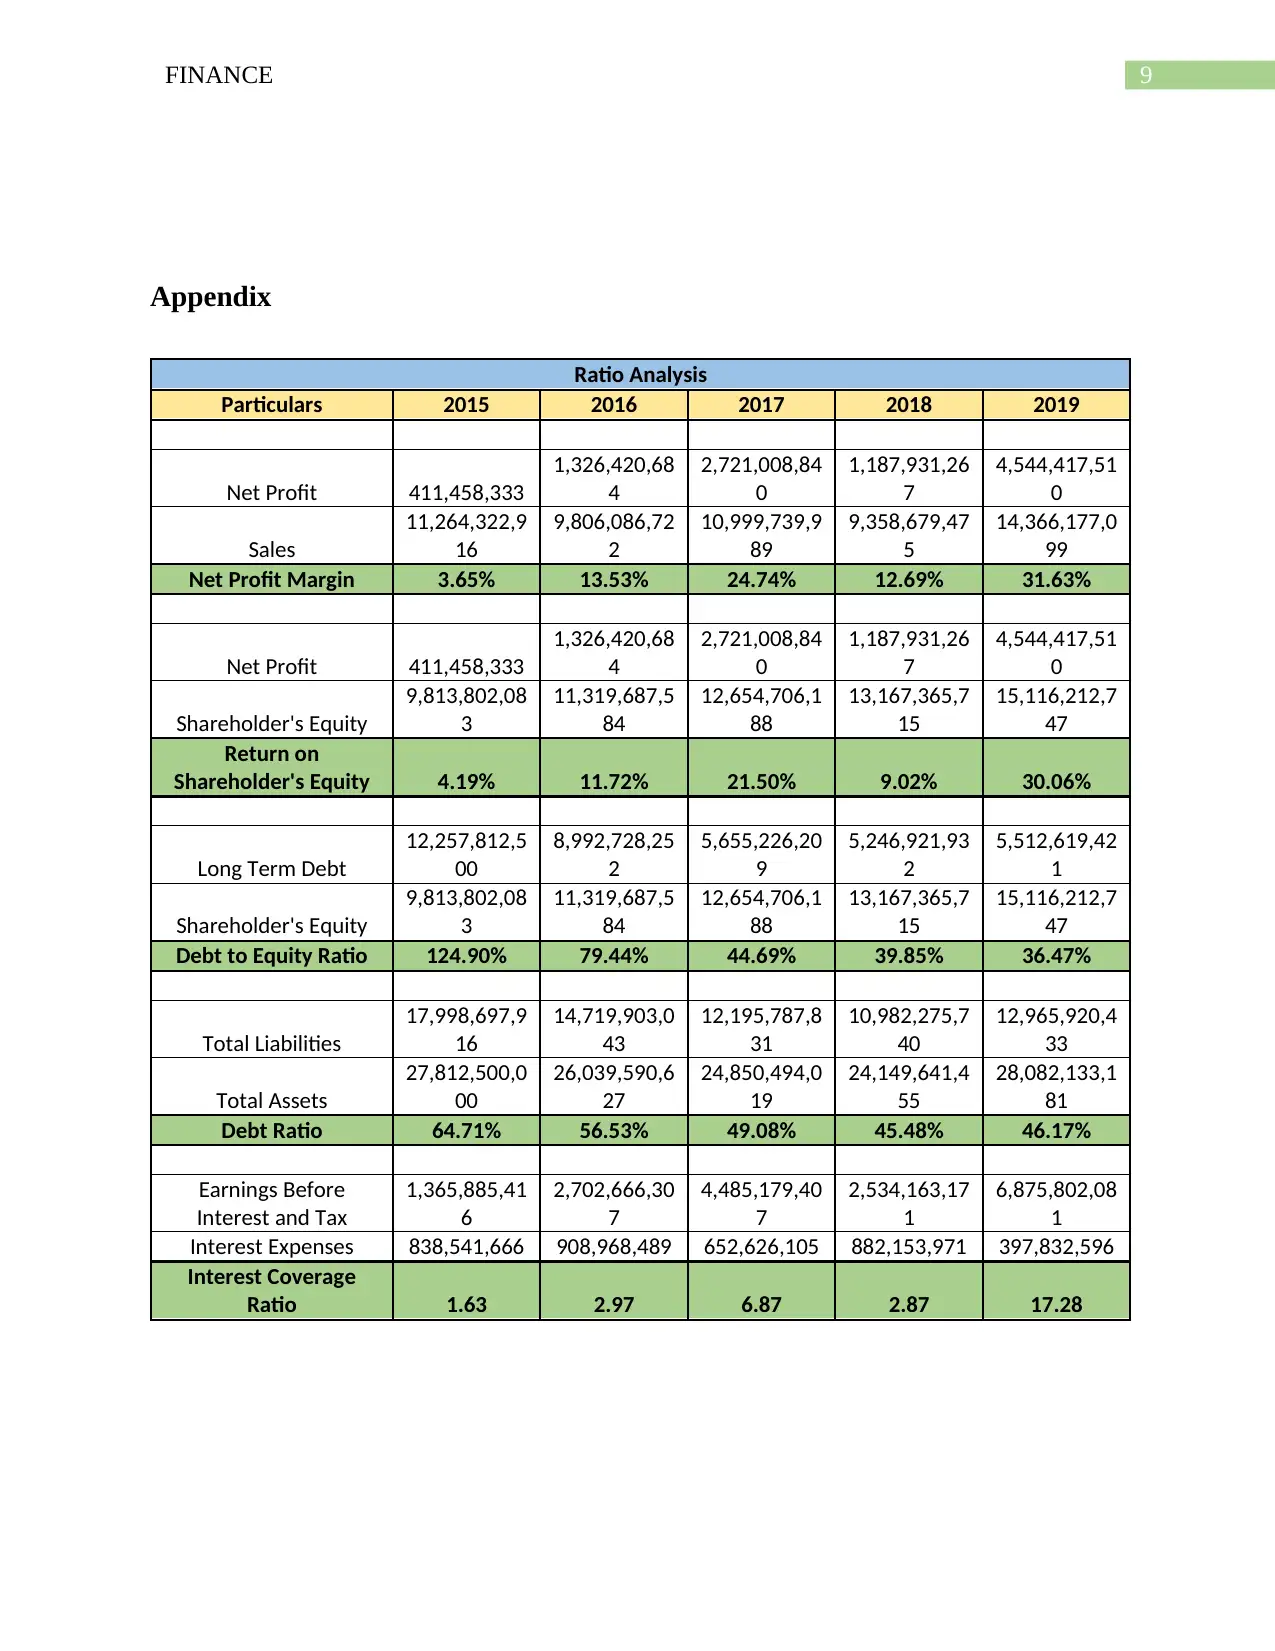
This financial analysis report focuses on Fortescue Metals Group (FMG), an Australian iron ore company, evaluating its performance over a five-year period. The analysis includes an examination of the company's operational and business performance, specifically focusing on key financial ratios such as net profit margin, return on shareholder's equity, and debt-to-equity ratio. The report interprets the company's financial statements, considering factors like Australia's role in the global metals and mining industry, particularly its relationship with China. It also analyzes the remuneration trends of key executives. The conclusion highlights the increasing profitability and shareholder returns, the stable industry trends, and the effective management of business operations including financial risk mitigation.
Document Page
Running head: FINANCIAL AND ECONOMIC INTERPRETATION
Finance
Name of the Student:
Name of the University:
Author’s Note:
tabler-icon-diamond-filled.svg

Paraphrase This Document

Need a fresh take? Get an instant paraphrase of this document with our AI Paraphraser
Document Page
1FINANCE
Table of Contents
Executive Summary.........................................................................................................................2
Analysis...........................................................................................................................................3
Interpretation....................................................................................................................................3
Conclusion.......................................................................................................................................6
References........................................................................................................................................7
Appendix..........................................................................................................................................8
Document Page
2FINANCE
Executive Summary
The financial analysis for the Fortescue Metal Group (FMG) whereby analysis of the company
has been done based on the business performance of the company. The financial performance of
the company has been well analysed for a sum of last five years whereby relevant changes in the
financials of the company has been well taken into consideration. The analysed company FMG
operates as an Australian Iron Ore Company, whereby the company is regarded as the fourth
largest iron ore producer in the world. For analysis purpose Leverage and coverage of earnings
with respect to the interest amount has also been well calculated for the company for the trend
period analysed. Business and Operational Analysis has also been done for the company by
reporting the various changes that has been reported for the company.
Document Page
3FINANCE
Analysis
The FMG Company operates as an Iron Ore Company whereby it operates in the Metals
and Mining Industry, the company has been continuing its operations since the year 2003 and is
headquartered in the Perth, Western Australia. The operations and the area that the company
serves is on a worldwide basis. The key products in which the company deals with is specifically
Iron Ore, Steel, Gold, Copper and Lithium. The financial performance of the company has
increased consistently for the company and this has been specifically due to the increasing profit
margins of the company and decreasing cost of operations which have helped the company
report increasing trend of profitability for the five-year trend period (Annual Report 2019).
Interpretation
Australia is considered as the world’s largest exporter of coal accounting for almost 35%
of the international trade coming through iron ore, lead, diamond, rutile, zinc and aluminum.
Australia has been the key support for supplying its valuable minerals and metals for the growing
Chinese Economy by meeting the various industrial demands of the economy. It is important to
note that the Australia Metal and Mining Industry on a standalone basis has added around 148
Billion AUD for the overall growth of the Australian Economy (FMG 2020). When comparing
these figures based on a quantitative approach around 6.4% of the gross value has been added in
Australia and is accounted for one of the largest contributors in the country. The current
performance of the company has been remarkably sound and this has been particularly due to the
increasing global industry and development in the technological field which have further helped
the companies to operate efficiently (FMG.AU | Fortescue Metals Group Ltd. Financial
tabler-icon-diamond-filled.svg

Paraphrase This Document

Need a fresh take? Get an instant paraphrase of this document with our AI Paraphraser
Document Page
4FINANCE
Statements - WSJ 2020). The future performance of the company as observed with the growth of
industry is expected to be sound as the industry grows and operational efficiency continues to
increase in the company. The historical growth of the revenue can be well below as shown:
It is important to note that with the rise in the global economy and China as an economic
powerhouse in the early 2000’s, the Australian have been very lucky to enjoy the rising global
demand for metals and mining (IBIS World Data 2020). The key strength of the management of
the company is in terms of efficient management of the resources and the cost control activities
which has been widely adopted by the management. Investing in research and development and
technological innovations has helped the company increase its profit base by reducing the cost of
operations (Fortescue Metals Group Financial Ratios for Analysis 2010-2019 | FSUGY 2020).
As analyzed from the above figures reported that the revenue or the production capacity for the
company has increased consistently for the company. Analyzing the financial performance of the
company growth in the net profit margin of the company from 3.65% in the year 2015 to around
Document Page
5FINANCE
31.65% has been observed. At the same time, with the increase in the net profit margin of the
company the return on the shareholder’s equity for the company increased from 4.19% to around
30.06% in the year 2015-2019. While, it is important to note that the leverage ratio of the
company reflecting the total debt to equity ratio of the company has decreased and this has been
effectively done by the management of the company to decrease the overall financial risk that is
associated with the company.
Analyzing the remuneration trend for the key management executives for the FMG
Company which has increased considerably for the company from the year 2019 and this has
been primarily due to the increase in the cash, salary and fees base for the key executives as
shown below. The highest earner in the company is earned by the CEO of the company which is
Elizabeth Gaines whose reported total remuneration for the year 2019 was around A$5.003
Million and the same was around A$2.52 Million in the year 2018 (Mining in Australia:
Everything You Need to Know 2020). The non-wages related payments which are made to the
key executives and other management executives are in the form of Share-Based Payments
which are paid to the executives of the company. The remuneration trend of the key executives
of the company and the changes observed for the year 2018 and 2019 has been well highlighted
below:
Document Page
6FINANCE
Conclusion
The financial analysis for the company conducted well shows that the profitability and
return generated for the shareholders of the company has increased and this specifically has
helped the investors earn a better set of profitability. The industry trend and the overall projected
financial performance of the company is expected to well stay stable and grow at an increasing
rate. The business operations of the company has been also well managed with a wide range of
tabler-icon-diamond-filled.svg

Paraphrase This Document

Need a fresh take? Get an instant paraphrase of this document with our AI Paraphraser
Document Page
7FINANCE
activities undertaken by the company such as decreasing the financial risk by decreasing the debt
in the overall capital structure and stabilizing the overall business operations of the company.
Document Page
8FINANCE
References
(FMG), F. 2020 Fortescue Metals (FMG) Financial Ratios, Investing.com. Available at:
https://www.investing.com/equities/fortescue-metals-ratios (Accessed: 15 February 2020).
.Annual Report 2018. Annualreports.com. Available at:
http://www.annualreports.com/HostedData/AnnualReports/PDF/ASX_FMG_2018.pdf
(Accessed: 15 February 2020).
Annual Report 2019. Fmgl.com.au. Available at:
https://www.fmgl.com.au/docs/default-source/annual-reporting-suite/fy19-annual-report.pdf
(Accessed: 15 February 2020).
FMG.AU | Fortescue Metals Group Ltd. Financial Statements - WSJ 2020. Available at:
https://www.wsj.com/market-data/quotes/AU/XASX/FMG/financials (Accessed: 15 February
2020).
Fortescue Metals Group Financial Ratios for Analysis 2010-2019 | FSUGY 2020. Available at:
https://www.macrotrends.net/stocks/charts/FSUGY/fortescue-metals-group/financial-ratios
(Accessed: 15 February 2020).
IBIS World Data 2020. Available at: https://my.ibisworld.com/au/en/industry/b0801/major-
companies#9192 (Accessed: 15 February 2020).
Mining in Australia: Everything You Need to Know 2020. Available at:
https://www.ig.com/au/news-and-trade-ideas/shares-news/mining-in-australia-190102
(Accessed: 15 February 2020).
Document Page
9FINANCE
Appendix
Ratio Analysis
Particulars 2015 2016 2017 2018 2019
Net Profit 411,458,333
1,326,420,68
4
2,721,008,84
0
1,187,931,26
7
4,544,417,51
0
Sales
11,264,322,9
16
9,806,086,72
2
10,999,739,9
89
9,358,679,47
5
14,366,177,0
99
Net Profit Margin 3.65% 13.53% 24.74% 12.69% 31.63%
Net Profit 411,458,333
1,326,420,68
4
2,721,008,84
0
1,187,931,26
7
4,544,417,51
0
Shareholder's Equity
9,813,802,08
3
11,319,687,5
84
12,654,706,1
88
13,167,365,7
15
15,116,212,7
47
Return on
Shareholder's Equity 4.19% 11.72% 21.50% 9.02% 30.06%
Long Term Debt
12,257,812,5
00
8,992,728,25
2
5,655,226,20
9
5,246,921,93
2
5,512,619,42
1
Shareholder's Equity
9,813,802,08
3
11,319,687,5
84
12,654,706,1
88
13,167,365,7
15
15,116,212,7
47
Debt to Equity Ratio 124.90% 79.44% 44.69% 39.85% 36.47%
Total Liabilities
17,998,697,9
16
14,719,903,0
43
12,195,787,8
31
10,982,275,7
40
12,965,920,4
33
Total Assets
27,812,500,0
00
26,039,590,6
27
24,850,494,0
19
24,149,641,4
55
28,082,133,1
81
Debt Ratio 64.71% 56.53% 49.08% 45.48% 46.17%
Earnings Before
Interest and Tax
1,365,885,41
6
2,702,666,30
7
4,485,179,40
7
2,534,163,17
1
6,875,802,08
1
Interest Expenses 838,541,666 908,968,489 652,626,105 882,153,971 397,832,596
Interest Coverage
Ratio 1.63 2.97 6.87 2.87 17.28
chevron_up_icon
1 out of 10
circle_padding
hide_on_mobile
zoom_out_icon
[object Object]