Information System Analysis Report: TPS Selection for XYZ Company
VerifiedAdded on 2023/01/20
|8
|1430
|59
Report
AI Summary
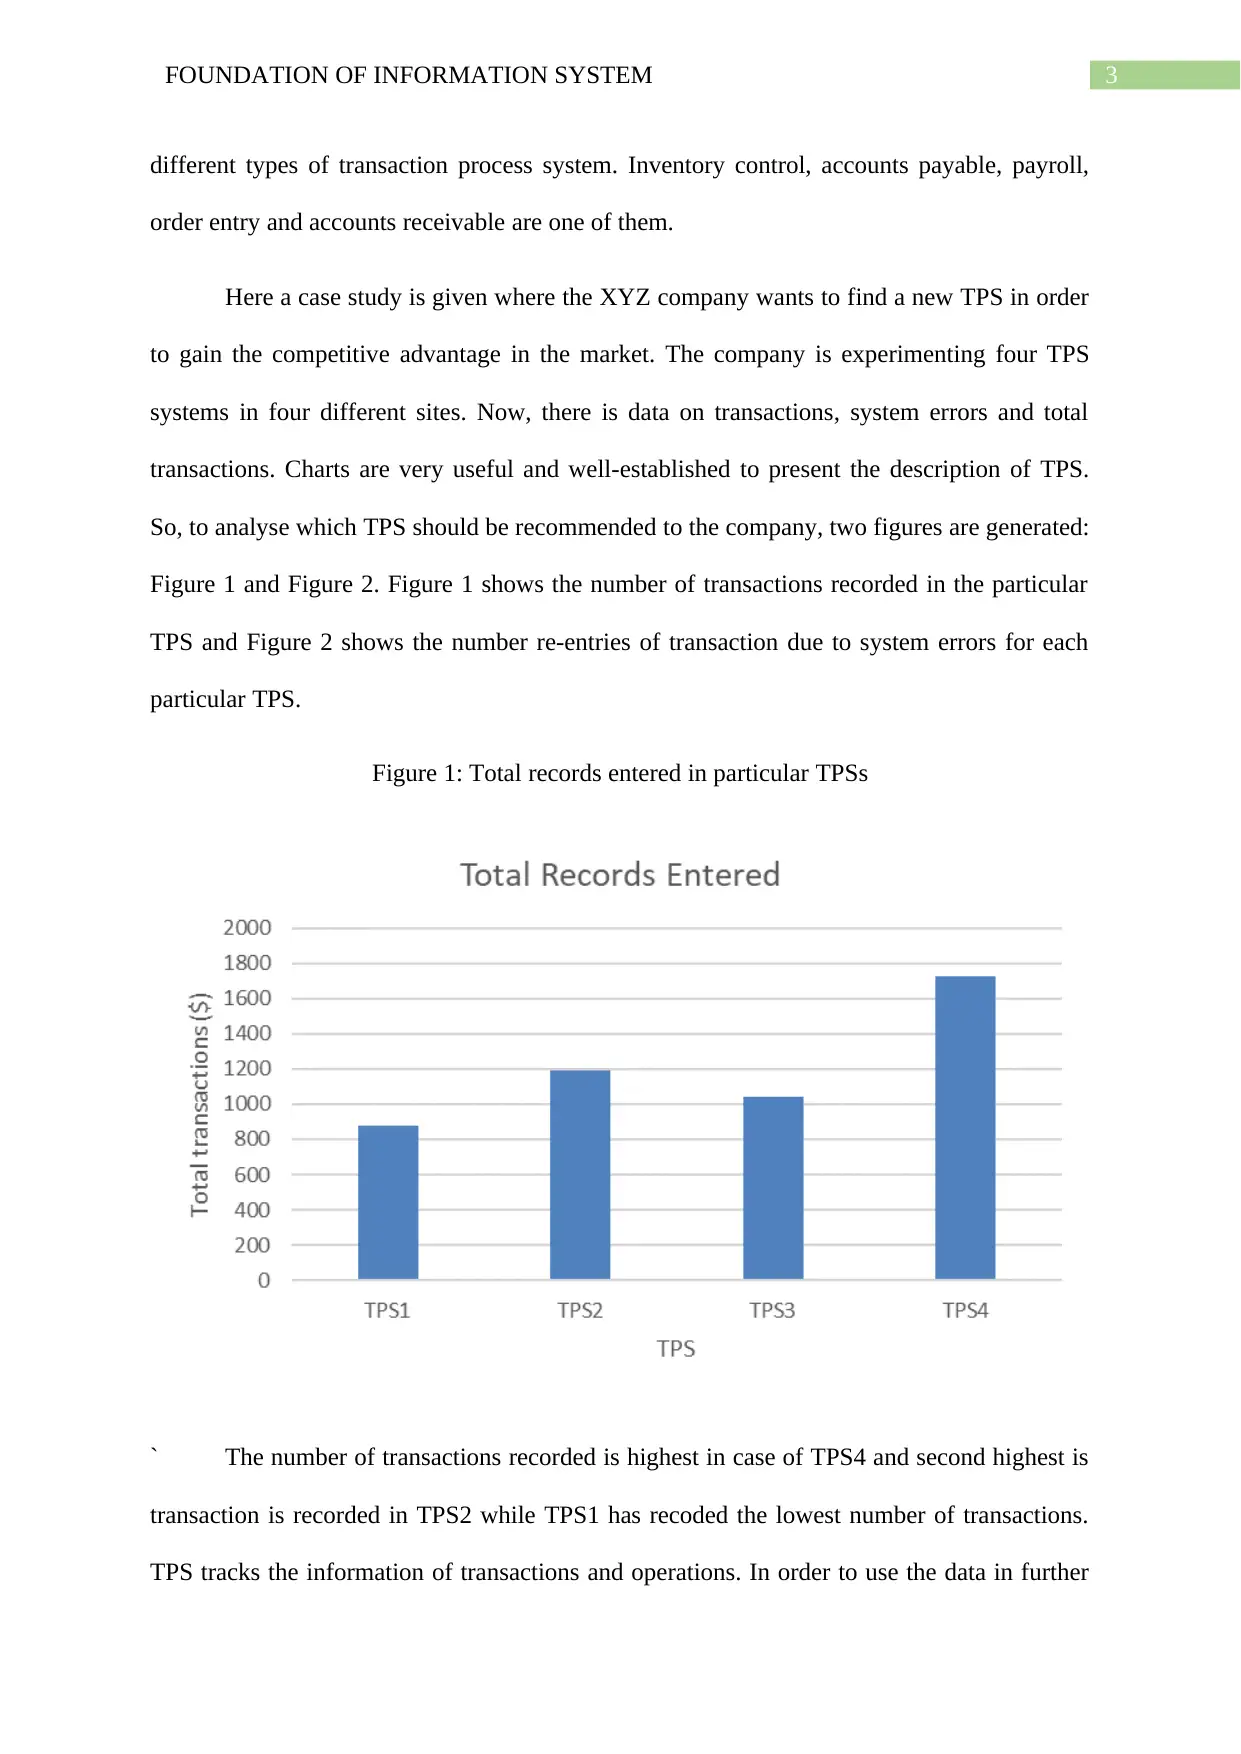
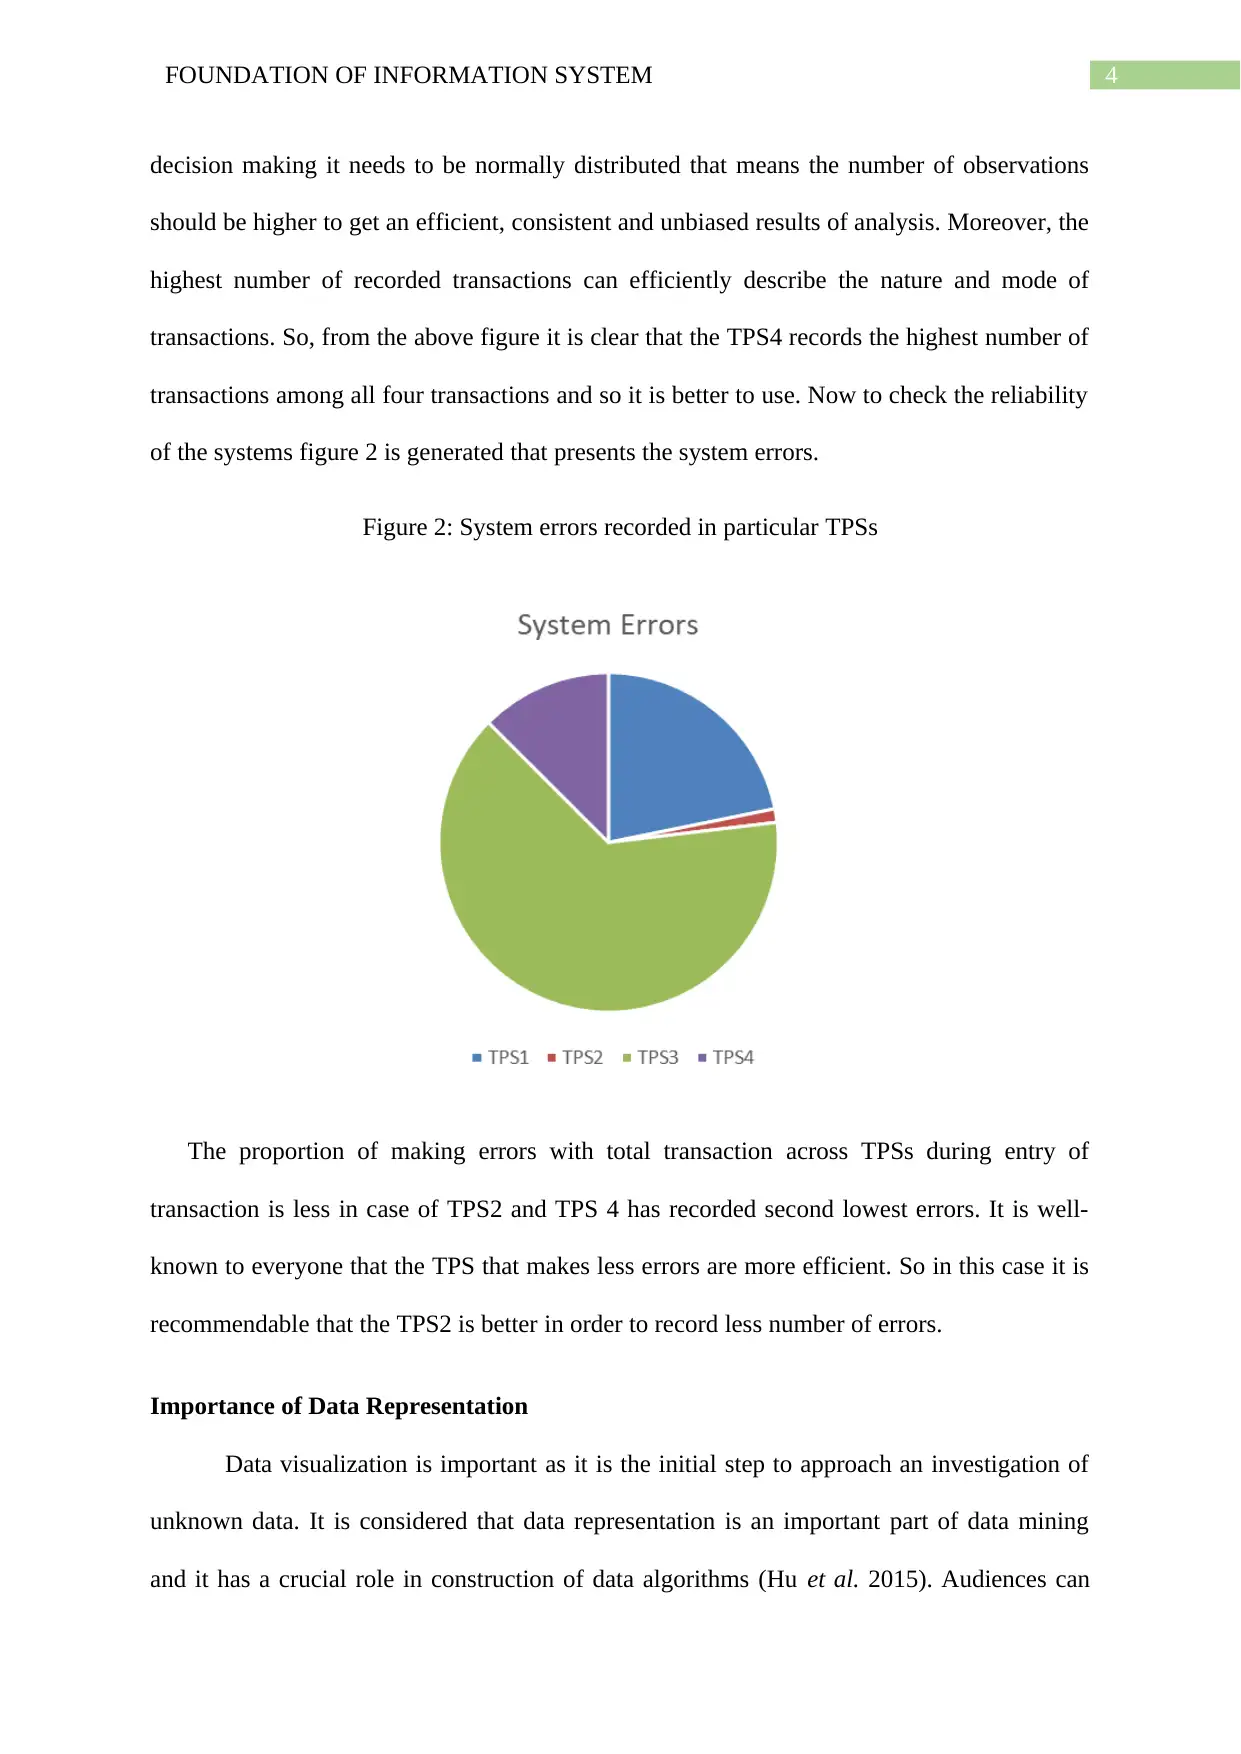
This report examines the foundation of modern information systems and their impact on businesses, emphasizing the role of Transaction Processing Systems (TPS). It presents a case study of the XYZ company, comparing four different TPS systems based on transaction records and system errors, utilizing figures and charts to analyze performance. The report recommends the optimal TPS based on error rates and transaction volume. Furthermore, it highlights the importance of data representation and visualization in data mining, detailing graphical and tabular methods for presenting data effectively. The conclusion reiterates the competitive advantages gained through the use of modern information systems and the significance of data representation in achieving these advantages. The report is supported by several references.

Running head: FOUNDATION OF INFORMATION SYSTEM
Foundation of Information System
Name of the Student:
Name of the University:
Author Note:
Foundation of Information System
Name of the Student:
Name of the University:
Author Note:
Secure Best Marks with AI Grader
Need help grading? Try our AI Grader for instant feedback on your assignments.

1FOUNDATION OF INFORMATION SYSTEM
Table of Contents
Introduction................................................................................................................................2
Transaction Processing System Selection..................................................................................2
Importance of Data Representation............................................................................................4
Conclusion..................................................................................................................................5

2FOUNDATION OF INFORMATION SYSTEM
Introduction
The modern information system is expanding at higher pace in the economy. No
business, company or profit earning institutions can get away from its influence. The
businesses are taking a new turn by significant reductions in costs of obtain, process and
transition of information. The information technology is a potential booster to the business.
This involves hardware, data recognition equipment, factory automation, communications
technology and services. The modern information system is operating in market in specific
ways:
It is making a difference in the rule of competition by effecting the structure of
industry.
It creates the competitive advantage by enhancing the companies with new ideas.
A company must have to provide the value that is greater than the cost of producing the
value in order to gain the profit. This helps the company to gain the competitive advantage. In
reducing the cost of production or producing values there are activities that are connected by
linkages which can create the difference in performing that are optimized by using the
information system (Munizu, Pono and Alam 2019). A vigilant management of linkages can
create powerful sources of competitive advantage.
Transaction Processing System Selection
Transaction is performed in all business during operations. Transaction Processing
system is a system to process and capture the company’s business transactions and detailed
information to support and update the operations of an enterprise. A TPS keeps all the records
of non-enquiry transaction and tracks its influences in the database and helps to generate
documents related to the transaction (McLaughlin et al. 2019). There are a number of

3FOUNDATION OF INFORMATION SYSTEM
different types of transaction process system. Inventory control, accounts payable, payroll,
order entry and accounts receivable are one of them.
Here a case study is given where the XYZ company wants to find a new TPS in order
to gain the competitive advantage in the market. The company is experimenting four TPS
systems in four different sites. Now, there is data on transactions, system errors and total
transactions. Charts are very useful and well-established to present the description of TPS.
So, to analyse which TPS should be recommended to the company, two figures are generated:
Figure 1 and Figure 2. Figure 1 shows the number of transactions recorded in the particular
TPS and Figure 2 shows the number re-entries of transaction due to system errors for each
particular TPS.
Figure 1: Total records entered in particular TPSs
` The number of transactions recorded is highest in case of TPS4 and second highest is
transaction is recorded in TPS2 while TPS1 has recoded the lowest number of transactions.
TPS tracks the information of transactions and operations. In order to use the data in further
Secure Best Marks with AI Grader
Need help grading? Try our AI Grader for instant feedback on your assignments.

4FOUNDATION OF INFORMATION SYSTEM
decision making it needs to be normally distributed that means the number of observations
should be higher to get an efficient, consistent and unbiased results of analysis. Moreover, the
highest number of recorded transactions can efficiently describe the nature and mode of
transactions. So, from the above figure it is clear that the TPS4 records the highest number of
transactions among all four transactions and so it is better to use. Now to check the reliability
of the systems figure 2 is generated that presents the system errors.
Figure 2: System errors recorded in particular TPSs
The proportion of making errors with total transaction across TPSs during entry of
transaction is less in case of TPS2 and TPS 4 has recorded second lowest errors. It is well-
known to everyone that the TPS that makes less errors are more efficient. So in this case it is
recommendable that the TPS2 is better in order to record less number of errors.
Importance of Data Representation
Data visualization is important as it is the initial step to approach an investigation of
unknown data. It is considered that data representation is an important part of data mining
and it has a crucial role in construction of data algorithms (Hu et al. 2015). Audiences can

5FOUNDATION OF INFORMATION SYSTEM
easily observe and analyze the data if the data is presented graphically. Mainly two ways are
there to present data: graphical presentation and tabular presentation. There are some
characteristics of these two methods to analyze and interpret the data in an efficient way.
Determining the dependent variable, proper use of units and choosing the proper graph and
table are the main principal to present the data. There are a number of graphs like bar
diagram, line diagram, pie chart and scatter diagram. Each of these diagrams have their own
characteristics in presenting specific types of data. Bar diagram is best in showing a change in
different operations, line diagram is efficient in showing a change in population and pie chart
is efficient in showing share of different parts (Tan 2018).
Conclusion
The use of modern system creates competitive advantage for profit earning institutions
through reducing the costs of operation and linkages that connect the production process
(Srinivasan and Swink 2018). These creates the advantage to the institution against rivals
through changing the structure of industry.
From the above two figures, it is observed that the TPS2 is better among the other TPSs
as it has minimum system errors. The pie chart is clearly showing that the proportion of
errors to the total errors of TPS2 is minimum. One more way to present the result for efficient
TPS is creating a variable that shows the proportion of errors to the transaction recorded to
the particular TPS. This variable shows the proportion of making errors of that particular TPS
not the proportion of errors to the over errors generated by all TPSs.
Data representation is an easy technique to present the result of an analysis and to
interpret the result. From the above discussion, it is very clear that one can get comparative
advantage by using modern information system and it is easy to analyze through data
representation.

6FOUNDATION OF INFORMATION SYSTEM
Paraphrase This Document
Need a fresh take? Get an instant paraphrase of this document with our AI Paraphraser

7FOUNDATION OF INFORMATION SYSTEM
Reference:
Börner, K., Bueckle, A. and Ginda, M., 2019. Data visualization literacy: Definitions,
conceptual frameworks, exercises, and assessments. Proceedings of the National Academy of
Sciences, 116(6), pp.1857-1864.
Hu, Y., Gansner, E., Kobourov, S. and Volinsky, C.T., AT&T Intellectual Property I LP,
2015. Visualization and representation of data clusters and relations. U.S. Patent 8,970,593.
Kasemsap, K., 2018. The role of information system within enterprise architecture and their
impact on business performance. In Global Business Expansion: Concepts, Methodologies,
Tools, and Applications (pp. 1078-1102). IGI Global.
McLaughlin, E.G., Haymond, S.G., Jansson, C.D., Lorberg, D.J. and Clark, R., Mastercard
International Inc, 2019. Method and system for improved transaction processing and routing.
U.S. Patent Application 16/034,489.
Munizu, M., Pono, M. and Alam, S., 2019. The Impact of Information Technology
Application on Supply Chain Integration and Competitive Advantage: Indonesian Fishery
Industry Context. Quality-Access to Success, 20(169).
Srinivasan, R. and Swink, M., 2018. An investigation of visibility and flexibility as
complements to supply chain analytics: An organizational information processing theory
perspective. Production and Operations Management, 27(10), pp.1849-1867.
Tajima, S., Seiko Epson Corp, 2018. Transaction system and information processing method.
U.S. Patent Application 10/083,432.
Tan, P.N., 2018. Introduction to data mining. Pearson Education India.
1 out of 8
Related Documents

Your All-in-One AI-Powered Toolkit for Academic Success.
+13062052269
info@desklib.com
Available 24*7 on WhatsApp / Email
Unlock your academic potential
© 2024 | Zucol Services PVT LTD | All rights reserved.