MIS770: Foundation Skills in Data Analysis - Annual Report Visuals
VerifiedAdded on 2023/04/20
|18
|3012
|243
Report
AI Summary
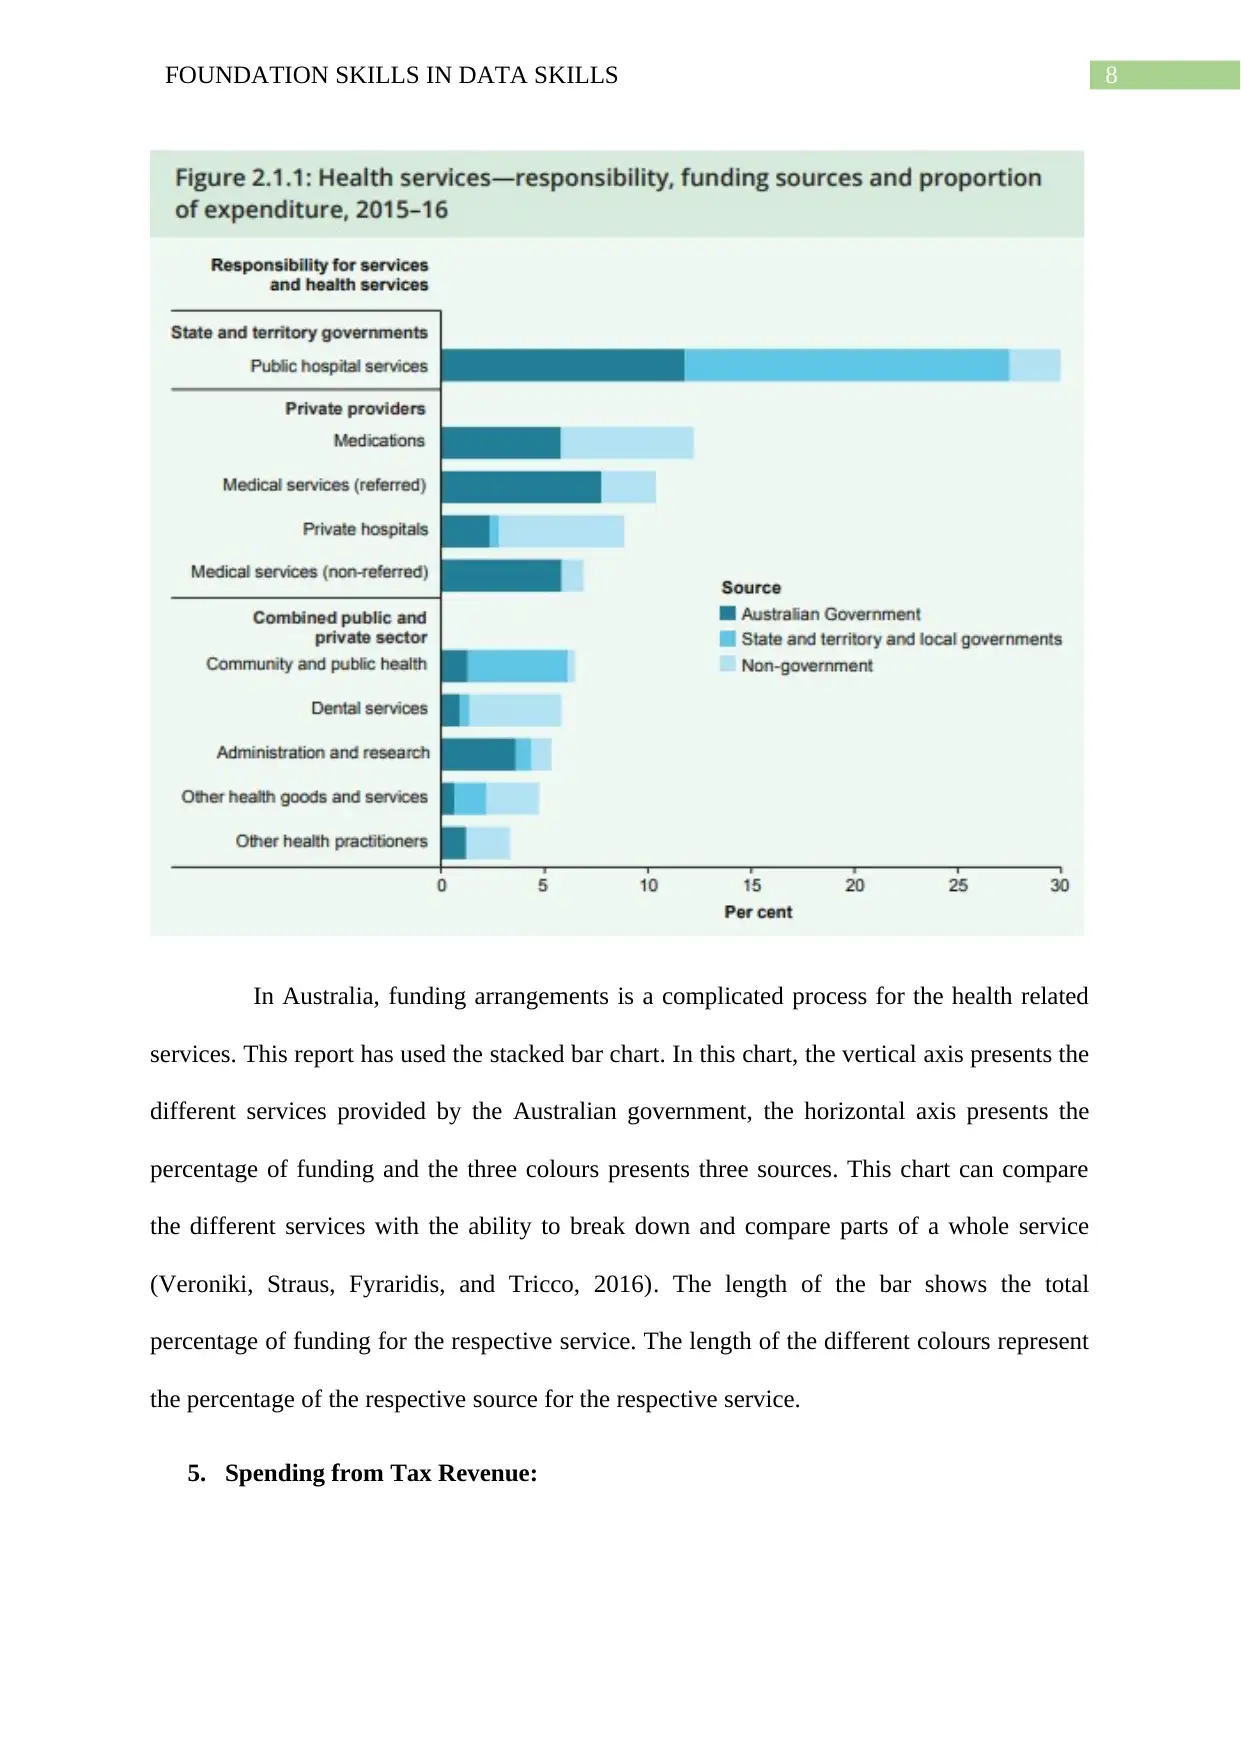
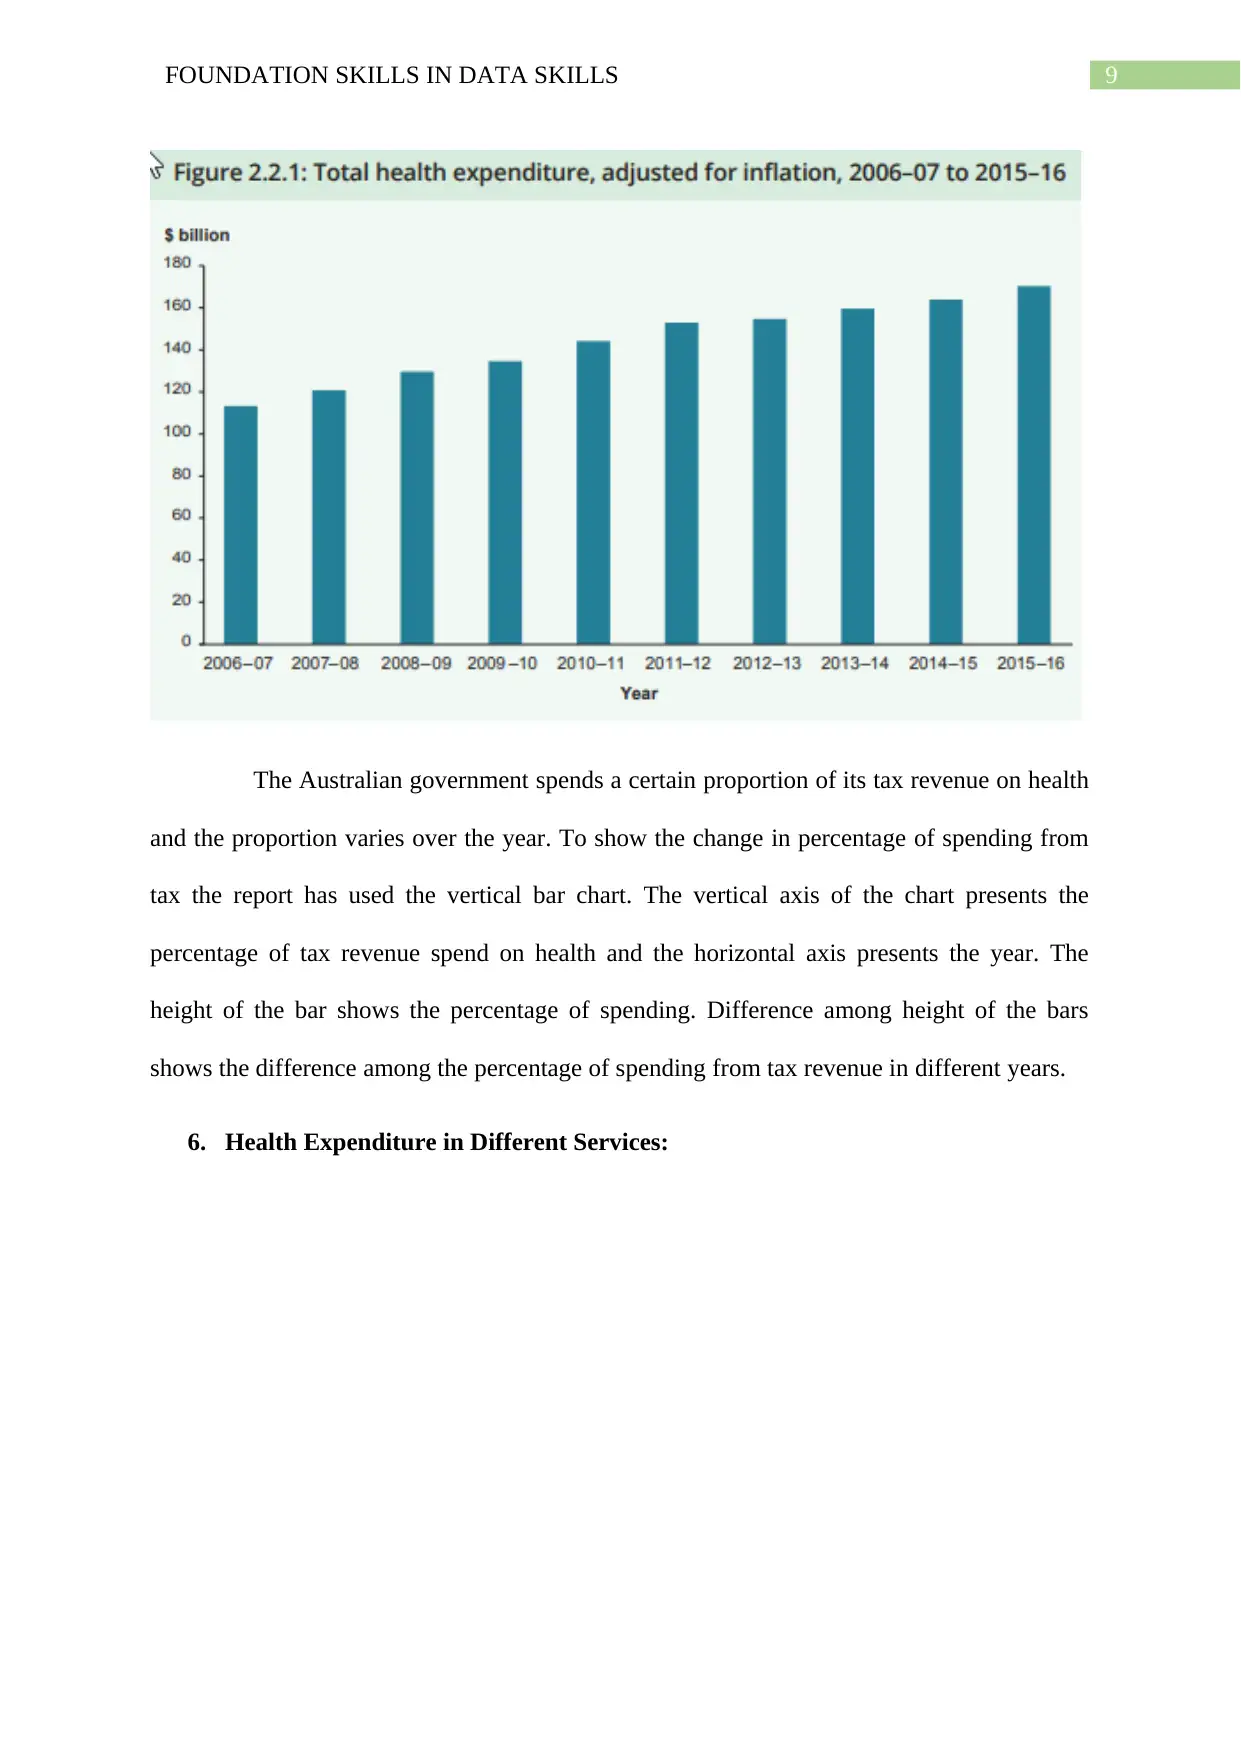
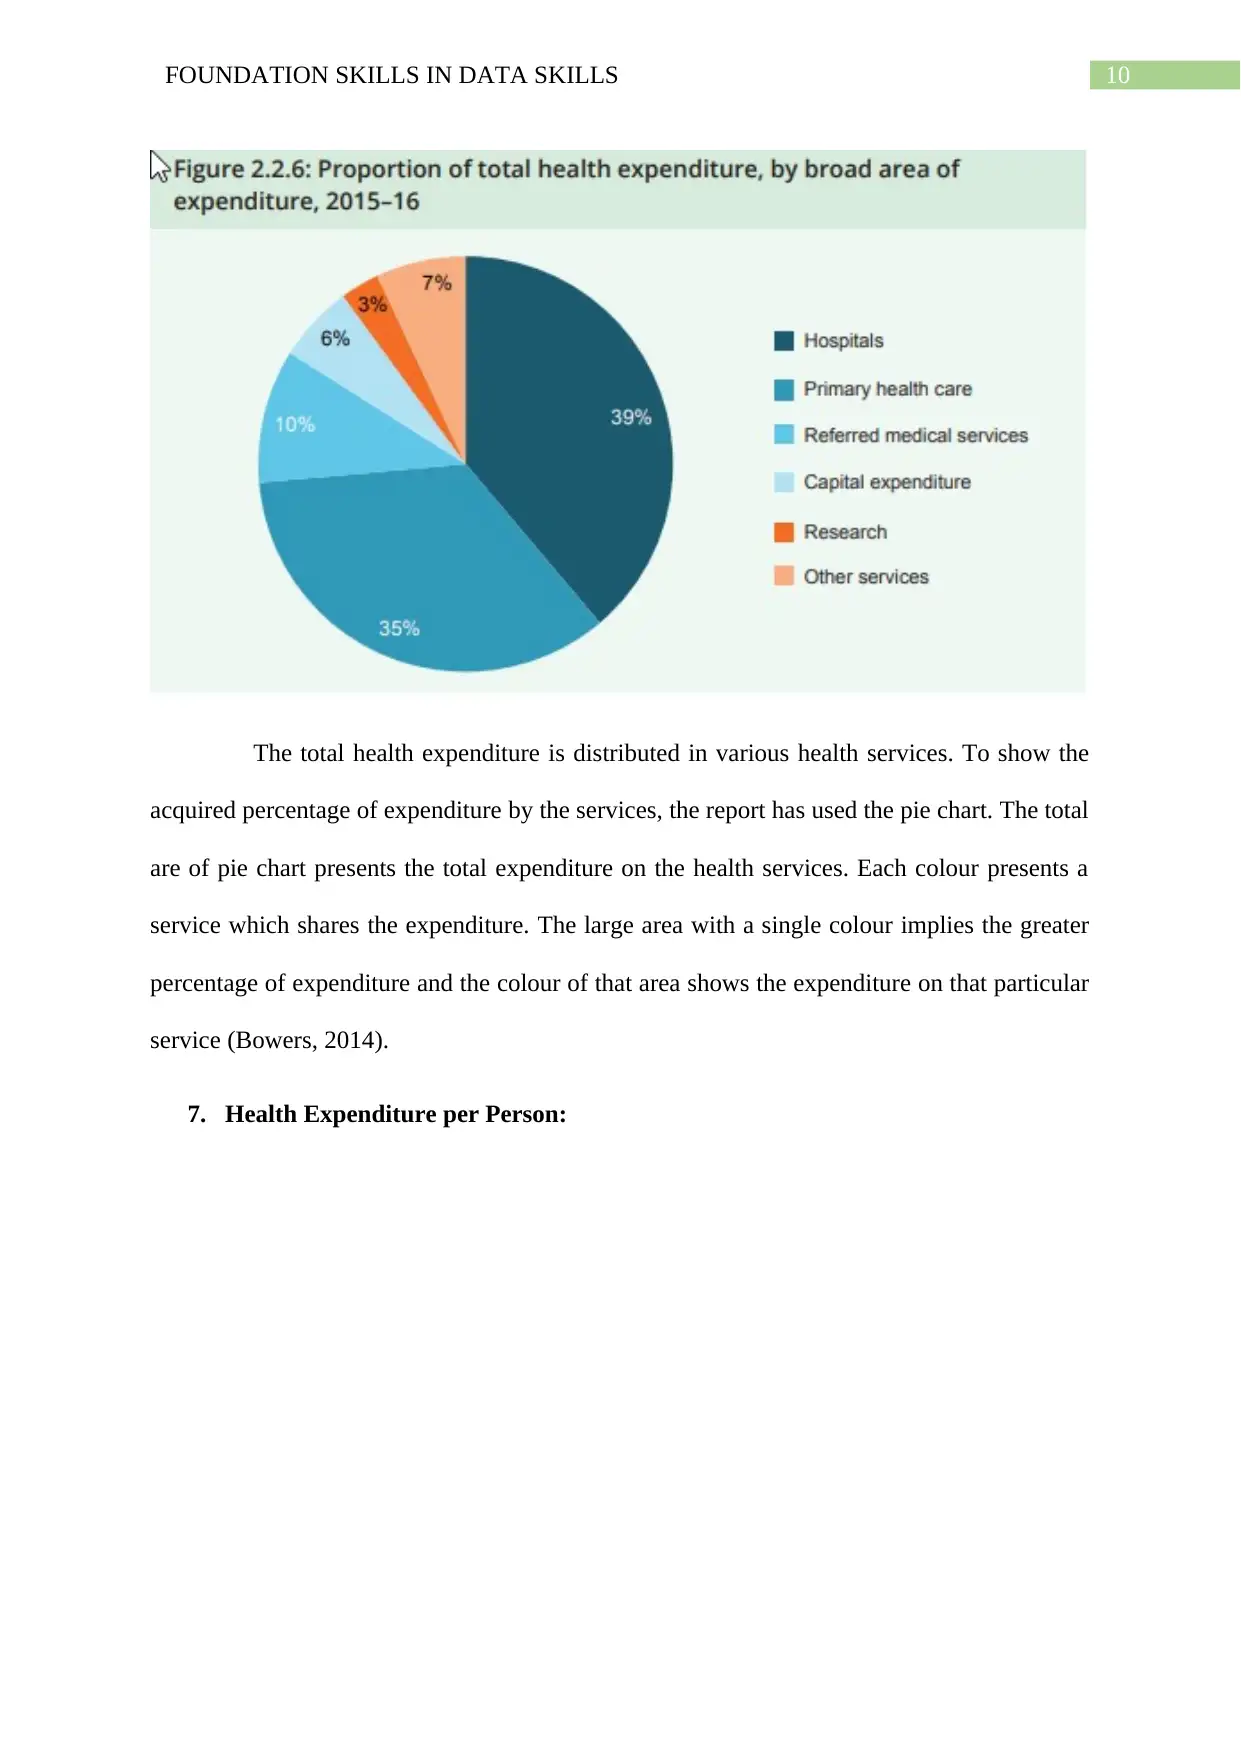
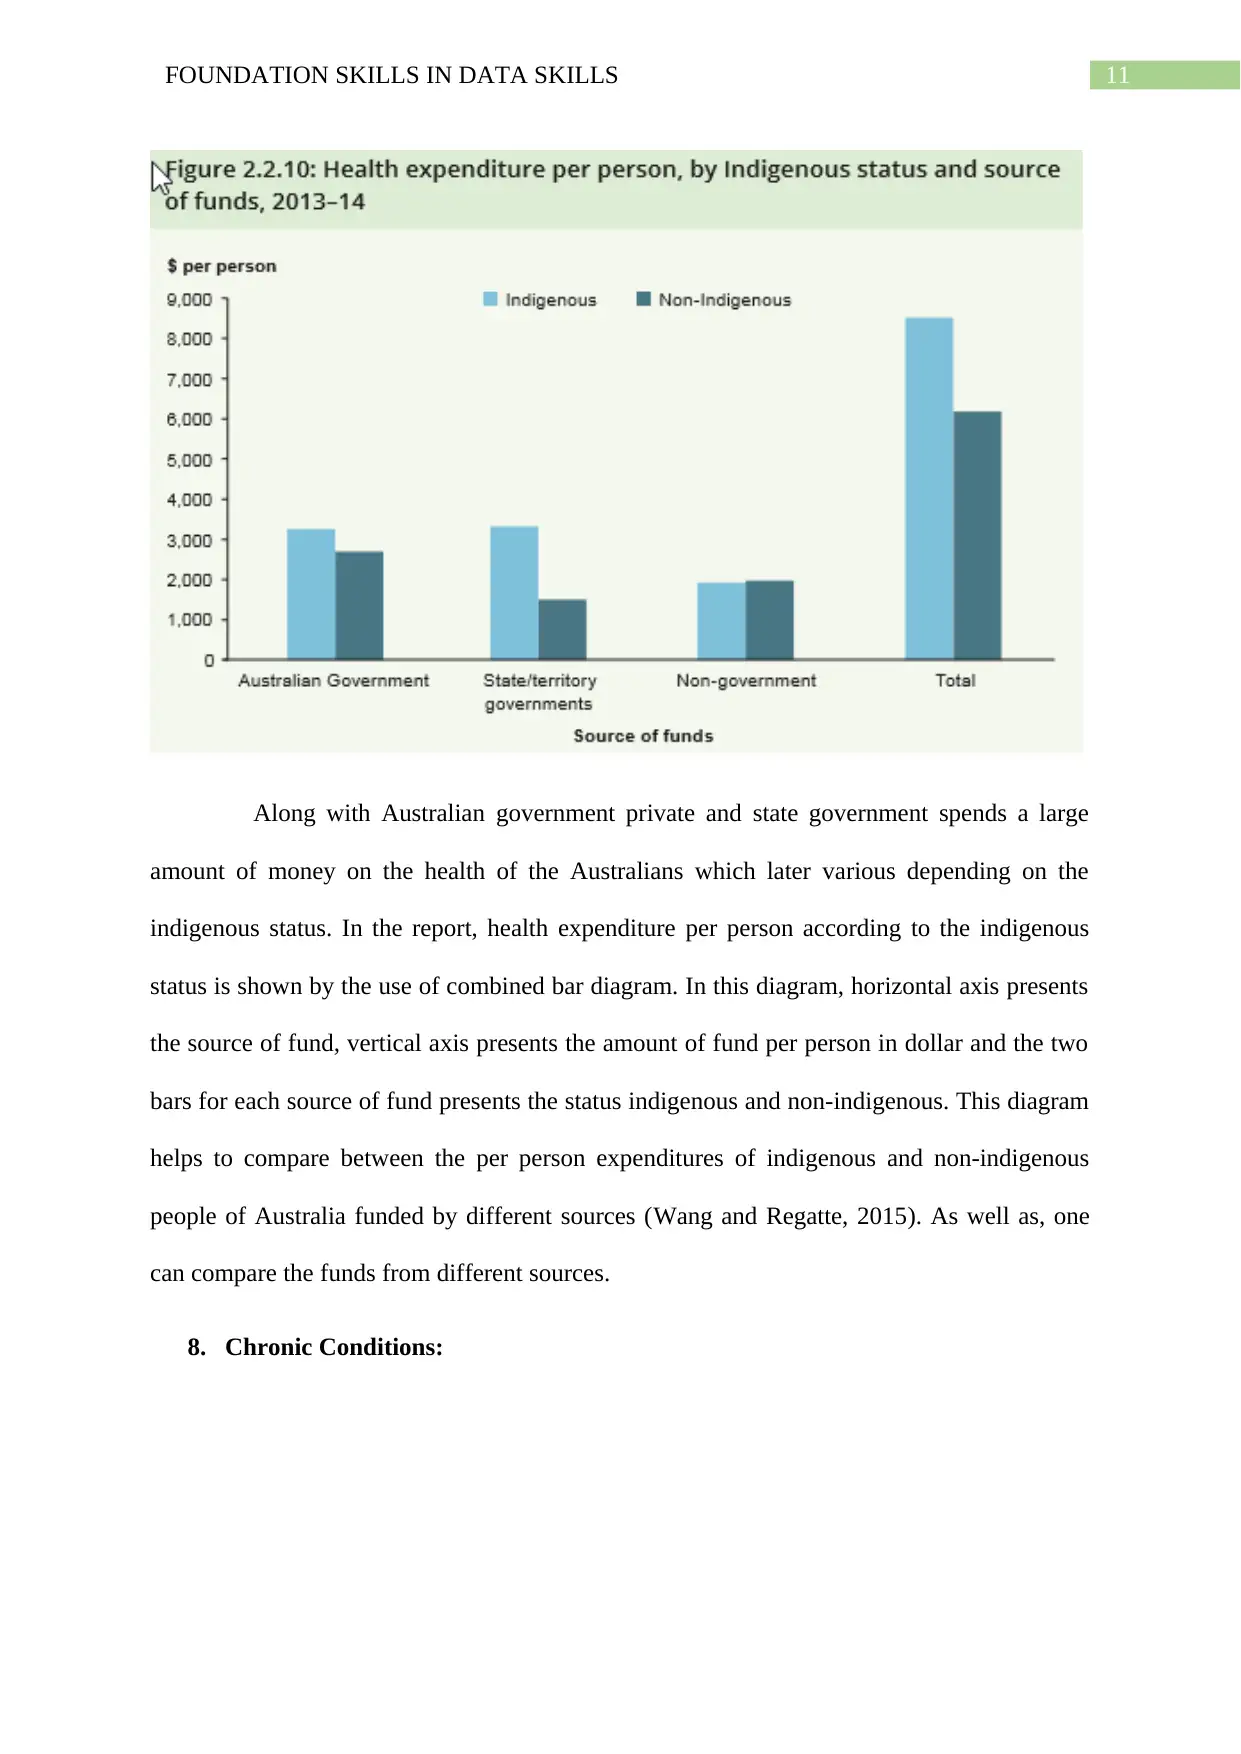
This report provides an analysis of data visualization techniques used in annual reports, with a specific focus on the Australia’s Health 2018 report published by the Australian Institute of Health and Welfare. The report is divided into two parts: Part A discusses the criteria for effective data visualization, including tabular charts and graphical presentations like vertical bar charts, stacked bar charts, and line charts. It highlights the importance of clear labeling, appropriate data selection, and avoiding misinterpretation. Part B applies these criteria to analyze the Australia’s Health 2018 report, examining the use of tables to present workforce summaries and alcohol consumption trends, as well as the use of graphs to illustrate life expectancy, funding arrangements, tax revenue spending, health expenditure, chronic conditions, cancer incidence trends, and mortality rates for people with diabetes. The report evaluates the effectiveness of these visualizations in conveying complex health information.

Running head: FOUNDATION SKILLS IN DATA SKILLS
Foundation Skills in Data Skills
Name of the Student:
Name of the University:
Author Note:
Foundation Skills in Data Skills
Name of the Student:
Name of the University:
Author Note:
Paraphrase This Document
Need a fresh take? Get an instant paraphrase of this document with our AI Paraphraser

1FOUNDATION SKILLS IN DATA SKILLS
Table of Contents
Introduction:...............................................................................................................................2
Part-A.........................................................................................................................................2
Part B:.........................................................................................................................................5
Tabular Presentation:.................................................................................................................5
Graphical Presentation:..............................................................................................................6

2FOUNDATION SKILLS IN DATA SKILLS
Introduction:
The annual report of an organisation is published publicly by the particular
organisation. It contains a brief information about operations and financial conditions.
Different types of charts or graphs and tables are used to provide a visual presentation which
is easy to understand. The data is presented through proper charts and tables in the annual
report. Charts or graphs easily transform the data into visualization (Evergreen, 2016). There
are different types of charts or graphs which are used according to the type and nature of
information.
In this report, there are two parts: Part-A and Part-B. In Part-A, visualization criteria
is discussed. The visualisation criterions are important in data analysis. The study of annual
report, Australia’s Health 2018 published by Australian Institute of Health and welfare is
presented in Part-B using the tables and charts or graphs. Australia has ranked 2nd on the
United Nations Development Programme’s Human Development Index in 2011.
Part-A
The specialized representation of a data can help the user of the report to understand
the data more easily. To present any graph or chart there are some specific criteria which
needs to be followed. The criterions are discussed below:
1. Tabular Charts:
Tables usually presents raw data in an organized manner. It contains huge information
which can be extracted to understand the small parts easily. The norms for tabular
representation are mentioned bellow:
Variables should be in the column when they are compared (Arcidiacono, Aucejo,
and Hotz, 2016).
⊘ This is a preview!⊘
Do you want full access?
Subscribe today to unlock all pages.

Trusted by 1+ million students worldwide

3FOUNDATION SKILLS IN DATA SKILLS
Categorical variables should be placed in the rows for the effective analysis
(Chevalier and Corp, 2014).
The proper measurement units should be mentioned.
Table does not contain explanation for the given information.
It is useful for comparative analysis.
2. Graphical Presentation:
Graphical presentation is the visualization of data by using the charts and plots. There are
a number of charts and plots that are used in the graphical representation depending on the
nature of the data. Here some usual features of the graphical representation are described:
The dependent variable placed on vertical axis and the independent variable on x-axis
gives better result (Tomak, Bek, and Cengiz, 2016).
Interval should be equal for all two consecutive labels.
Variables starts from zero.
These are the common features of graphs and charts. However, there are specific features
of each graphs and chart.
1. Vertical Bar Chart:
A vertical bar chart shows categorical data with specific heights of bar. Height of these
bar presenting a variable is proportional to the values of that variable. Basic features of this
chart are:
Independent variable should be placed on x-axis from left to right.
Heights of bar presents the value of dependent variable at various level of
independent variable.
Use of various colours in bar for each year to easy identification.
Paraphrase This Document
Need a fresh take? Get an instant paraphrase of this document with our AI Paraphraser

4FOUNDATION SKILLS IN DATA SKILLS
2. Stacked Bar Chart:
Stacked bar charts have bars to compare between categorical data with segments. The
segments shows the different parts of the bar. The basic features are:
Sub-segments are placed in bars horizontally.
The bar compare the sub-segments.
It compares total value of independent categorical variable.
It compares the changes in the proportions of sub-segments (Heiberger and Robbins,
2014).
3. Line Chart:
Line Chart shows the information as series of points which is also called markers,
connected by straight line. The basic features of line chart are:
The line depicts the dependent variable at each level of independent variable
(Harrison, Yang, Franconeri and Chang, 2014).
It is used to present the trends of data.
It is used when dependent variable is continuously changing.
Tables and graphs are very useful and easy to present any reports. Despite of these
usefulness, it has some limitations that needs to be considered before using in any report
(Frankfort-Nachmias, and Leon-Guerrero, 2017).
Tables and graphs should not include the irrelevant and huge data. The proper libelling in
both the axis is very important. Results are neat and clean when the number of dependent
variable is less (Pigou, 2016). The line chart should not be interpreted in the terms of
intermediate values between two markers.

5FOUNDATION SKILLS IN DATA SKILLS
Part B:
The Australian Institute of Health and Welfare (AIHW) which was established under
The Australian Institute of Health and Welfare Act 1987, is an agency for information and
statistics on health and welfare of Australia (Australia’s health 2018, 2018). The report
considered here for discussion of Australia’s Health 2018 published by AIHW in 2018.
This agency has presented many health issues in Australia by the tabular and
graphical presentation in its report from the year 2018 which are discussed below:
Tabular Presentation:
1. Workforce Summary:
Australian government employs nurses, medical practitioner psychologists and
dentists according to the need related to health. The above table contains the data for the year
2013, the year 2016 and the percentage change in the data. The rows of table contain the
different status of health professions and the column contains the health profession. From the
table one can easily see the positive and negative growth in the status of professionals. The
negative and positive growth is highlighted by two different colours and two arrows
⊘ This is a preview!⊘
Do you want full access?
Subscribe today to unlock all pages.

Trusted by 1+ million students worldwide

6FOUNDATION SKILLS IN DATA SKILLS
indicating the rise and fall in growth (Cecchetti and Kharroubi, 2015). For an example, in
2016, there is a 66% fall in women physiotherapists from 2013.
2. Trends in Alcohol Consumption in Australia:
There is a trend in the alcohol consumption for the young age population in Australia.
To show this trend a table is used which contains the year in columns and drinking
behaviours in rows. From the table one can easily say that in which year drinking behaviour
of young people is better. The first row depicts that there is a fall in alcohol consumption for
the people aged of 14 years or over in the year 2016 than the year 2013 (Watkins,
Wulaningsih, Da Zhou, Marshall, Sylianteng, Rosa, Miguel, Raine, King, and Maruthappu,
2017). Similarly, one more result can be depicted that the people aged 14-24 are slowing
down to start drinking alcohol.
Graphical Presentation:
3. Life Expectancy of Birth by Sex:
Paraphrase This Document
Need a fresh take? Get an instant paraphrase of this document with our AI Paraphraser

7FOUNDATION SKILLS IN DATA SKILLS
Life expectancy is measured in terms of a person is expected to live based on the
current age or living with disease. To show the life expectancy at birth by sex, the report has
used the line chart. In this chart, vertical axis presents the life expectancy at birth in years and
the horizontal axis presents the year. The position of a trend line with respect to the other
trend line depicts the higher or lower life expectancy of the respective trend line than the
referred trend line (Ziuziański, Furmankiewicz, and Sołtysik-Piorunkiewicz, 2014). The slope
of each line shows the increase or decrease in the change of life expectancy. The comparison
of the slopes of trend line compares the change in life expectancy of both genders.
4. Funding Arrangements:

8FOUNDATION SKILLS IN DATA SKILLS
In Australia, funding arrangements is a complicated process for the health related
services. This report has used the stacked bar chart. In this chart, the vertical axis presents the
different services provided by the Australian government, the horizontal axis presents the
percentage of funding and the three colours presents three sources. This chart can compare
the different services with the ability to break down and compare parts of a whole service
(Veroniki, Straus, Fyraridis, and Tricco, 2016). The length of the bar shows the total
percentage of funding for the respective service. The length of the different colours represent
the percentage of the respective source for the respective service.
5. Spending from Tax Revenue:
⊘ This is a preview!⊘
Do you want full access?
Subscribe today to unlock all pages.

Trusted by 1+ million students worldwide

9FOUNDATION SKILLS IN DATA SKILLS
The Australian government spends a certain proportion of its tax revenue on health
and the proportion varies over the year. To show the change in percentage of spending from
tax the report has used the vertical bar chart. The vertical axis of the chart presents the
percentage of tax revenue spend on health and the horizontal axis presents the year. The
height of the bar shows the percentage of spending. Difference among height of the bars
shows the difference among the percentage of spending from tax revenue in different years.
6. Health Expenditure in Different Services:
Paraphrase This Document
Need a fresh take? Get an instant paraphrase of this document with our AI Paraphraser

10FOUNDATION SKILLS IN DATA SKILLS
The total health expenditure is distributed in various health services. To show the
acquired percentage of expenditure by the services, the report has used the pie chart. The total
are of pie chart presents the total expenditure on the health services. Each colour presents a
service which shares the expenditure. The large area with a single colour implies the greater
percentage of expenditure and the colour of that area shows the expenditure on that particular
service (Bowers, 2014).
7. Health Expenditure per Person:

11FOUNDATION SKILLS IN DATA SKILLS
Along with Australian government private and state government spends a large
amount of money on the health of the Australians which later various depending on the
indigenous status. In the report, health expenditure per person according to the indigenous
status is shown by the use of combined bar diagram. In this diagram, horizontal axis presents
the source of fund, vertical axis presents the amount of fund per person in dollar and the two
bars for each source of fund presents the status indigenous and non-indigenous. This diagram
helps to compare between the per person expenditures of indigenous and non-indigenous
people of Australia funded by different sources (Wang and Regatte, 2015). As well as, one
can compare the funds from different sources.
8. Chronic Conditions:
⊘ This is a preview!⊘
Do you want full access?
Subscribe today to unlock all pages.

Trusted by 1+ million students worldwide
1 out of 18
Related Documents

Your All-in-One AI-Powered Toolkit for Academic Success.
+13062052269
info@desklib.com
Available 24*7 on WhatsApp / Email
Unlock your academic potential
Copyright © 2020–2025 A2Z Services. All Rights Reserved. Developed and managed by ZUCOL.