University of Hertfordshire: Data Classification Project 7COM1073

Verified

Added on  2022/09/02

|10
|1341
|18
Project
AI Summary
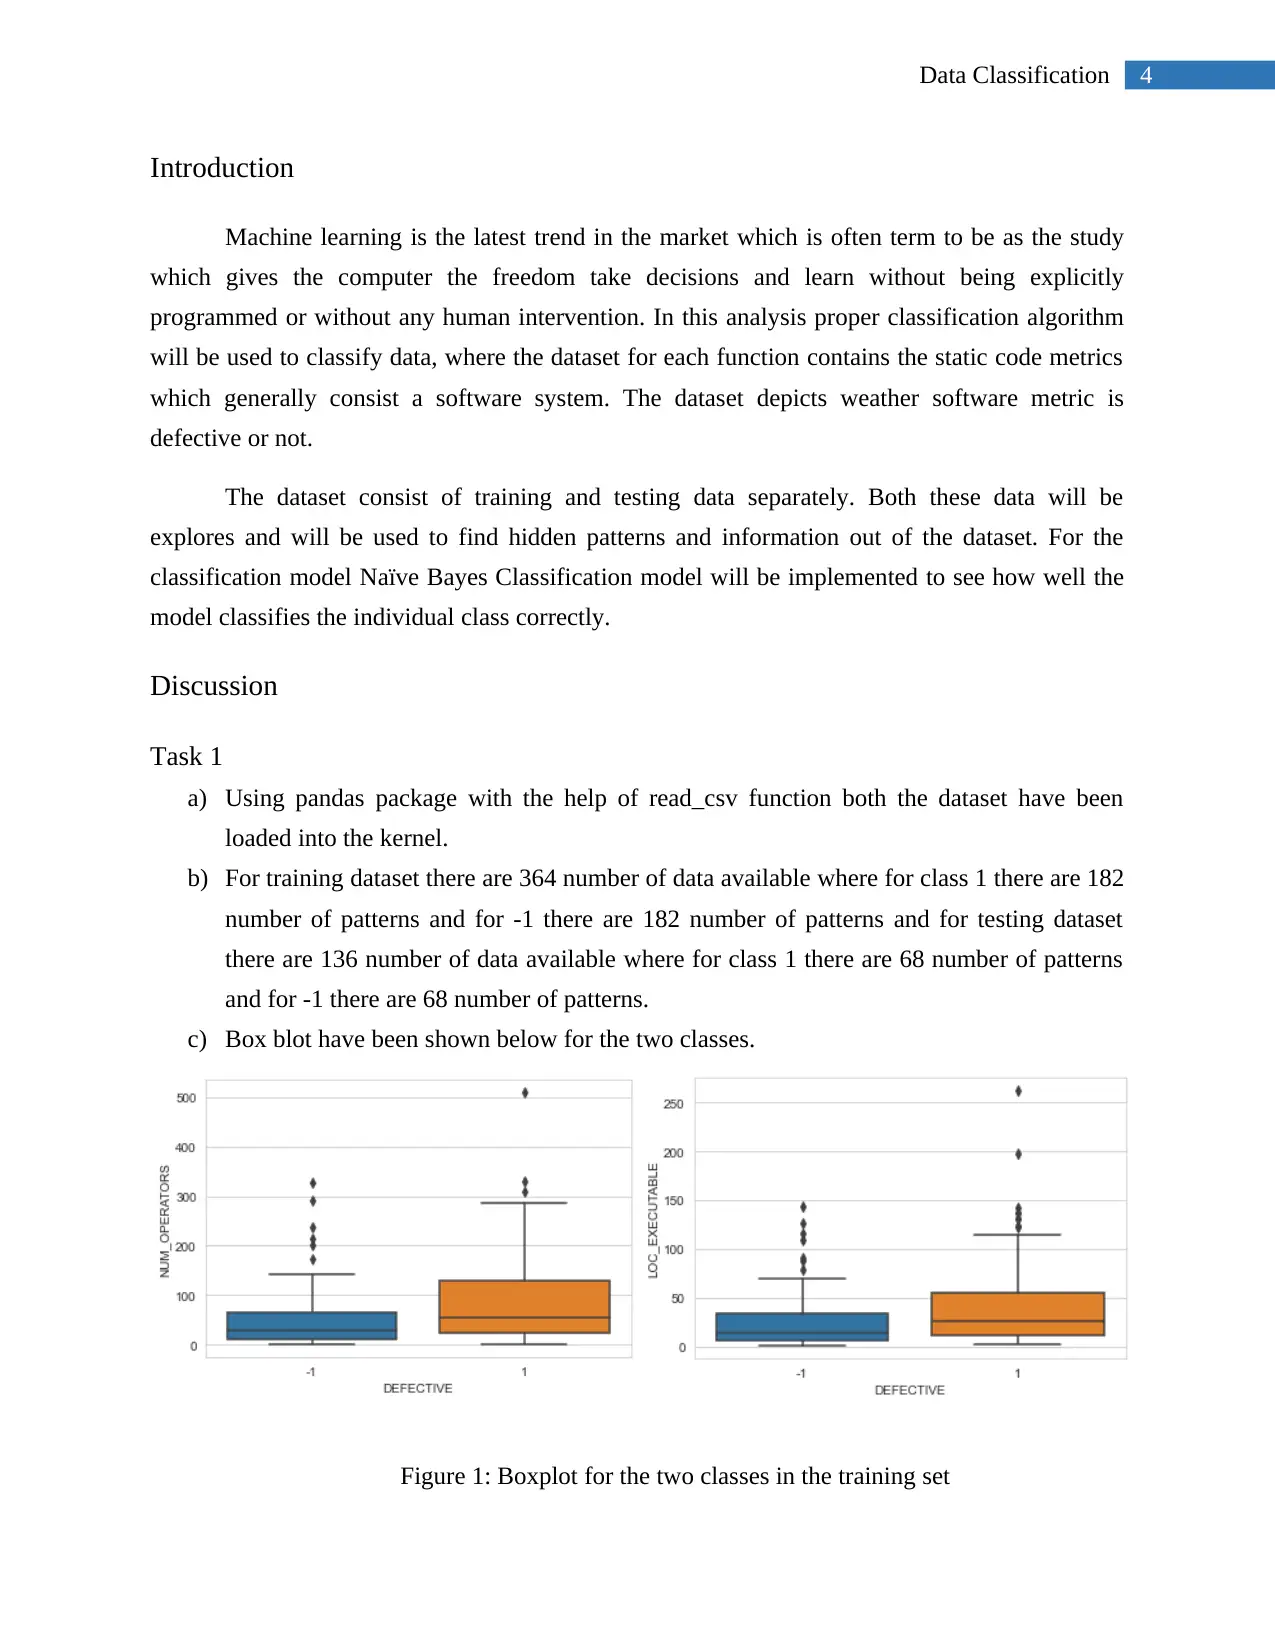
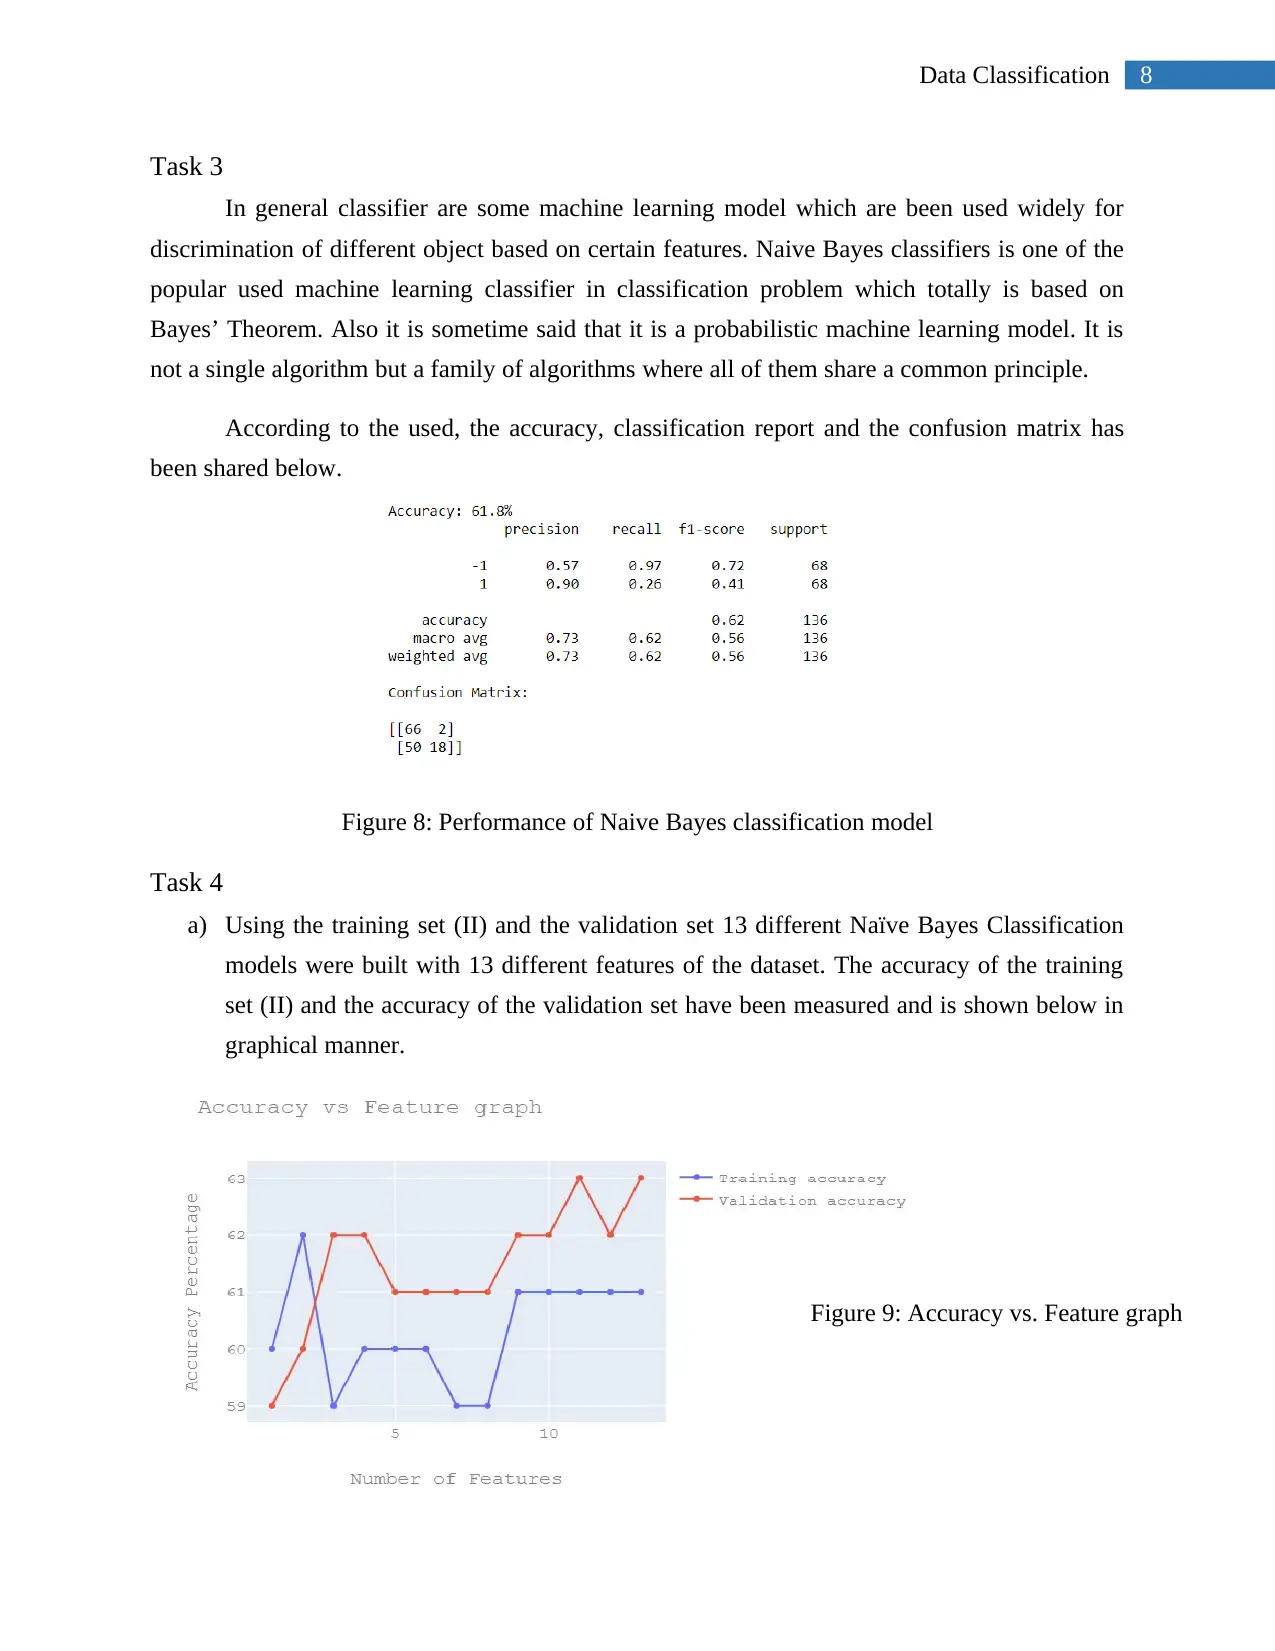
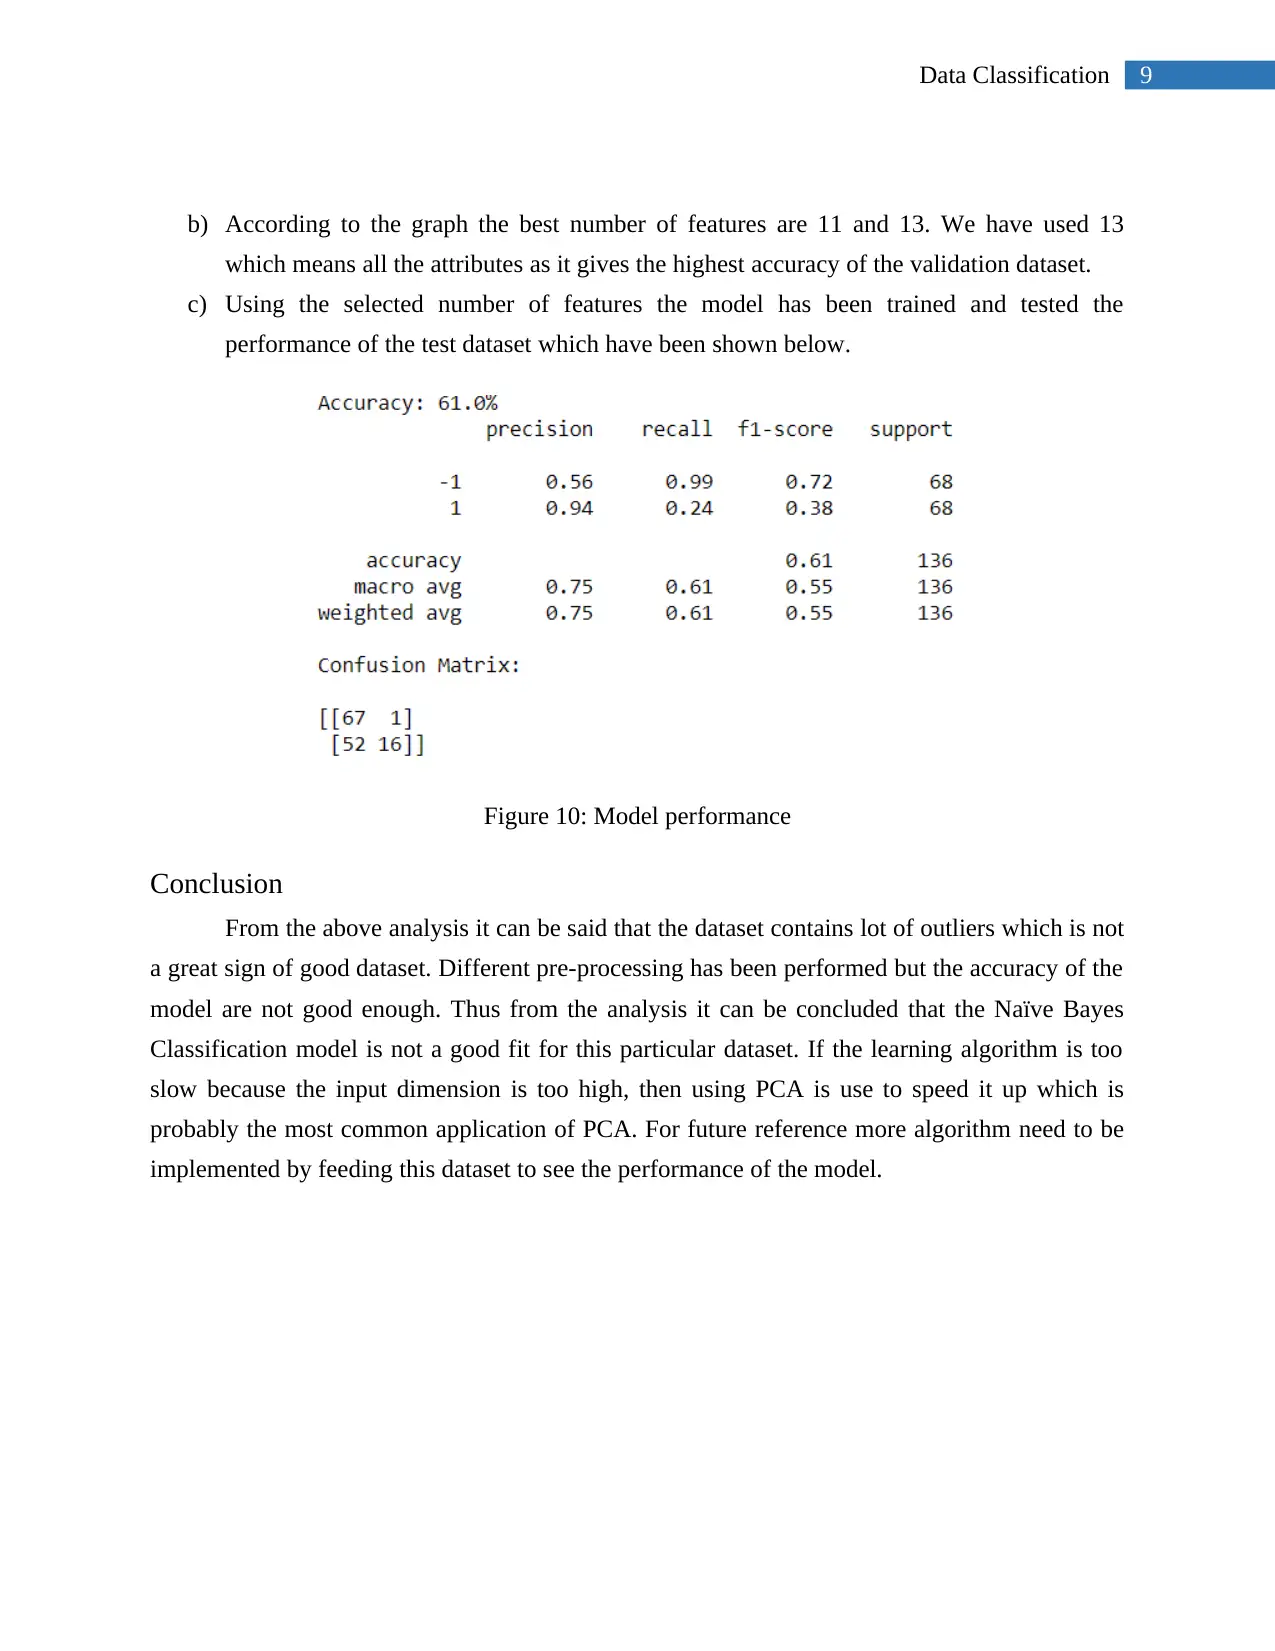
This project focuses on data classification using machine learning techniques to predict software defects. The student utilized a dataset containing static code metrics and employed the Naive Bayes classification model to classify the data. The project involved data exploration, visualization using box plots and scatter plots, and dimensionality reduction using Principal Component Analysis (PCA). The student implemented and evaluated the Naive Bayes classifier, analyzing its performance through accuracy, classification reports, and confusion matrices. Different features were tested to determine the optimal feature set for the model. The conclusion indicates that the Naive Bayes model was not a good fit for this particular dataset. The student suggested exploring other algorithms for future reference. The project follows the guidelines provided by the University of Hertfordshire for the Foundations of Data Science module (7COM1073).
tabler-icon-diamond-filled.svg

Contribute Materials

Your contribution can guide someone’s learning journey. Share your documents today.
Document Page
Running head: DATA CLASSIFICATION
Data Classification
Student Name:
Student ID:
University Name:
Subject Code:
tabler-icon-diamond-filled.svg

Secure Best Marks with AI Grader

Need help grading? Try our AI Grader for instant feedback on your assignments.
Document Page
2Data Classification
Executive Summary
Machine learning is the latest trend in the market which is often term to be as the study which
gives the computer the freedom take decisions and learn without being explicitly programmed or
without any human intervention. In this analysis proper classification algorithm will be used to
classify data, where the dataset for each function contains the static code metrics which generally
consist a software system. The dataset depicts weather software metric is defective or not. Thus
different data analysis with visualization will be performed according to the requirement
followed by a classification model buildup. At the end some conclusion will be concluded
regarding the analysis and the prediction made by the classification model.
Document Page
3Data Classification
Table of Contents
Executive Summary.........................................................................................................................2
Introduction......................................................................................................................................4
Discussion........................................................................................................................................4
Task 1...........................................................................................................................................4
Task 2...........................................................................................................................................5
Task 3...........................................................................................................................................8
Task 4...........................................................................................................................................8
Conclusion.......................................................................................................................................9
Bibliography..................................................................................................................................10
Document Page
4Data Classification
Introduction
Machine learning is the latest trend in the market which is often term to be as the study
which gives the computer the freedom take decisions and learn without being explicitly
programmed or without any human intervention. In this analysis proper classification algorithm
will be used to classify data, where the dataset for each function contains the static code metrics
which generally consist a software system. The dataset depicts weather software metric is
defective or not.
The dataset consist of training and testing data separately. Both these data will be
explores and will be used to find hidden patterns and information out of the dataset. For the
classification model Naïve Bayes Classification model will be implemented to see how well the
model classifies the individual class correctly.
Discussion
Task 1
a) Using pandas package with the help of read_csv function both the dataset have been
loaded into the kernel.
b) For training dataset there are 364 number of data available where for class 1 there are 182
number of patterns and for -1 there are 182 number of patterns and for testing dataset
there are 136 number of data available where for class 1 there are 68 number of patterns
and for -1 there are 68 number of patterns.
c) Box blot have been shown below for the two classes.
Figure 1: Boxplot for the two classes in the training set
tabler-icon-diamond-filled.svg

Secure Best Marks with AI Grader

Need help grading? Try our AI Grader for instant feedback on your assignments.
Document Page
5Data Classification
d) Scatter plot of one feature against another feature have been shown below.
Figure 2: Scatter plot of one feature with another
e) This splitting part has been shown the coding portion.
Task 2
a) Principle Component analysis are used for dimensionality reduction. Basically for large
dataset it becomes difficult to identify the best or suitable component for the analysis thus
PCA is used to speed up a machine learning algorithm. For finding orthogonal dimension
data the PCA is responsible for finding a new set of dimension and according to the
variance it has been ranked. PCA has the ability minimizing information loss. Here PCA
analysis have been performed and it has been found that the variance captured by each
Principals components are:
[7.36900855e-01 7.84966264e-02 6.84054476e-02 3.97040308e-02 3.32871877e-02
1.79152798e-02 1.39358457e-02 5.16537011e-03 2.95944079e-03 2.19399041e-03
8.09787283e-04 1.53774840e-04 7.23634635e-05]
b) The Cumulative scree plot is been shown below. The scree plot is use to visualize the
percentage of variation captured by each of the principal components.
Document Page
6Data Classification
Figure 3: Cumulative scree plot
c) PCA of training and test dataset has been shown below-
d) Two subplots will be plotted in one figure i.e., one for the training data in the PC1 and
PC2 projection space and label the data in the picture according to its class and the other
one for the test data in the same PCA space and label the data in the picture according to
its class which have been shown below.
Figure 4: PC1 and PC2 for training
data
Figure 5: PC1 and PC2 for test data in
the same space
Document Page
7Data Classification
Figure 6: Scatter plot of PC1 and PC2 for training data
Figure 7: Scatter plot of PC1 and PC2 for testing data
tabler-icon-diamond-filled.svg

Paraphrase This Document

Need a fresh take? Get an instant paraphrase of this document with our AI Paraphraser
Document Page
8Data Classification
Task 3
In general classifier are some machine learning model which are been used widely for
discrimination of different object based on certain features. Naive Bayes classifiers is one of the
popular used machine learning classifier in classification problem which totally is based on
Bayes’ Theorem. Also it is sometime said that it is a probabilistic machine learning model. It is
not a single algorithm but a family of algorithms where all of them share a common principle.
According to the used, the accuracy, classification report and the confusion matrix has
been shared below.
Figure 8: Performance of Naive Bayes classification model
Task 4
a) Using the training set (II) and the validation set 13 different Naïve Bayes Classification
models were built with 13 different features of the dataset. The accuracy of the training
set (II) and the accuracy of the validation set have been measured and is shown below in
graphical manner.
Figure 9: Accuracy vs. Feature graph
Document Page
9Data Classification
b) According to the graph the best number of features are 11 and 13. We have used 13
which means all the attributes as it gives the highest accuracy of the validation dataset.
c) Using the selected number of features the model has been trained and tested the
performance of the test dataset which have been shown below.
Figure 10: Model performance
Conclusion
From the above analysis it can be said that the dataset contains lot of outliers which is not
a great sign of good dataset. Different pre-processing has been performed but the accuracy of the
model are not good enough. Thus from the analysis it can be concluded that the Naïve Bayes
Classification model is not a good fit for this particular dataset. If the learning algorithm is too
slow because the input dimension is too high, then using PCA is use to speed it up which is
probably the most common application of PCA. For future reference more algorithm need to be
implemented by feeding this dataset to see the performance of the model.
Document Page
10Data Classification
Bibliography
Kotsiantis, S. B., Zaharakis, I., & Pintelas, P. (2007). Supervised machine learning: A review of
classification techniques. Emerging artificial intelligence applications in computer
engineering, 160, 3-24.
Lewis, D. D. (1998, April). Naive (Bayes) at forty: The independence assumption in information
retrieval. In European conference on machine learning (pp. 4-15). Springer, Berlin,
Heidelberg.
Müller, A. C., & Guido, S. (2016). Introduction to machine learning with Python: a guide for
data scientists. " O'Reilly Media, Inc.".
Pedregosa, F., Varoquaux, G., Gramfort, A., Michel, V., Thirion, B., Grisel, O., ... & Vanderplas,
J. (2011). Scikit-learn: Machine learning in Python. Journal of machine learning research,
12(Oct), 2825-2830.
Rish, I. (2001, August). An empirical study of the naive Bayes classifier. In IJCAI 2001
workshop on empirical methods in artificial intelligence (Vol. 3, No. 22, pp. 41-46).
Ruggieri, S. (2002). Efficient C4. 5 [classification algorithm]. IEEE transactions on knowledge
and data engineering, 14(2), 438-444.
chevron_up_icon
1 out of 10
circle_padding
hide_on_mobile
zoom_out_icon
logo.png

Your All-in-One AI-Powered Toolkit for Academic Success.

Available 24*7 on WhatsApp / Email

[object Object]