Report on Foundations of Epidemiology: Stress Level Analysis

Verified

Added on  2023/06/15

|47
|2773
|151
Report
AI Summary
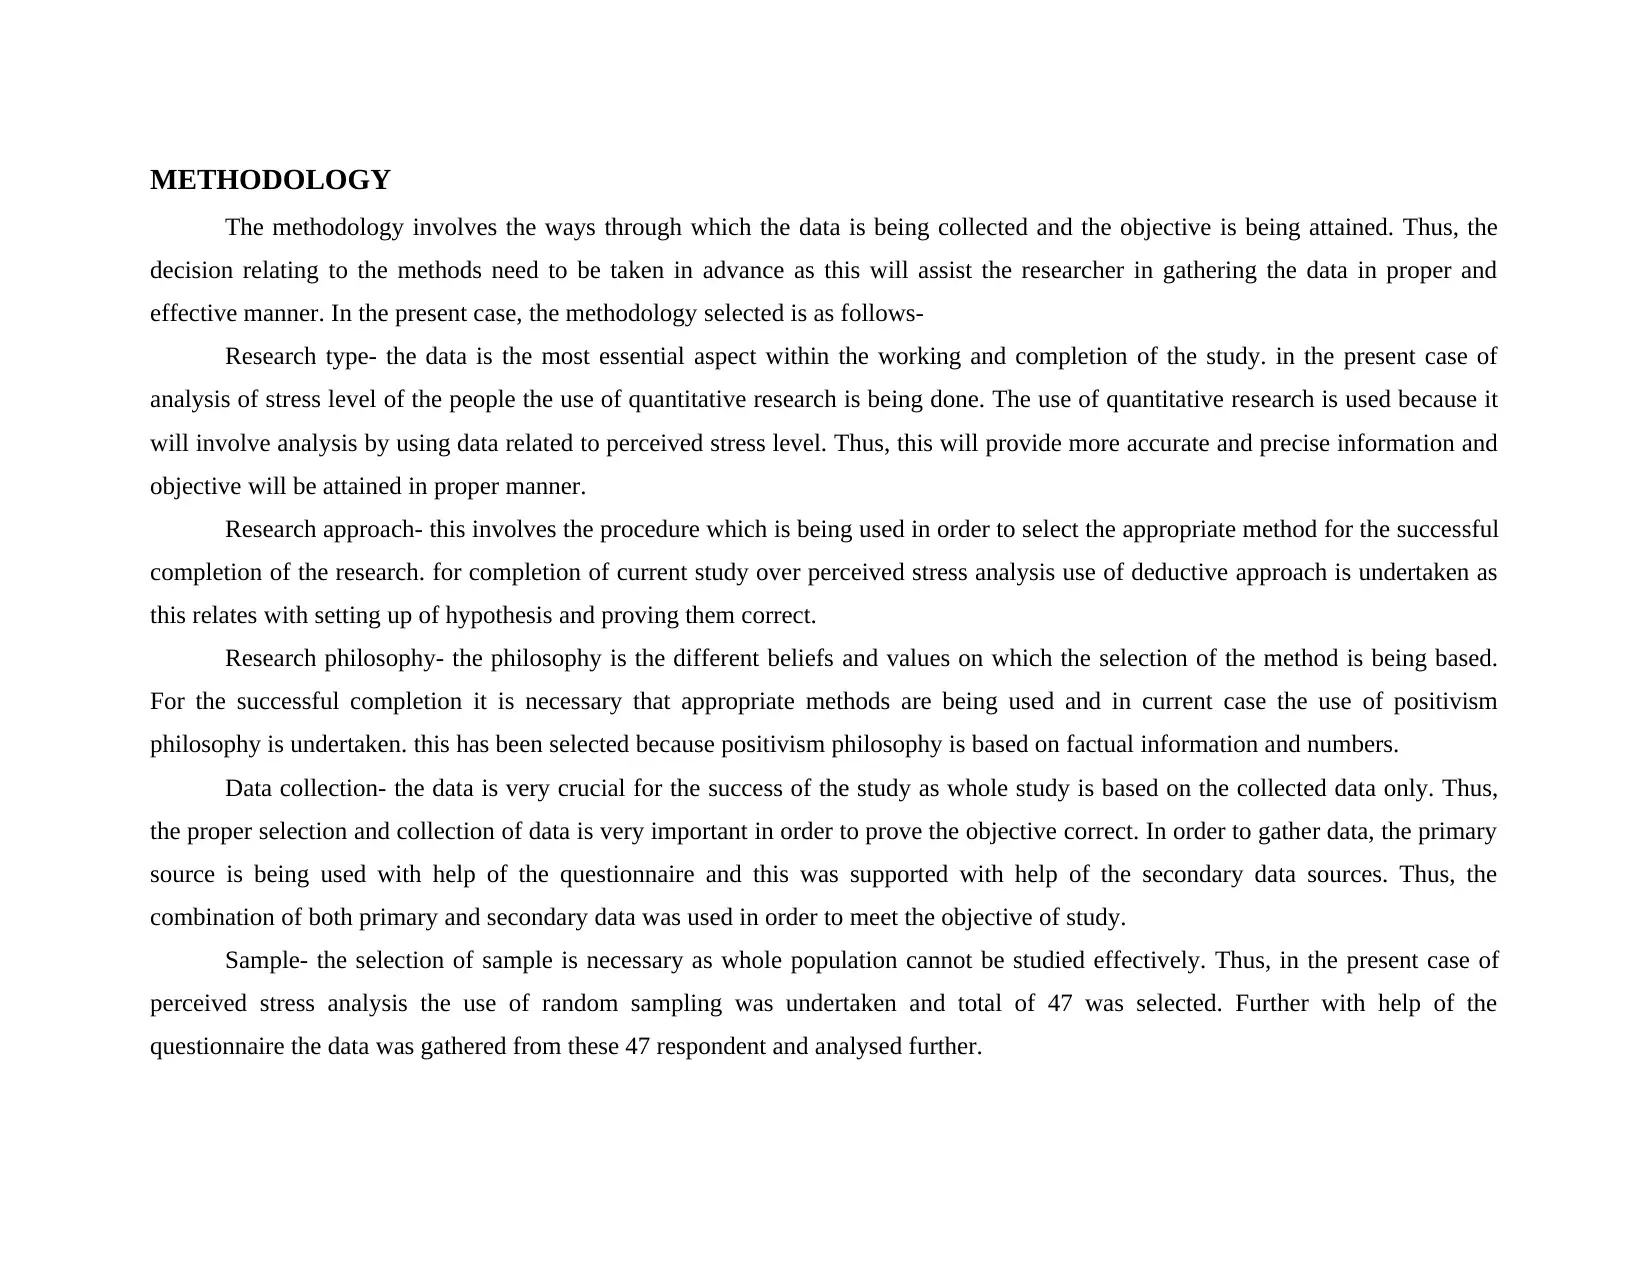
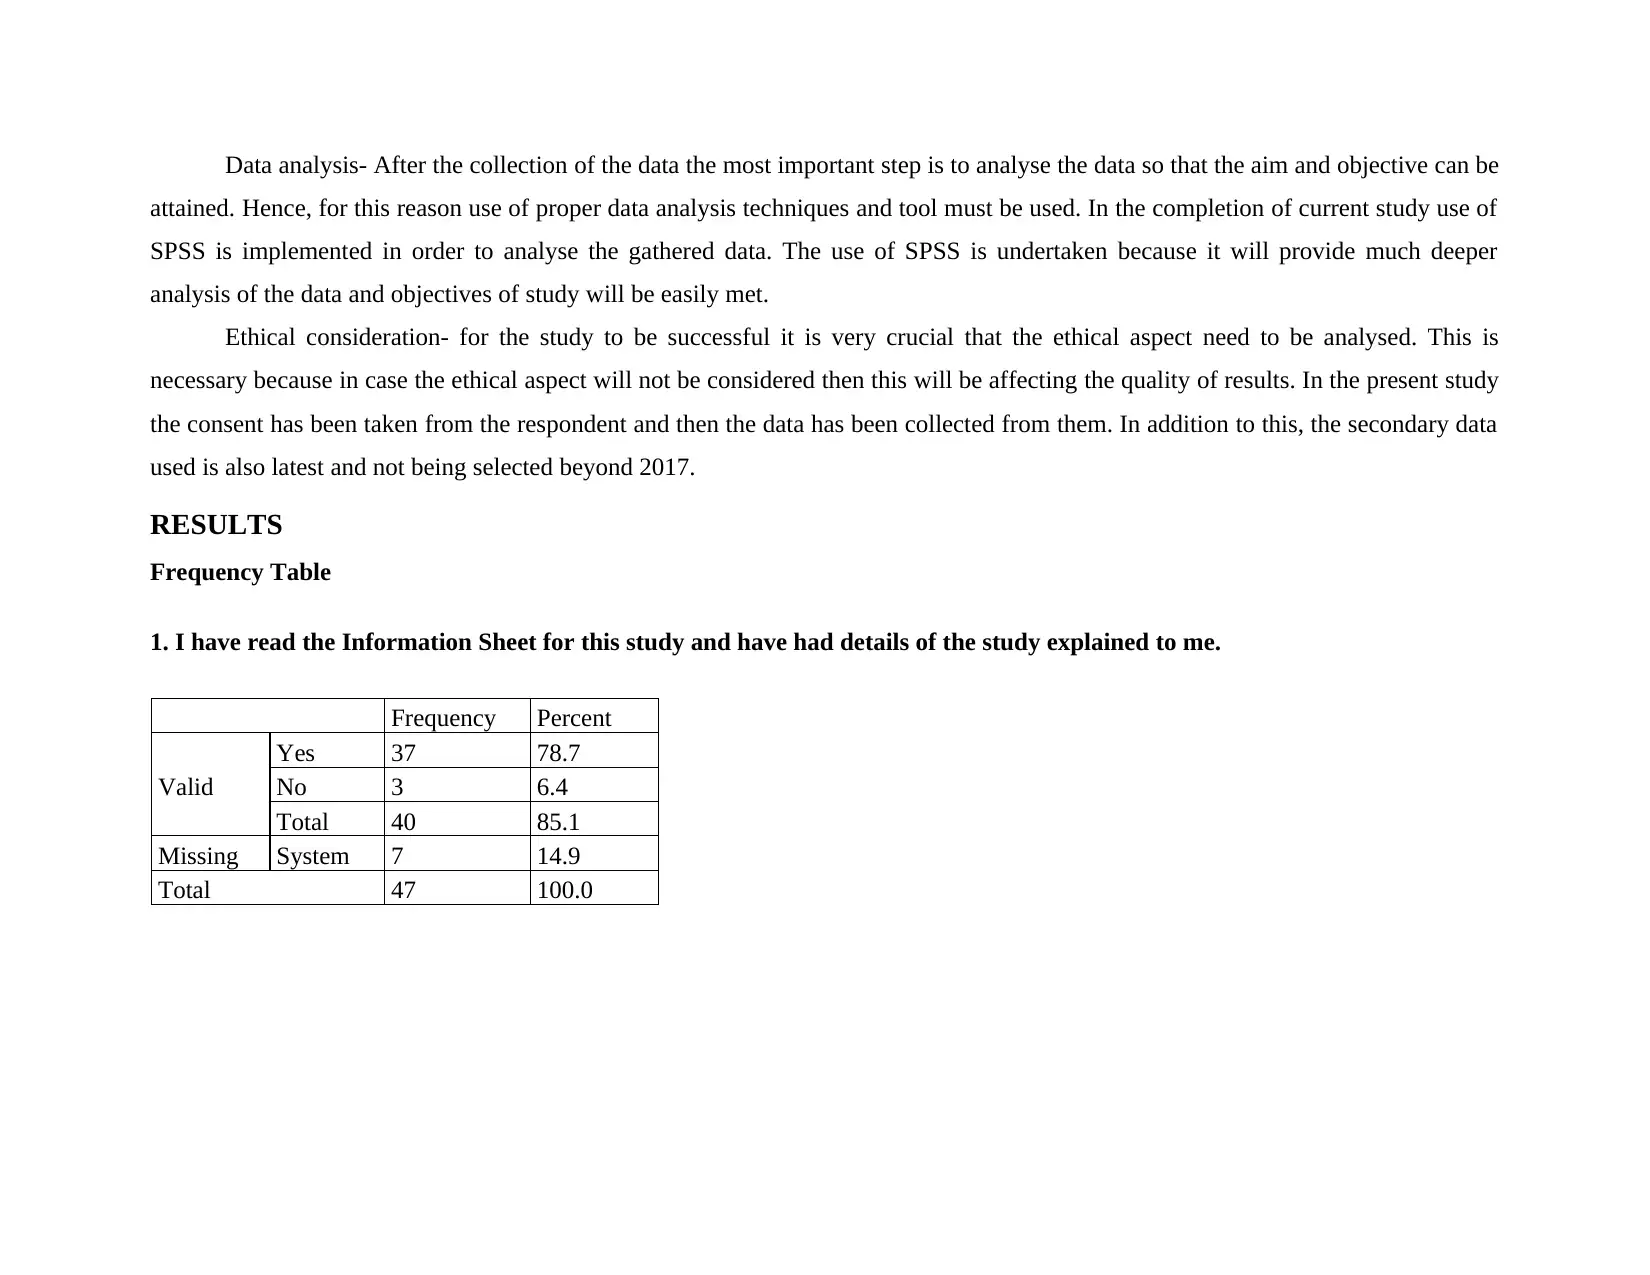
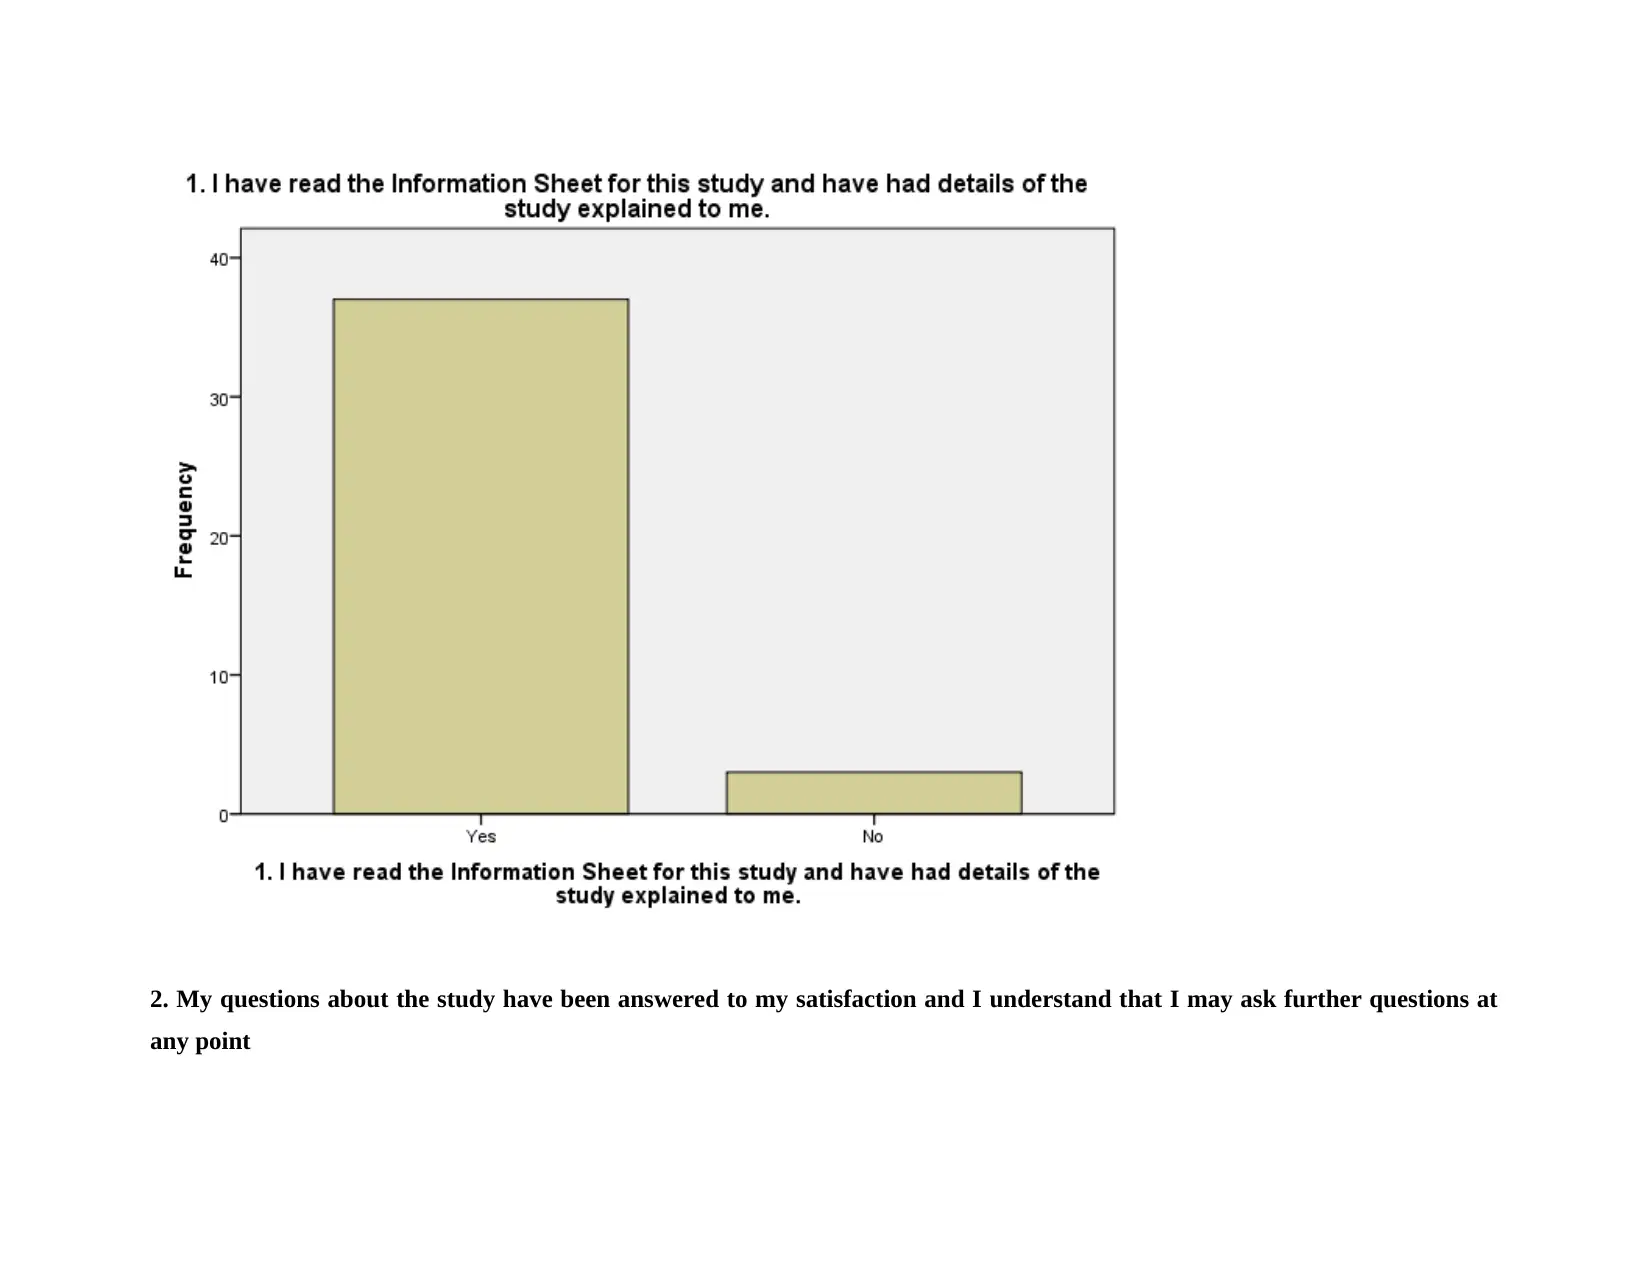
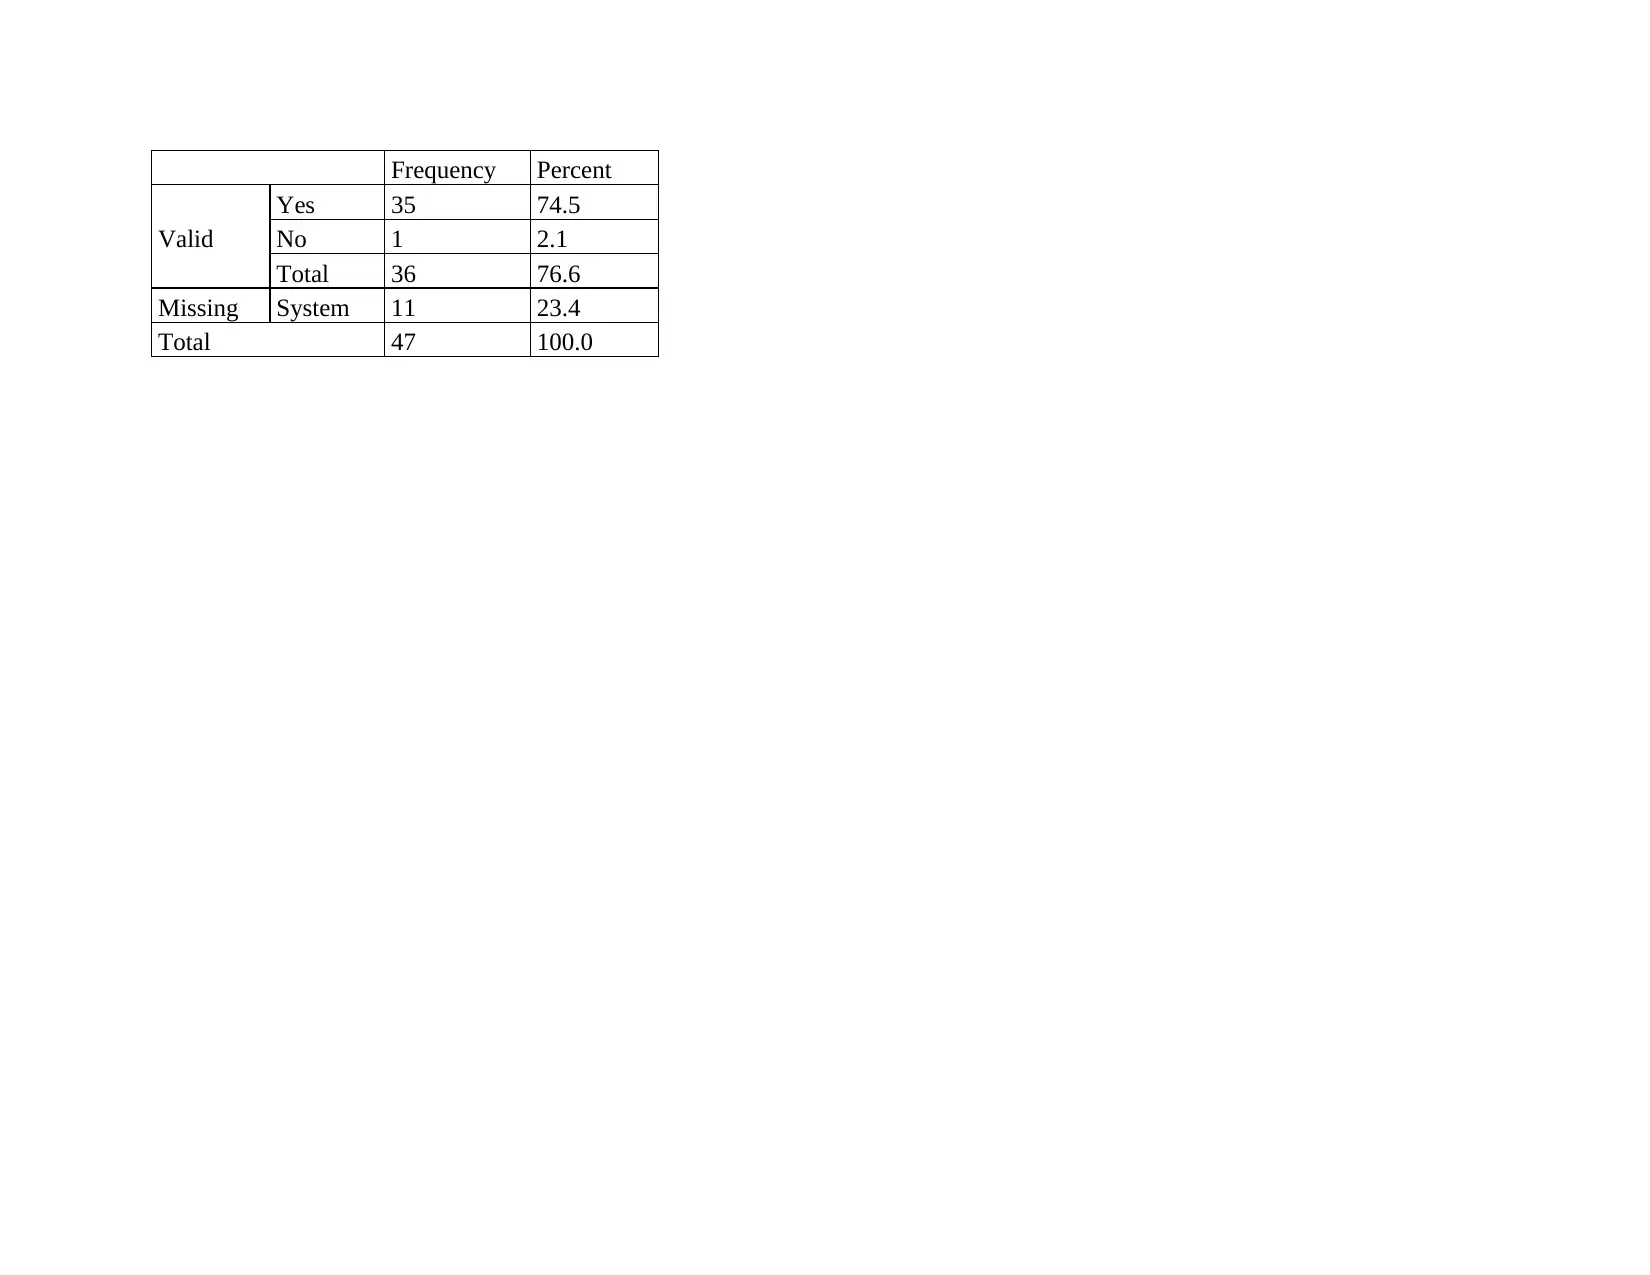
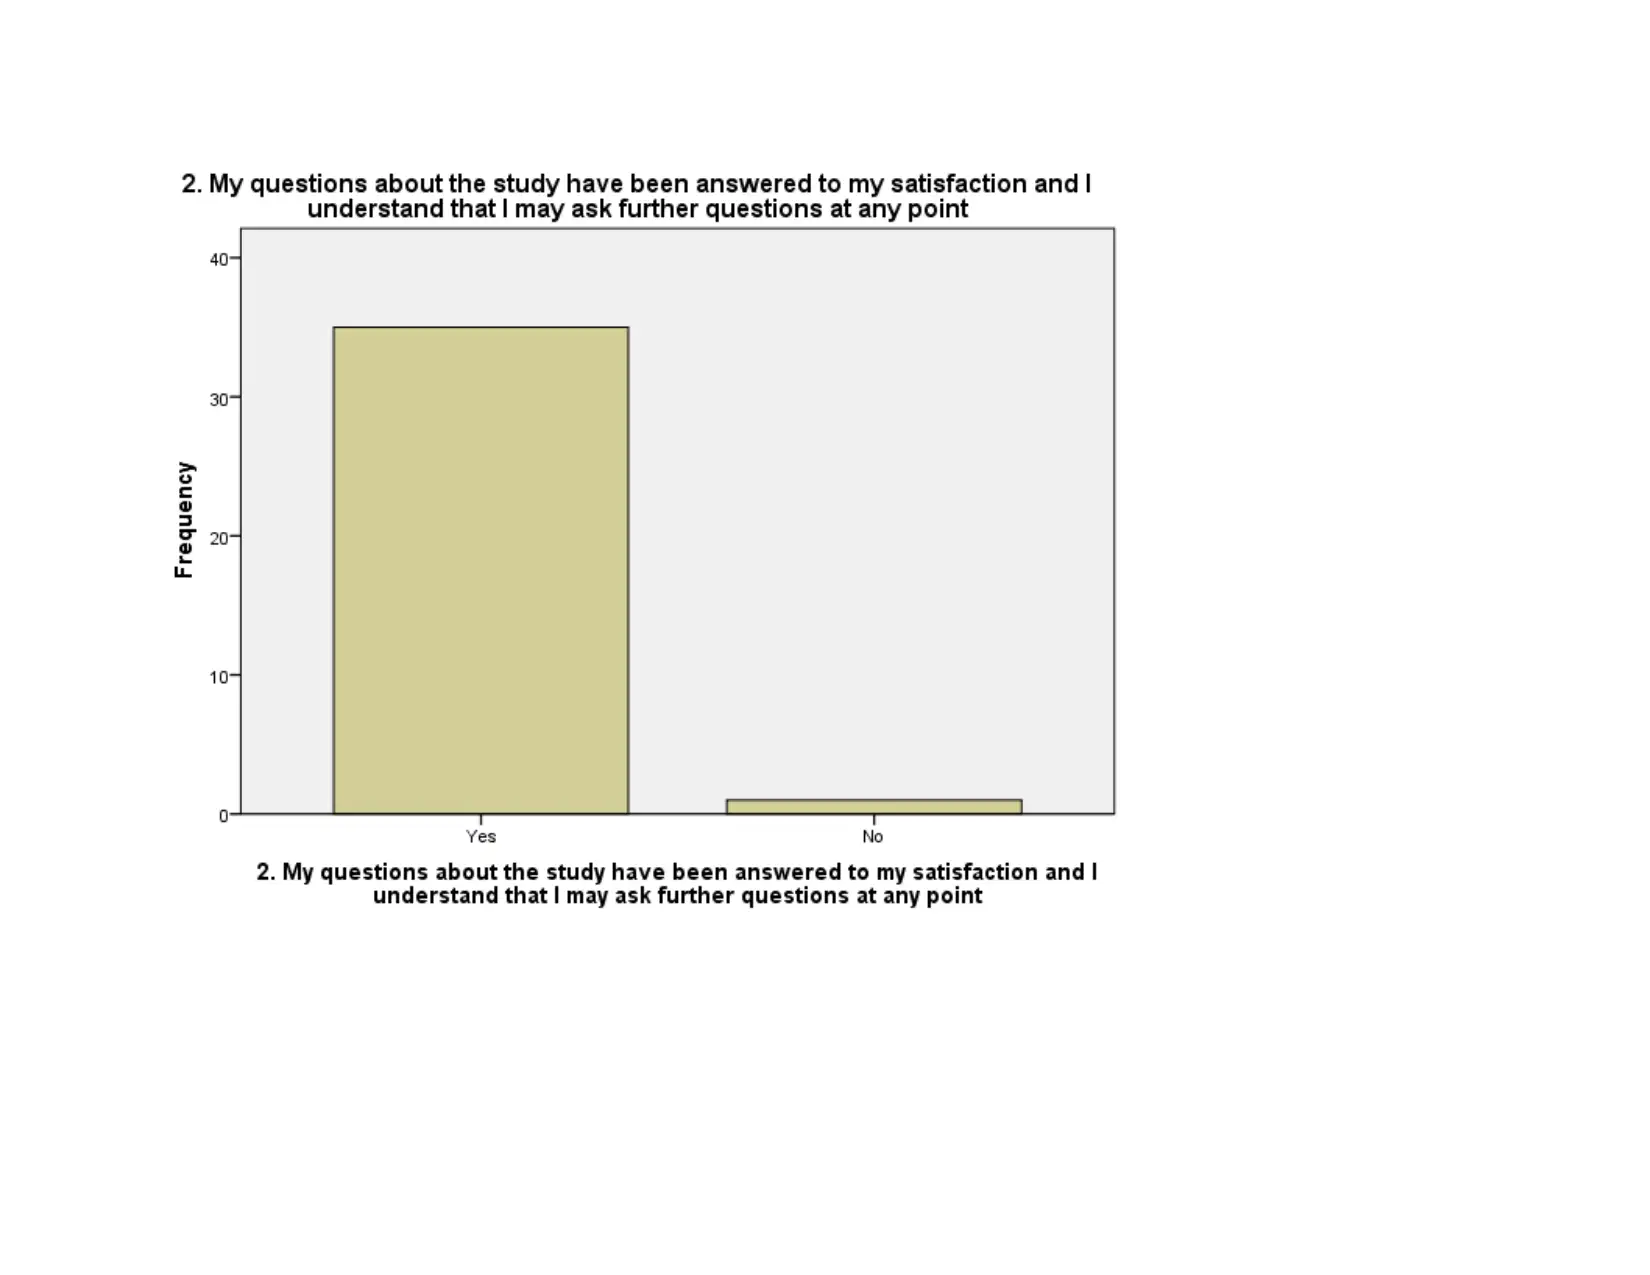
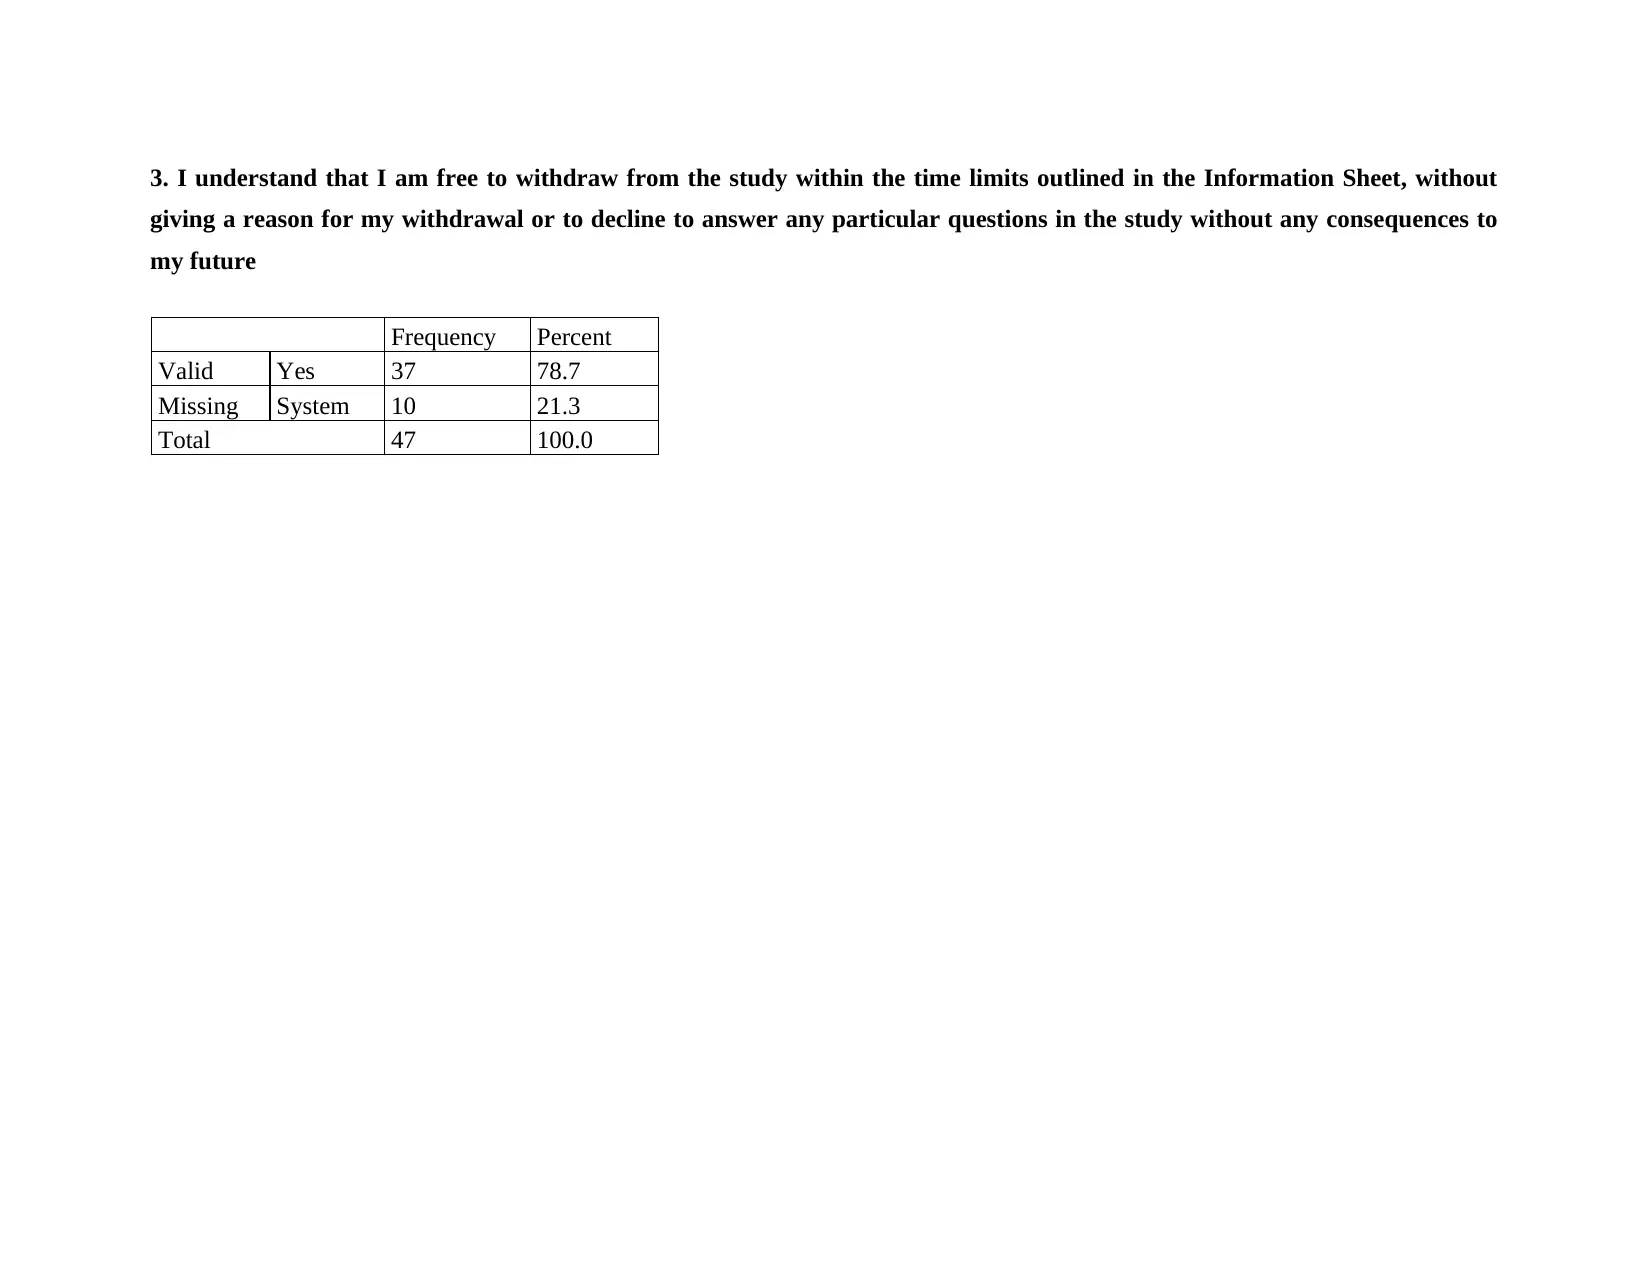
This report provides a comprehensive analysis of stress levels using the foundations of epidemiology. The methodology section details the research type (quantitative), approach (deductive), and philosophy (positivism) employed. Data collection involved both primary (questionnaires from 47 respondents using random sampling) and secondary sources, analyzed using SPSS. Ethical considerations, including informed consent, were prioritized. The results section presents frequency tables, analyzing participant demographics (age, gender, job status, ethnicity, sexual orientation, marital status) and responses to questions about stress experiences in the last month, such as feelings of being upset, inability to control important things, nervousness, confidence in handling problems, and ability to cope with tasks and irritations. The findings are supported by references to relevant research, highlighting the relationship between unexpected events, external control, and perceived stress levels.
Document Page
Foundations of Epidemiology B
tabler-icon-diamond-filled.svg

Secure Best Marks with AI Grader

Need help grading? Try our AI Grader for instant feedback on your assignments.
Document Page
TABLE OF CONTENTS
METHODOLOGY..........................................................................................................................3
RESULTS........................................................................................................................................4
REFERENCES..............................................................................................................................47
Document Page
METHODOLOGY
The methodology involves the ways through which the data is being collected and the objective is being attained. Thus, the
decision relating to the methods need to be taken in advance as this will assist the researcher in gathering the data in proper and
effective manner. In the present case, the methodology selected is as follows-
Research type- the data is the most essential aspect within the working and completion of the study. in the present case of
analysis of stress level of the people the use of quantitative research is being done. The use of quantitative research is used because it
will involve analysis by using data related to perceived stress level. Thus, this will provide more accurate and precise information and
objective will be attained in proper manner.
Research approach- this involves the procedure which is being used in order to select the appropriate method for the successful
completion of the research. for completion of current study over perceived stress analysis use of deductive approach is undertaken as
this relates with setting up of hypothesis and proving them correct.
Research philosophy- the philosophy is the different beliefs and values on which the selection of the method is being based.
For the successful completion it is necessary that appropriate methods are being used and in current case the use of positivism
philosophy is undertaken. this has been selected because positivism philosophy is based on factual information and numbers.
Data collection- the data is very crucial for the success of the study as whole study is based on the collected data only. Thus,
the proper selection and collection of data is very important in order to prove the objective correct. In order to gather data, the primary
source is being used with help of the questionnaire and this was supported with help of the secondary data sources. Thus, the
combination of both primary and secondary data was used in order to meet the objective of study.
Sample- the selection of sample is necessary as whole population cannot be studied effectively. Thus, in the present case of
perceived stress analysis the use of random sampling was undertaken and total of 47 was selected. Further with help of the
questionnaire the data was gathered from these 47 respondent and analysed further.
Document Page
Data analysis- After the collection of the data the most important step is to analyse the data so that the aim and objective can be
attained. Hence, for this reason use of proper data analysis techniques and tool must be used. In the completion of current study use of
SPSS is implemented in order to analyse the gathered data. The use of SPSS is undertaken because it will provide much deeper
analysis of the data and objectives of study will be easily met.
Ethical consideration- for the study to be successful it is very crucial that the ethical aspect need to be analysed. This is
necessary because in case the ethical aspect will not be considered then this will be affecting the quality of results. In the present study
the consent has been taken from the respondent and then the data has been collected from them. In addition to this, the secondary data
used is also latest and not being selected beyond 2017.
RESULTS
Frequency Table
1. I have read the Information Sheet for this study and have had details of the study explained to me.
Frequency Percent
Valid
Yes 37 78.7
No 3 6.4
Total 40 85.1
Missing System 7 14.9
Total 47 100.0
tabler-icon-diamond-filled.svg

Secure Best Marks with AI Grader

Need help grading? Try our AI Grader for instant feedback on your assignments.
Document Page
2. My questions about the study have been answered to my satisfaction and I understand that I may ask further questions at
any point
Document Page
Frequency Percent
Valid
Yes 35 74.5
No 1 2.1
Total 36 76.6
Missing System 11 23.4
Total 47 100.0
Document Page
tabler-icon-diamond-filled.svg

Paraphrase This Document

Need a fresh take? Get an instant paraphrase of this document with our AI Paraphraser
Document Page
3. I understand that I am free to withdraw from the study within the time limits outlined in the Information Sheet, without
giving a reason for my withdrawal or to decline to answer any particular questions in the study without any consequences to
my future
Frequency Percent
Valid Yes 37 78.7
Missing System 10 21.3
Total 47 100.0
Document Page
4. I agree to provide information to the researchers under the conditions of confidentiality set out in the Information Sheet
Document Page
Frequency Percent
Valid Yes 35 74.5
Missing System 12 25.5
Total 47 100.0
tabler-icon-diamond-filled.svg

Secure Best Marks with AI Grader

Need help grading? Try our AI Grader for instant feedback on your assignments.
Document Page
5. I wish to participate in the study under the conditions set out in the Information Sheet.
Frequency Percent
Valid Yes 35 74.5
Missing System 12 25.5
Total 47 100.0
Document Page
what is your age bracket?
Document Page
Frequency Percent
Valid
18-25 7 14.9
26-35 26 55.3
36-40 2 4.3
Total 35 74.5
Missing System 12 25.5
Total 47 100.0
tabler-icon-diamond-filled.svg

Paraphrase This Document

Need a fresh take? Get an instant paraphrase of this document with our AI Paraphraser
Document Page
With the analysis it is clear that the majority of the participant belongs to the age group of 26- 35. This may be because of the reason
that majority of the stress is being faced by people belonging to this age group.
what is your gender?
Document Page
Frequency Percent
Valid
Female 21 44.7
Male 14 29.8
Total 35 74.5
Missing System 12 25.5
Total 47 100.0
Document Page
By the evaluation of the data it is clear that the majority of the participant involved is the female as compared to the male.
what is your current job status?
tabler-icon-diamond-filled.svg

Secure Best Marks with AI Grader

Need help grading? Try our AI Grader for instant feedback on your assignments.
Document Page
Frequency Percent
Valid
Employed 11 23.4
Self employed 11 23.4
Unemployed 11 23.4
Retired 1 2.1
Total 34 72.3
Missing System 13 27.7
Total 47 100.0
Document Page
With the evaluation of the data and graph it is clear that there is equal distribution within employed, self-employed and unemployed.
However, remaining people are retired.
what is your Ethnicity group?
Frequency Percent
Valid African 28 59.6
Document Page
Asian 6 12.8
Total 34 72.3
Missing System 13 27.7
Total 47 100.0
With respect to the ethnicity group majority of the people belong to African group and remaining belongs to Asian group.
tabler-icon-diamond-filled.svg

Paraphrase This Document

Need a fresh take? Get an instant paraphrase of this document with our AI Paraphraser
Document Page
what is your sexual orientation?
Frequency Percent
Valid
Heterosexual or Straight 28 59.6
Homosexual 2 4.3
Bisexual 2 4.3
Prefer not to say 3 6.4
Total 35 74.5
Missing System 12 25.5
Total 47 100.0
Document Page
Further on the basis of the sexual orientation the people belongs to heterosexual or straight category and some preferred not to say
anything. Moreover, some of the respondent were homosexual and some belonged to bisexual.
what is your marital status?
Document Page
Frequency Percent
Valid
Engaged 4 8.5
Married 9 19.1
Single 20 42.6
Divorced 1 2.1
Co-habiting 1 2.1
Total 35 74.5
Missing System 12 25.5
Total 47 100.0
tabler-icon-diamond-filled.svg

Secure Best Marks with AI Grader

Need help grading? Try our AI Grader for instant feedback on your assignments.
Document Page
With regards to the marital status the maximum of the respondent was single and after that they were married. Further some of the
respondent were engaged and some divorced and co- habituating.
1. In the last month, how often have you been upset because of something that happened unexpectedly
Document Page
Frequency Percent
Valid
Never 3 6.4
Almost never 9 19.1
Often 11 23.4
Fairly often 10 21.3
Very often 1 2.1
Total 34 72.3
Missing System 13 27.7
Total 47 100.0
Document Page
With the analysis of the data it is clear that when the people were asked that how often they have become upset due to something
unexpected working it was seen that majority stated that they often become upset. This is particularly because of the reason that in
case anything unexpected occurs then they might become upset. In support of this Liu and et.al., (2021) states that when anything bad
tabler-icon-diamond-filled.svg

Paraphrase This Document

Need a fresh take? Get an instant paraphrase of this document with our AI Paraphraser
Document Page
happens which the person has not though and it occurs then this disappoint the person. Hence, as a result of this, stress occurs because
something bad has happened with the person.
2. In the last month, how often have you felt that you were unable to control the important things in your life?
Frequency Percent
Valid
Never 4 8.5
Almost never 11 23.4
Often 12 25.5
Fairly often 6 12.8
Very often 2 4.3
Total 35 74.5
Missing System 12 25.5
Total 47 100.0
Document Page
By referring to the above data it is clear that then people are not able to control the important thing I life then they often feel
bad. This is particularly because of the reason that they can see that something bad is happening but they cannot do anything in control
of that.
Document Page
3. In the last month, how often have you felt nervous and stressed?
Frequency Percent
Valid
Never 3 6.4
Almost never 4 8.5
Often 13 27.7
Fairly often 7 14.9
Very often 8 17.0
Total 35 74.5
Missing System 12 25.5
Total 47 100.0
tabler-icon-diamond-filled.svg

Secure Best Marks with AI Grader

Need help grading? Try our AI Grader for instant feedback on your assignments.
Document Page
When the respondent was asked that how often they felt stressed or nervous then majority of them stated that often they became
stressed due to external changes and other things. As per the views of Flesia and et.al., (2020) this is because of the reason that people
cannot control the external working and because of this they feel more stressed and nervous.
Document Page
4. In the last month, how often have you felt confident about your ability to handle your personal problems?
Frequency Percent
Valid
Never 2 4.3
Almost never 4 8.5
Often 4 8.5
Fairly often 12 25.5
Very often 13 27.7
Total 35 74.5
Missing System 12 25.5
Total 47 100.0
Document Page
At time when respondent was asked that whether they felt confident about the ability to handle the personal problem or not. The
response stated that very often the people felt confident that they can handle the personal problem in better manner.
5. In the last month, how often have you felt that things were going your way?
tabler-icon-diamond-filled.svg

Paraphrase This Document

Need a fresh take? Get an instant paraphrase of this document with our AI Paraphraser
Document Page
Frequency Percent
Valid
Never 2 4.3
Almost never 4 8.5
Often 10 21.3
Fairly often 13 27.7
Very often 6 12.8
Total 35 74.5
Missing System 12 25.5
Total 47 100.0
Document Page
With the gathered data it is clear that majority of the people stated that fairly often they felt that things were going their way. This is
particularly because of the reason that people were confident that they will handle their situation. Hence, they felt less often that things
are going away from their way.
6. In the last month, how often have you found that you could not cope with all the things that you had to do?
Document Page
Frequency Percent
Valid
Never 4 8.5
Almost never 9 19.1
Often 6 12.8
Fairly often 13 27.7
Very often 3 6.4
Total 35 74.5
Missing System 12 25.5
Total 47 100.0
tabler-icon-diamond-filled.svg

Secure Best Marks with AI Grader

Need help grading? Try our AI Grader for instant feedback on your assignments.
Document Page
By evaluating the data gathered it is clear that maximum of the respondent stated that fairly often they found that they could not cope
with the things that had to do. This is particularly because of the reason that in the present case people were feeling often that things
are going away from their hands.
Document Page
7. In the last month, how often have you been able to control irritations in your life?
Frequency Percent
Valid
Never 4 8.5
Almost never 4 8.5
Often 16 34.0
Fairly often 7 14.9
Very often 4 8.5
Total 35 74.5
Missing System 12 25.5
Total 47 100.0
Document Page
Within the last month, majority of the respondent have felt that often many a times they have felt that frequently people have felt
control irritations within the life. In support of this Zhao and et.al., (2021) states that this is particularly because of the reason that
many a times people are not having any control over the external working and because of this, they are having control irritation.
tabler-icon-diamond-filled.svg

Paraphrase This Document

Need a fresh take? Get an instant paraphrase of this document with our AI Paraphraser
Document Page
8. In the last month, how often have you felt that you were on top of things?
Frequency Percent
Valid
Never 2 4.3
Almost never 6 12.8
Often 12 25.5
Fairly often 11 23.4
Very often 4 8.5
Total 35 74.5
Missing System 12 25.5
Total 47 100.0
Document Page
With the analysis it is clear that when asked that how often people felt that they were on top of things, it was seen that often was the
answer of maximum people. This might be because of the reason that many a times people can handle the situation confidently and
due to this, they are on top of the things.
Document Page
9. In the last month how often have you been angered because of things that happened that were outside of your control?
Frequency Percent
Valid
Never 1 2.1
Almost never 8 17.0
Often 11 23.4
Fairly often 10 21.3
Very often 5 10.6
Total 35 74.5
Missing System 12 25.5
Total 47 100.0
tabler-icon-diamond-filled.svg

Secure Best Marks with AI Grader

Need help grading? Try our AI Grader for instant feedback on your assignments.
Document Page
By evaluating the gathered data, it is clear that often people felt angered due to the fact that things were outside their control. this is
particularly because of the reason that many a times some external change can affect the working of the person to a great extent and
they cannot do anything.
Document Page
10. In the last month, how often have you felt difficulties were pulling up so high that you could not overcome them?
Frequency Percent
Valid
Never 6 12.8
Almost never 10 21.3
Often 8 17.0
Fairly often 8 17.0
Very often 3 6.4
Total 35 74.5
Missing System 12 25.5
Total 47 100.0
Document Page
By evaluating the gathered data, it is clear that the people when people were asked that how difficult it was for them to pulling the
things which could not be overcome they agreed to almost never. This simply implies that people were in position to face any
difficulty in better and effective manner.
Regression
tabler-icon-diamond-filled.svg

Paraphrase This Document

Need a fresh take? Get an instant paraphrase of this document with our AI Paraphraser
Document Page
Model Summary
Model R R Square Adjusted R
Square
Std. Error of
the Estimate
1 .495a .245 .222 1.071
a. Predictors: (Constant), For each question choose from the
following alternatives: - 4. In the last month, how often
have you felt confident about your ability to handle your
personal problems?
ANOVAa
Model Sum of
Squares
df Mean Square F Sig.
1
Regression 12.287 1 12.287 10.703 .003b
Residual 37.884 33 1.148
Total 50.171 34
a. Dependent Variable: For each question choose from the following alternatives:
- 3. In the last month, how often have you felt nervous and stressed?
b. Predictors: (Constant), For each question choose from the following
alternatives: - 4. In the last month, how often have you felt confident about your
ability to handle your personal problems?
Document Page
Coefficientsa
Model Unstandardized
Coefficients
Standardized
Coefficients
t Sig.
B Std. Error Beta
1
(Constant) .959 .468 2.049 .049
For each question choose
from the following
alternatives: - 4. In the
last month, how often
have you felt confident
about your ability to
handle your personal
problems?
.494 .151 .495 3.272 .003
a. Dependent Variable: For each question choose from the following alternatives: - 3. In the last
month, how often have you felt nervous and stressed?
With the regression analysis it is clear that there is relation between feeling nervous and being confident to handle the personal
problem. With the significance value it is evident that it is 0.003 which is less than standard that is 0.05. Hence, it can be implied that
in case the person is less confident then they will be more stressed and nervous.
Document Page
tabler-icon-diamond-filled.svg

Secure Best Marks with AI Grader

Need help grading? Try our AI Grader for instant feedback on your assignments.
Document Page
REFERENCES
Books and Journals
Liu, S., and et.al., 2021. Personality and perceived stress during COVID-19 pandemic: Testing the mediating role of perceived threat
and efficacy. Personality and Individual differences. 168. p.110351.
Flesia, L., and et.al., 2020. Predicting perceived stress related to the Covid-19 outbreak through stable psychological traits and
machine learning models. Journal of clinical medicine. 9(10). p.3350.
Zhao, X., and et.al., 2021. Perceived stress and sleep quality among the non-diseased general public in China during the 2019
coronavirus disease: a moderated mediation model. Sleep medicine. 77. pp.339-345.
chevron_up_icon
1 out of 47
circle_padding
hide_on_mobile
zoom_out_icon
logo.png

Your All-in-One AI-Powered Toolkit for Academic Success.

Available 24*7 on WhatsApp / Email

[object Object]