Framingham Heart Study: Linear Regression Modeling of Patient BMI

Verified

Added on  2022/10/15

|10
|1454
|263
Report
AI Summary
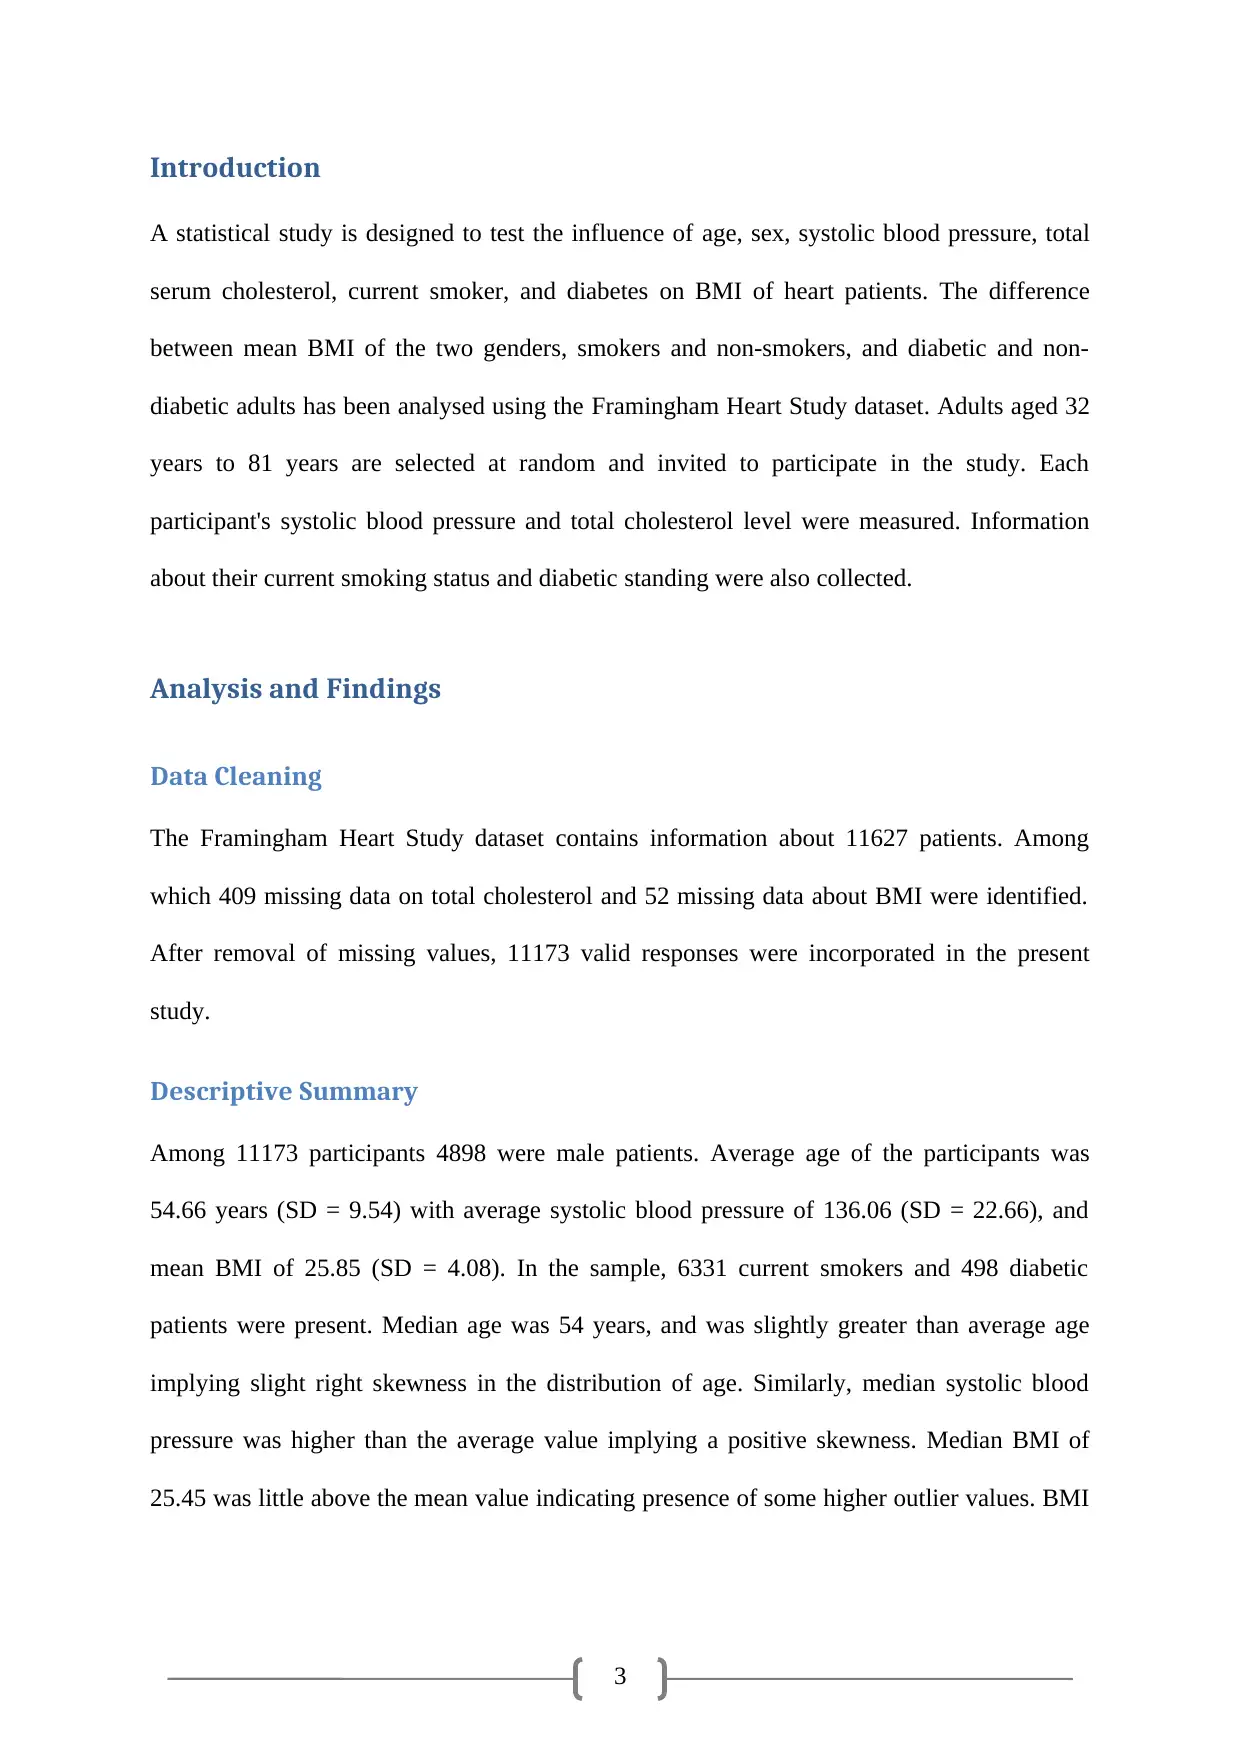
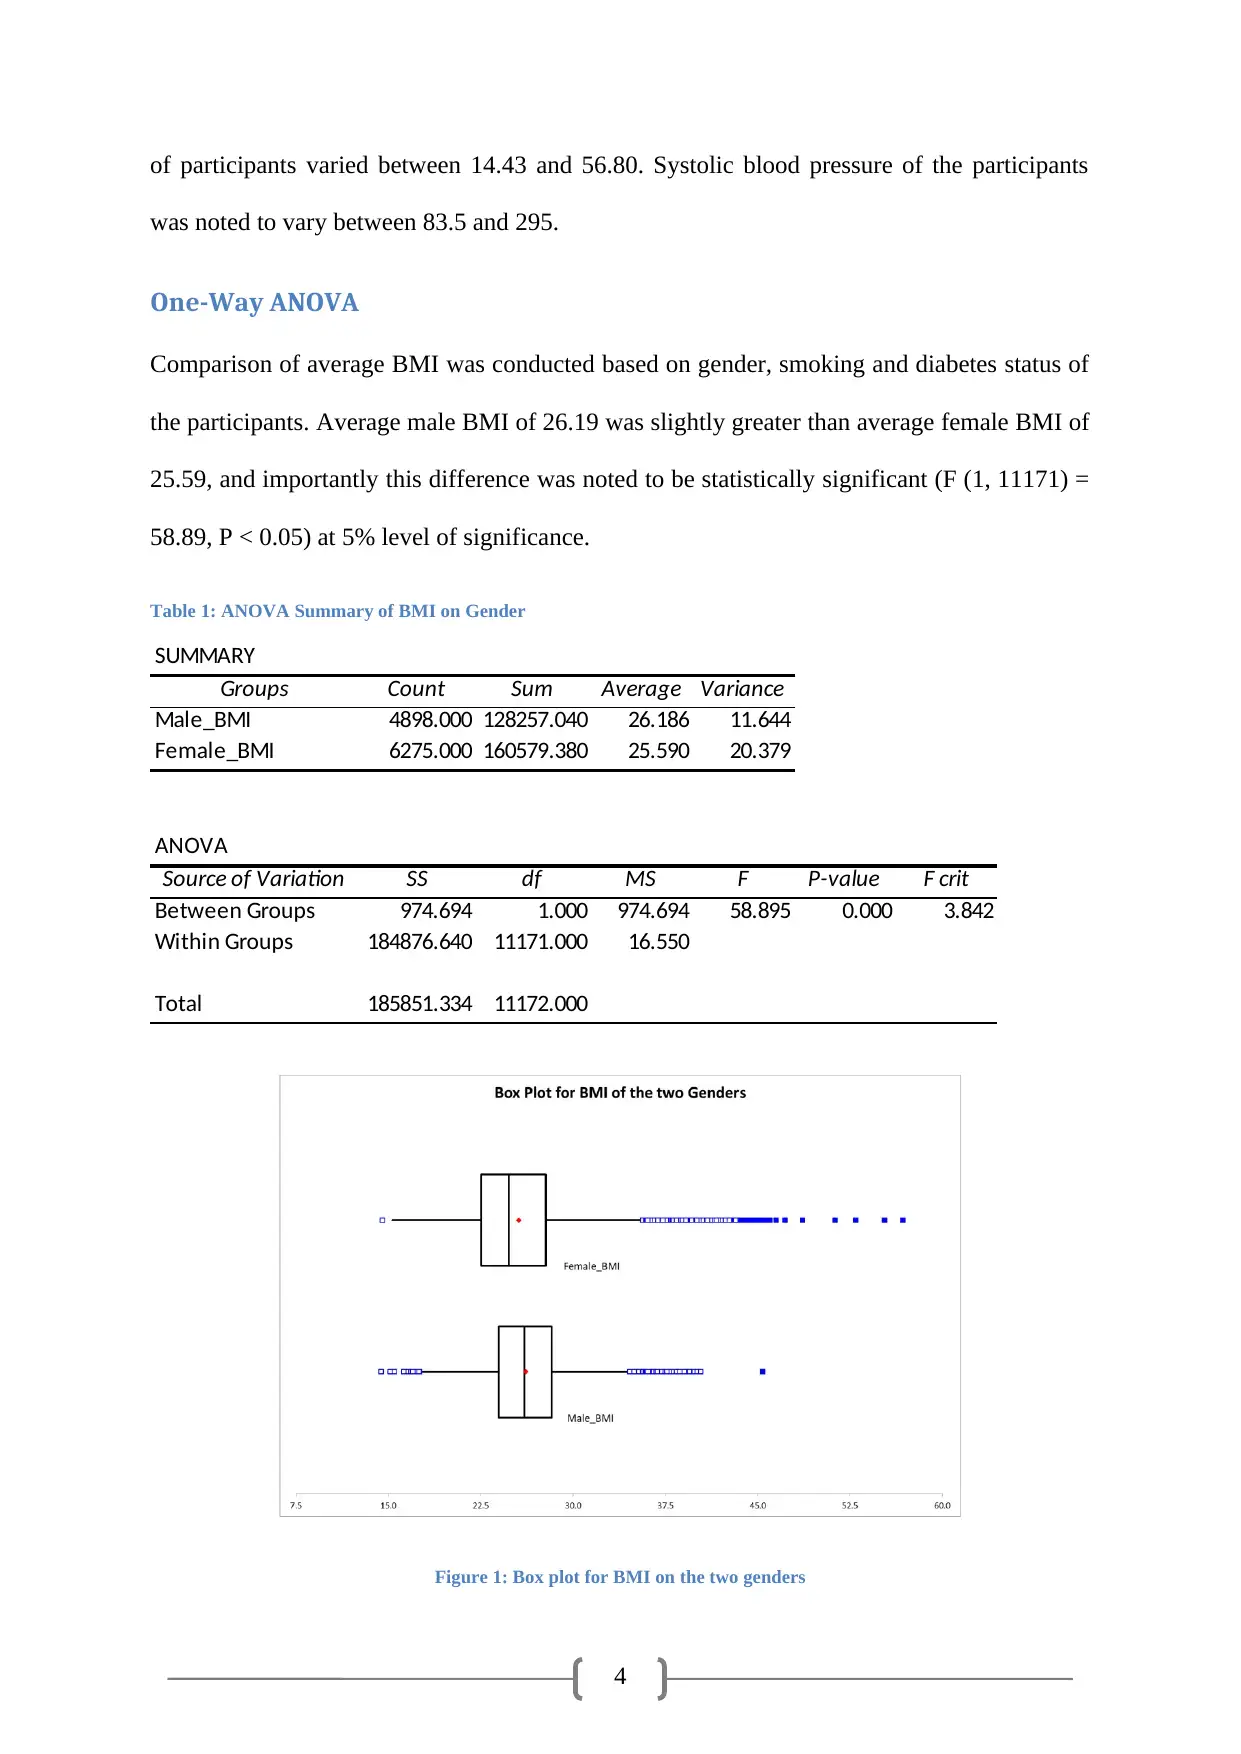
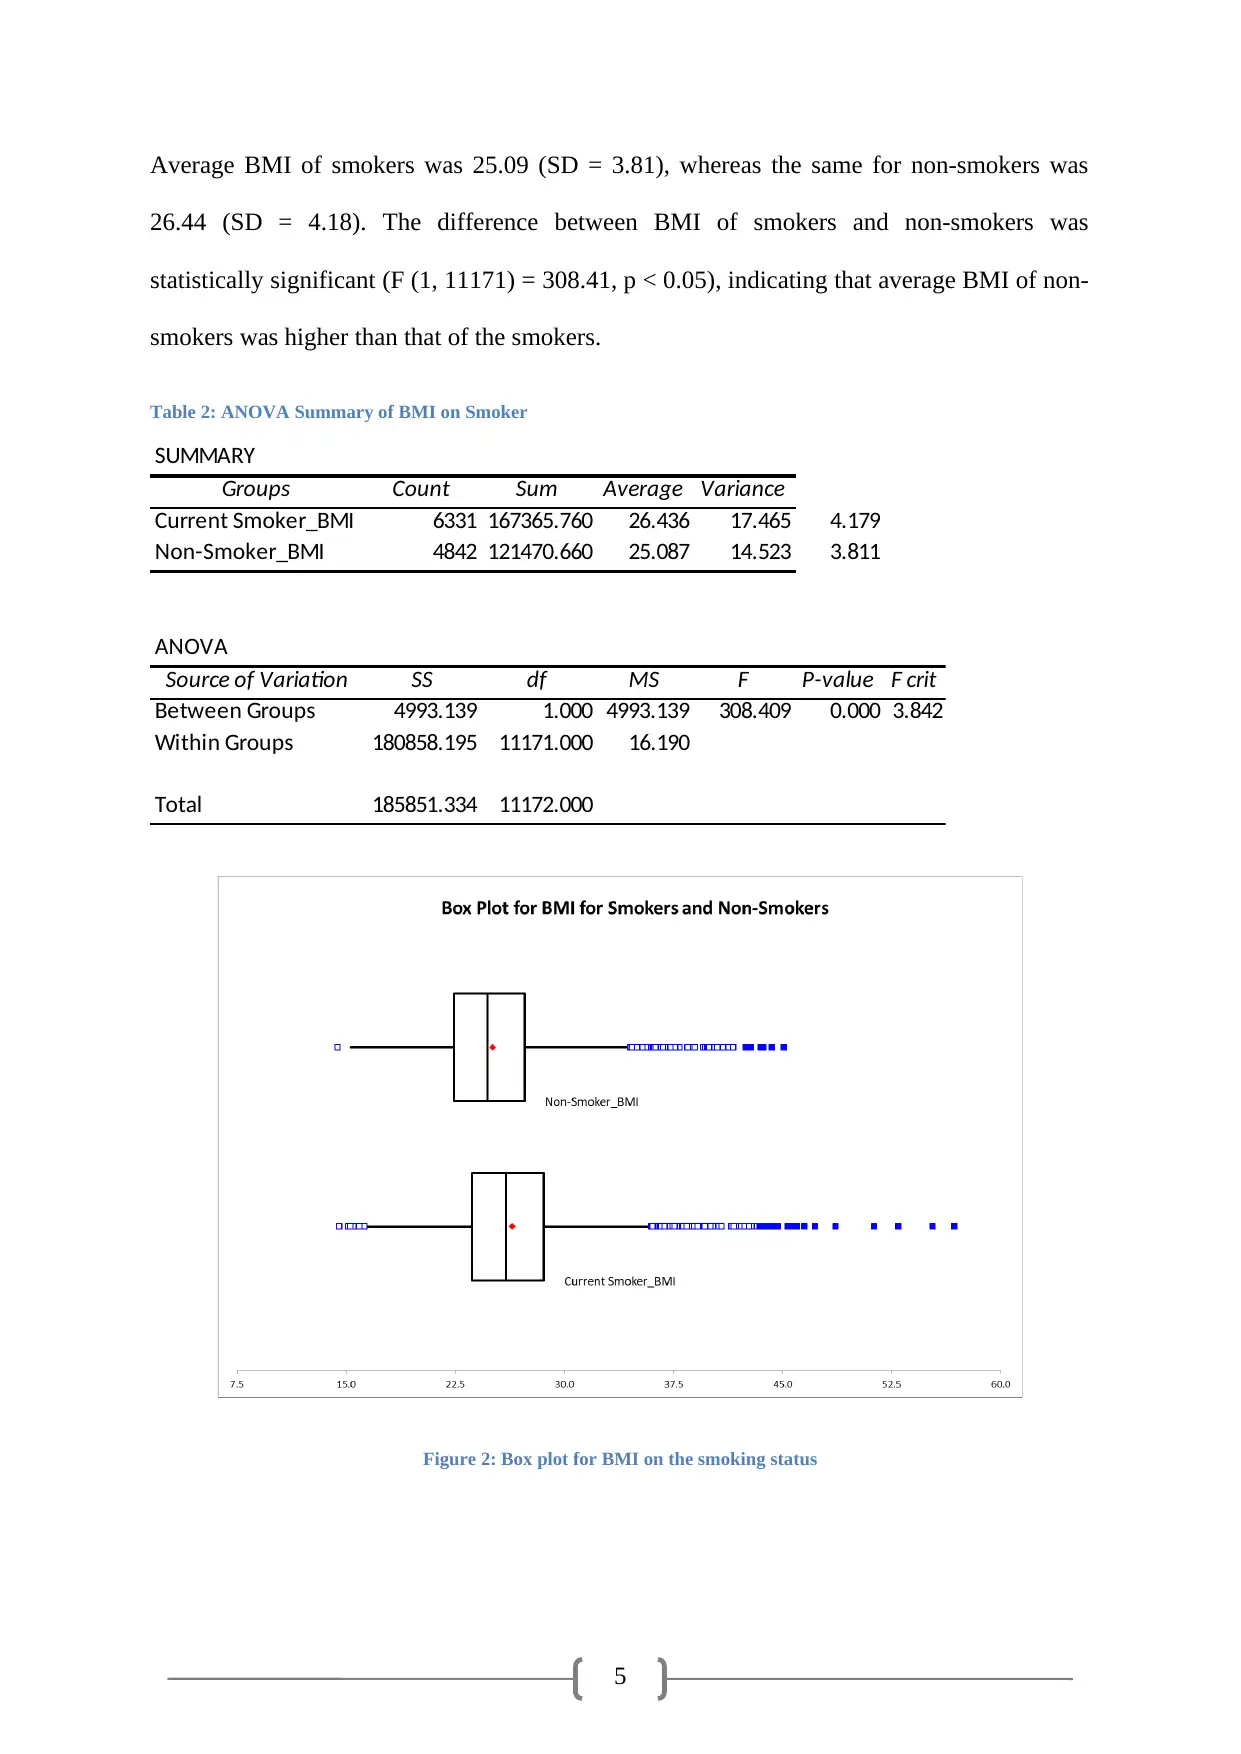
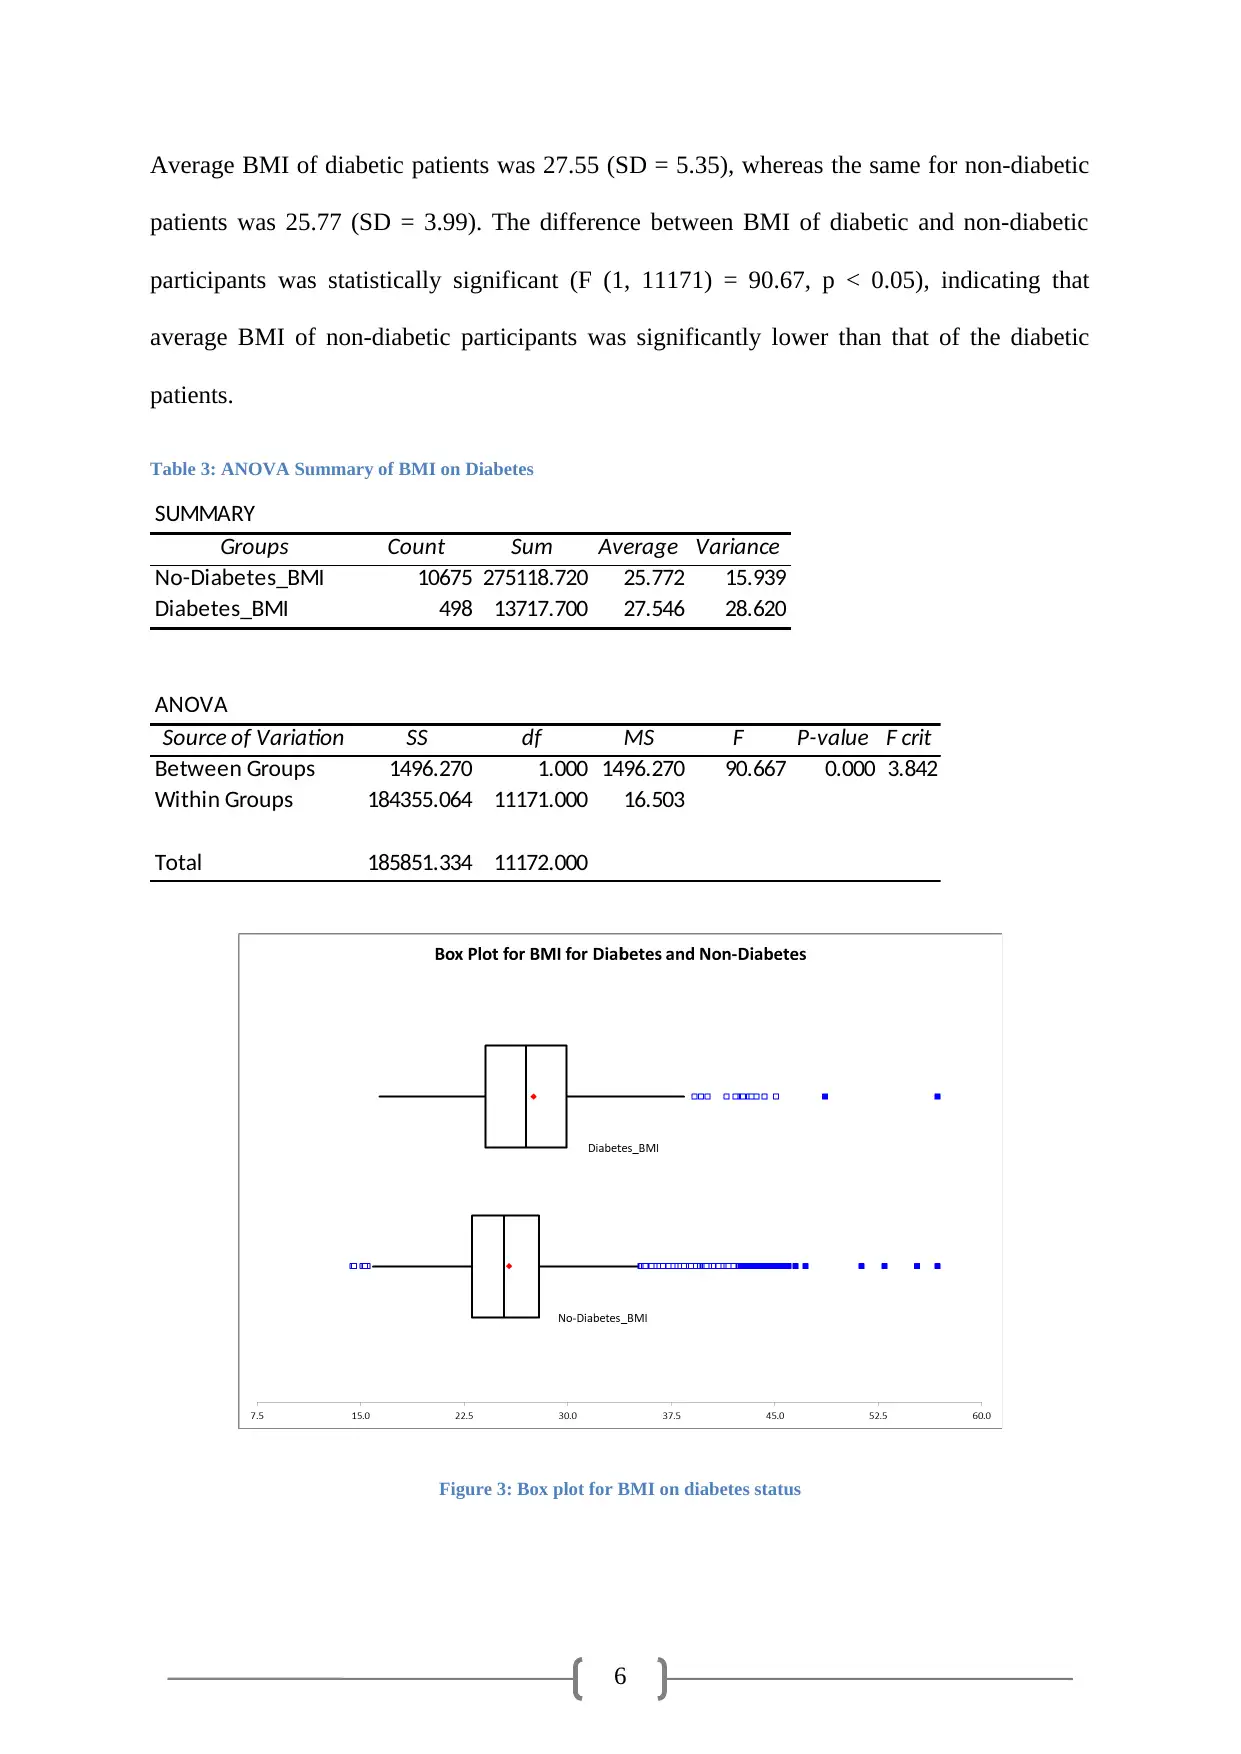
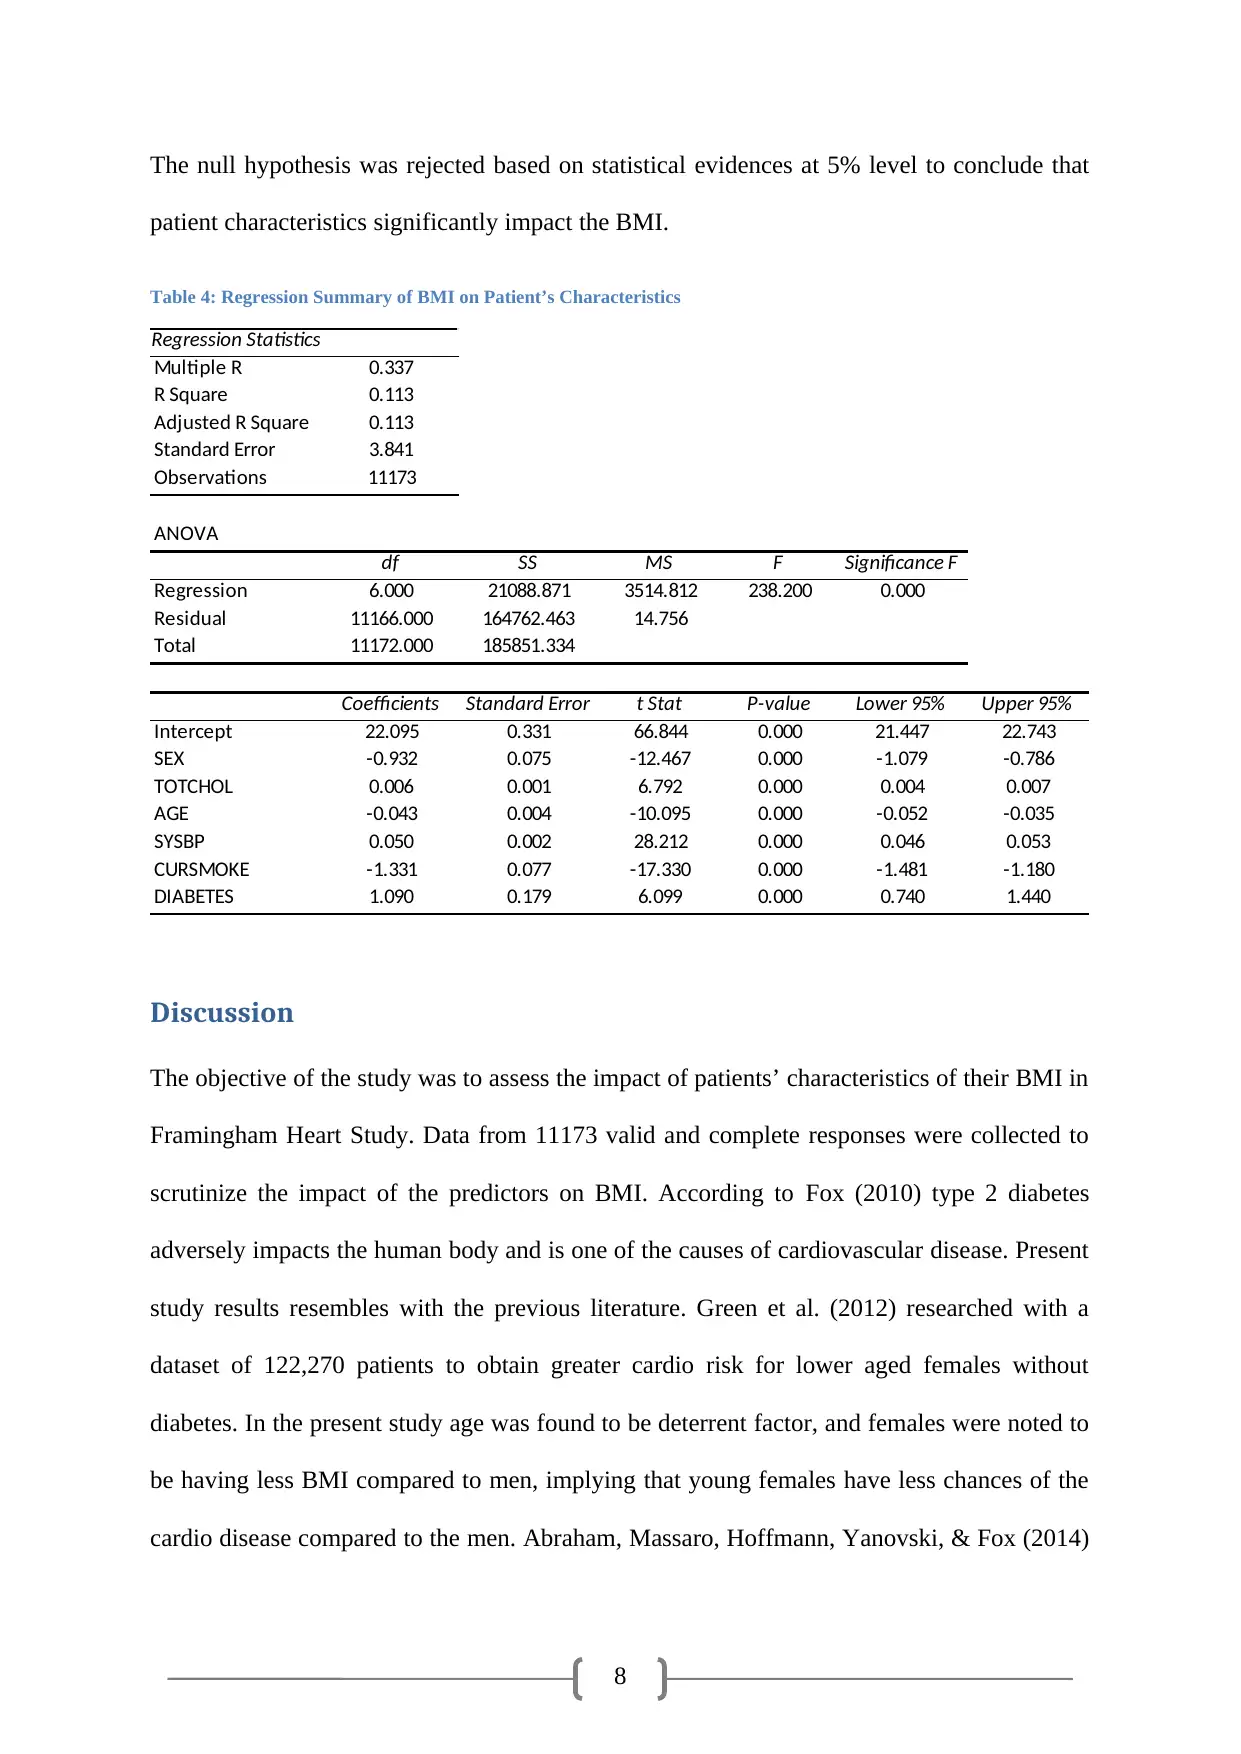
This report presents a comprehensive statistical analysis of the Framingham Heart Study, focusing on the factors influencing Body Mass Index (BMI) using linear regression modeling. The study examined the impact of age, sex, systolic blood pressure, total serum cholesterol, smoking status, and diabetes on BMI. The analysis involved data cleaning to address missing values, descriptive statistics to summarize participant characteristics, and ANOVA to compare mean BMI across different groups (gender, smokers/non-smokers, and diabetic/non-diabetic patients). The regression analysis revealed that the multiple regression model was statistically significant, with the predictors collectively explaining approximately 11.3% of the variation in BMI. Key findings include the negative impact of age on BMI, lower BMI in females compared to males, the positive association of systolic blood pressure and diabetes with BMI, and a complex relationship between smoking and BMI. The study's results are consistent with previous research, highlighting the importance of patient characteristics in cardiovascular health and the potential for further exploration of factors such as eating habits.
Document Page
1
Linear Regression Modelling for the Framingham Heart Study
tabler-icon-diamond-filled.svg

Secure Best Marks with AI Grader

Need help grading? Try our AI Grader for instant feedback on your assignments.
Document Page
2
Table of Contents
Introduction................................................................................................................................3
Analysis and Findings................................................................................................................3
Data Cleaning.........................................................................................................................3
Descriptive Summary.............................................................................................................3
One-Way ANOVA.................................................................................................................4
Regression Analysis with ANOVA.......................................................................................7
Discussion..................................................................................................................................8
Conclusion..................................................................................................................................9
References................................................................................................................................10
Document Page
3
Introduction
A statistical study is designed to test the influence of age, sex, systolic blood pressure, total
serum cholesterol, current smoker, and diabetes on BMI of heart patients. The difference
between mean BMI of the two genders, smokers and non-smokers, and diabetic and non-
diabetic adults has been analysed using the Framingham Heart Study dataset. Adults aged 32
years to 81 years are selected at random and invited to participate in the study. Each
participant's systolic blood pressure and total cholesterol level were measured. Information
about their current smoking status and diabetic standing were also collected.
Analysis and Findings
Data Cleaning
The Framingham Heart Study dataset contains information about 11627 patients. Among
which 409 missing data on total cholesterol and 52 missing data about BMI were identified.
After removal of missing values, 11173 valid responses were incorporated in the present
study.
Descriptive Summary
Among 11173 participants 4898 were male patients. Average age of the participants was
54.66 years (SD = 9.54) with average systolic blood pressure of 136.06 (SD = 22.66), and
mean BMI of 25.85 (SD = 4.08). In the sample, 6331 current smokers and 498 diabetic
patients were present. Median age was 54 years, and was slightly greater than average age
implying slight right skewness in the distribution of age. Similarly, median systolic blood
pressure was higher than the average value implying a positive skewness. Median BMI of
25.45 was little above the mean value indicating presence of some higher outlier values. BMI
Document Page
4
of participants varied between 14.43 and 56.80. Systolic blood pressure of the participants
was noted to vary between 83.5 and 295.
One-Way ANOVA
Comparison of average BMI was conducted based on gender, smoking and diabetes status of
the participants. Average male BMI of 26.19 was slightly greater than average female BMI of
25.59, and importantly this difference was noted to be statistically significant (F (1, 11171) =
58.89, P < 0.05) at 5% level of significance.
Table 1: ANOVA Summary of BMI on Gender
SUMMARY
Groups Count Sum Average Variance
Male_BMI 4898.000 128257.040 26.186 11.644
Female_BMI 6275.000 160579.380 25.590 20.379
ANOVA
Source of Variation SS df MS F P-value F crit
Between Groups 974.694 1.000 974.694 58.895 0.000 3.842
Within Groups 184876.640 11171.000 16.550
Total 185851.334 11172.000
Figure 1: Box plot for BMI on the two genders
tabler-icon-diamond-filled.svg

Secure Best Marks with AI Grader

Need help grading? Try our AI Grader for instant feedback on your assignments.
Document Page
5
Average BMI of smokers was 25.09 (SD = 3.81), whereas the same for non-smokers was
26.44 (SD = 4.18). The difference between BMI of smokers and non-smokers was
statistically significant (F (1, 11171) = 308.41, p < 0.05), indicating that average BMI of non-
smokers was higher than that of the smokers.
Table 2: ANOVA Summary of BMI on Smoker
SUMMARY
Groups Count Sum Average Variance
Current Smoker_BMI 6331 167365.760 26.436 17.465 4.179
Non-Smoker_BMI 4842 121470.660 25.087 14.523 3.811
ANOVA
Source of Variation SS df MS F P-value F crit
Between Groups 4993.139 1.000 4993.139 308.409 0.000 3.842
Within Groups 180858.195 11171.000 16.190
Total 185851.334 11172.000
Figure 2: Box plot for BMI on the smoking status
Document Page
6
Average BMI of diabetic patients was 27.55 (SD = 5.35), whereas the same for non-diabetic
patients was 25.77 (SD = 3.99). The difference between BMI of diabetic and non-diabetic
participants was statistically significant (F (1, 11171) = 90.67, p < 0.05), indicating that
average BMI of non-diabetic participants was significantly lower than that of the diabetic
patients.
Table 3: ANOVA Summary of BMI on Diabetes
SUMMARY
Groups Count Sum Average Variance
No-Diabetes_BMI 10675 275118.720 25.772 15.939
Diabetes_BMI 498 13717.700 27.546 28.620
ANOVA
Source of Variation SS df MS F P-value F crit
Between Groups 1496.270 1.000 1496.270 90.667 0.000 3.842
Within Groups 184355.064 11171.000 16.503
Total 185851.334 11172.000
Figure 3: Box plot for BMI on diabetes status
Document Page
7
Regression Analysis with ANOVA
BMI of participants was a continuous outcome variable, and age, sex, systolic blood pressure;
total serum cholesterol, current smoker, and diabetes were considered as the predictors.
The null hypothesis tested using the regression equation was,
H0: Patient characteristics had no impact on the BMI of participants in Framingham Heart
Study.
The alternate hypothesis was,
H1: Patient’s characteristics had significant impact on the BMI of the participants in the
Framingham Heart Study.
The multiple regression model was overall statistically significant (F (6, 11166) = 238.2, p <
0.05) (Wiley, & Pace, 2015). The Multiple Correlation coefficient among the variables was
0.34, where coefficient of determination was 0.11. The R2 implied that the predictors together
were able to explain almost 11.3% variation of the BMI of the patients. Importantly, all the
predictors including the intercept were noted be statistically significant predictors at 5% level
of significance. The regression equation was evaluated as:
BMI = - 0.04 * Age – 0.93 * Sex + 0.05 * Systolic BP + 0.01 * Total Serum cholesterol –
1.33 * Current Smoker + 1.09 * Diabetes + 22.09
The regression equation revealed that BMI of females was 0.93 less on an average compared
to that of the men (keeping other factors constant). Smoking is noted increase BMI by 1.33
times compared to that of the non-smokers. Similarly, diabetic patients are expected to have
1.09 times higher BMI compared to non-diabetic ones (controlling for other factors).
Intercept of 22.09 implied BMI level in absence of all the predictors.
tabler-icon-diamond-filled.svg

Paraphrase This Document

Need a fresh take? Get an instant paraphrase of this document with our AI Paraphraser
Document Page
8
The null hypothesis was rejected based on statistical evidences at 5% level to conclude that
patient characteristics significantly impact the BMI.
Table 4: Regression Summary of BMI on Patient’s Characteristics
Regression Statistics
Multiple R 0.337
R Square 0.113
Adjusted R Square 0.113
Standard Error 3.841
Observations 11173
ANOVA
df SS MS F Significance F
Regression 6.000 21088.871 3514.812 238.200 0.000
Residual 11166.000 164762.463 14.756
Total 11172.000 185851.334
Coefficients Standard Error t Stat P-value Lower 95% Upper 95%
Intercept 22.095 0.331 66.844 0.000 21.447 22.743
SEX -0.932 0.075 -12.467 0.000 -1.079 -0.786
TOTCHOL 0.006 0.001 6.792 0.000 0.004 0.007
AGE -0.043 0.004 -10.095 0.000 -0.052 -0.035
SYSBP 0.050 0.002 28.212 0.000 0.046 0.053
CURSMOKE -1.331 0.077 -17.330 0.000 -1.481 -1.180
DIABETES 1.090 0.179 6.099 0.000 0.740 1.440
Discussion
The objective of the study was to assess the impact of patients’ characteristics of their BMI in
Framingham Heart Study. Data from 11173 valid and complete responses were collected to
scrutinize the impact of the predictors on BMI. According to Fox (2010) type 2 diabetes
adversely impacts the human body and is one of the causes of cardiovascular disease. Present
study results resembles with the previous literature. Green et al. (2012) researched with a
dataset of 122,270 patients to obtain greater cardio risk for lower aged females without
diabetes. In the present study age was found to be deterrent factor, and females were noted to
be having less BMI compared to men, implying that young females have less chances of the
cardio disease compared to the men. Abraham, Massaro, Hoffmann, Yanovski, & Fox (2014)
Document Page
9
found in their study that objective binge eating in patients with liver fat was one of the prime
reasons for metabolic risk factors. Here inclusion of eating habits of the patients could be
beneficial for assessing the impact of the predictors.
Conclusion
The present study reveals that age has a deterrent impact on BMI, whereas females are less
prone to cardiovascular diseases compared to men. Systolic blood pressure positively impacts
BMI indicating high BP to be a major reason behind cardio problems. Total serum
cholesterol is a significant but slow impact factor. Hence, high total cholesterol will also
hamper BMI figures eventually affecting the heart in adverse way. Smoking at present was
found to have low BMI compared to non-smokers indicating requirement of further research.
Diabetes is noted to have very high and significant impact on BMI in adverse way. Higher
diabetes levels will certainly damage cardiovascular functionality. The results using the
Framingham Heart Study data was in line with earlier studies.
Document Page
10
References
Abraham, T. M., Massaro, J. M., Hoffmann, U., Yanovski, J. A., & Fox, C. S. (2014).
Metabolic characterization of adults with binge eating in the general population: the
Framingham Heart Study. Obesity, 22(11), 2441-2449.
Fox, C. S. (2010). Cardiovascular disease risk factors, type 2 diabetes mellitus, and the
Framingham Heart Study. Trends in cardiovascular medicine, 20(3), 90-95.
Green, B. B., Anderson, M. L., Cook, A. J., Catz, S., Fishman, P. A., McClure, J. B., & Reid,
R. (2012). Using body mass index data in the electronic health record to calculate
cardiovascular risk. American journal of preventive medicine, 42(4), 342-347.
Wiley, J. F., & Pace, L. A. (2015). Multiple regression. In Beginning R (pp. 139-161).
Apress, Berkeley, CA.
chevron_up_icon
1 out of 10
circle_padding
hide_on_mobile
zoom_out_icon
[object Object]