BCO124 Macroeconomics: Effects of 2008 Economic Crisis in France

Verified

Added on  2022/08/10

|15
|609
|15
Report
AI Summary
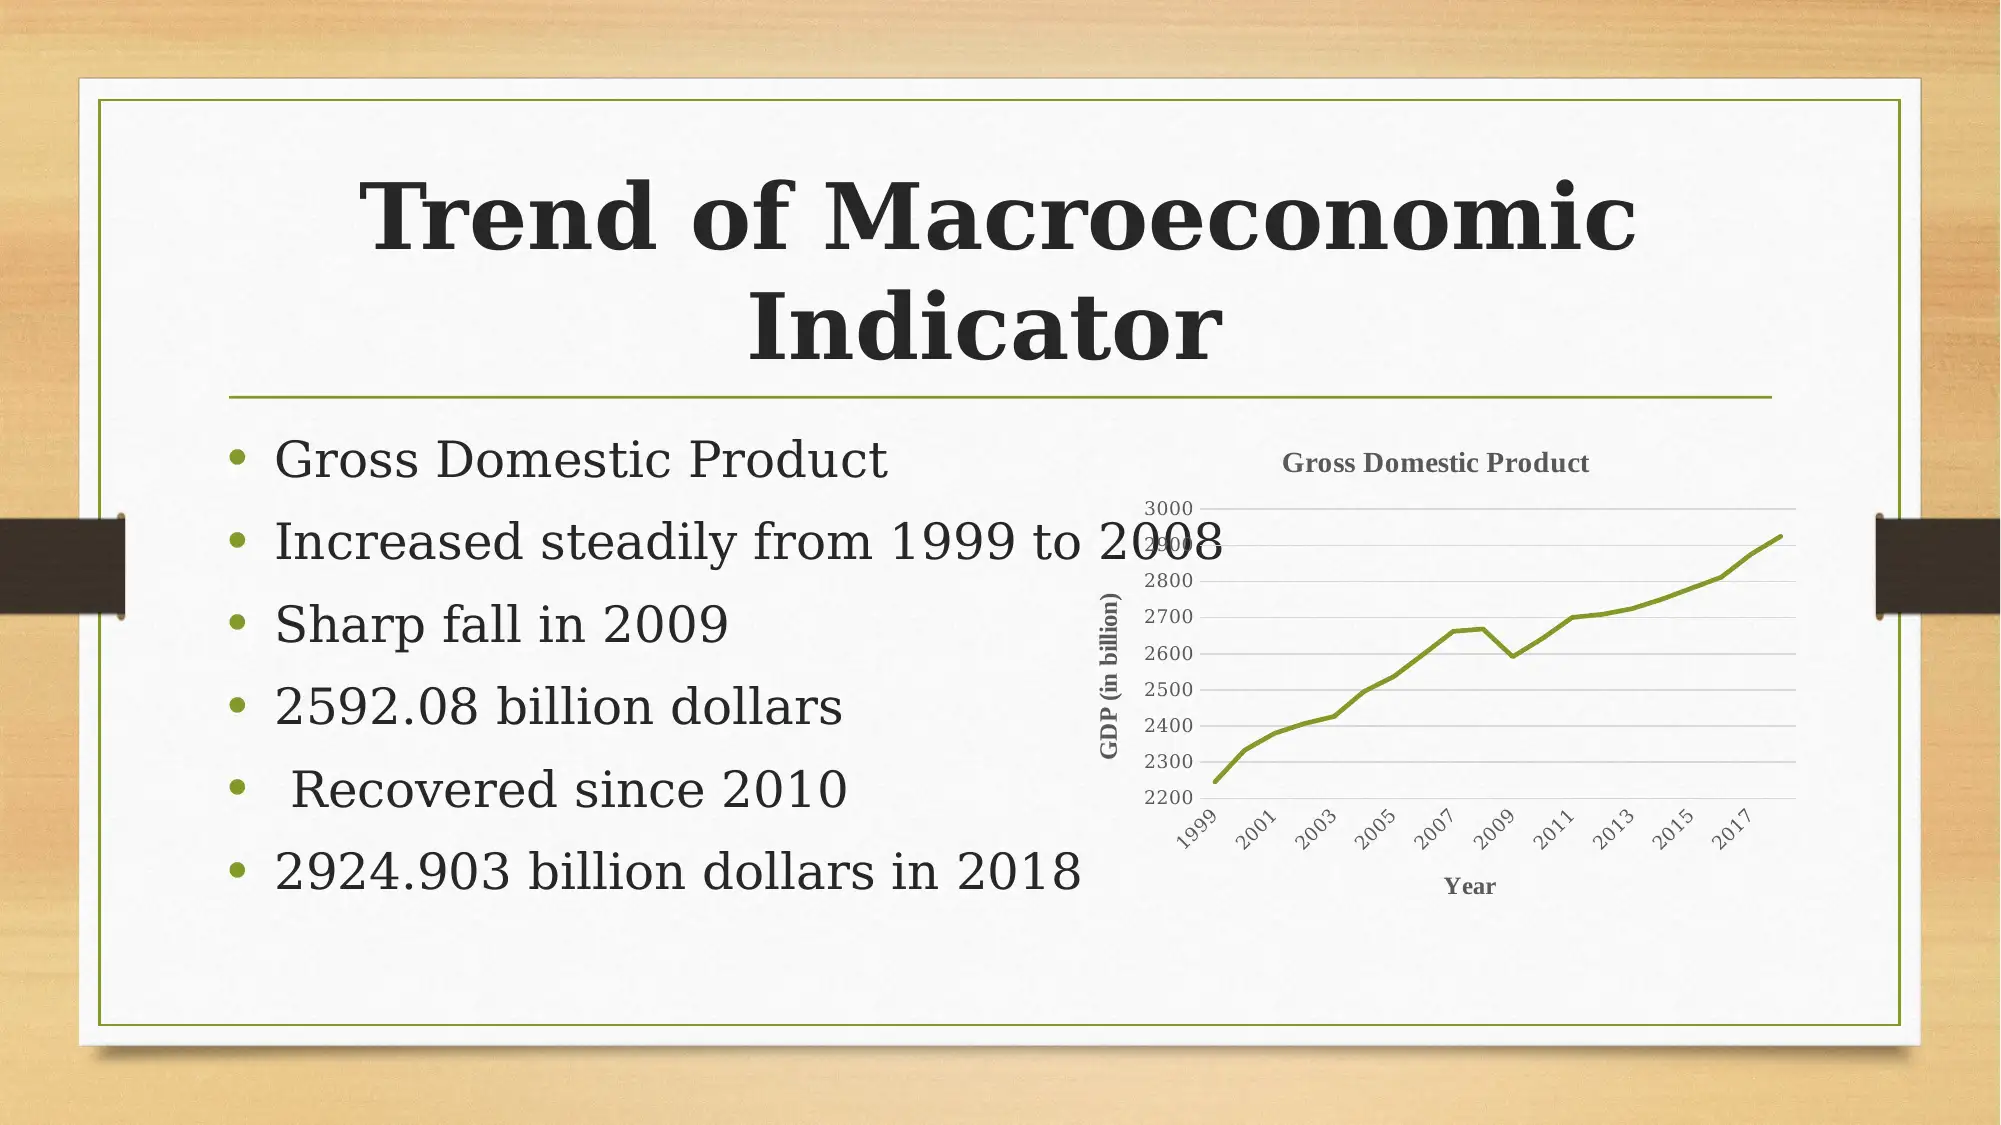
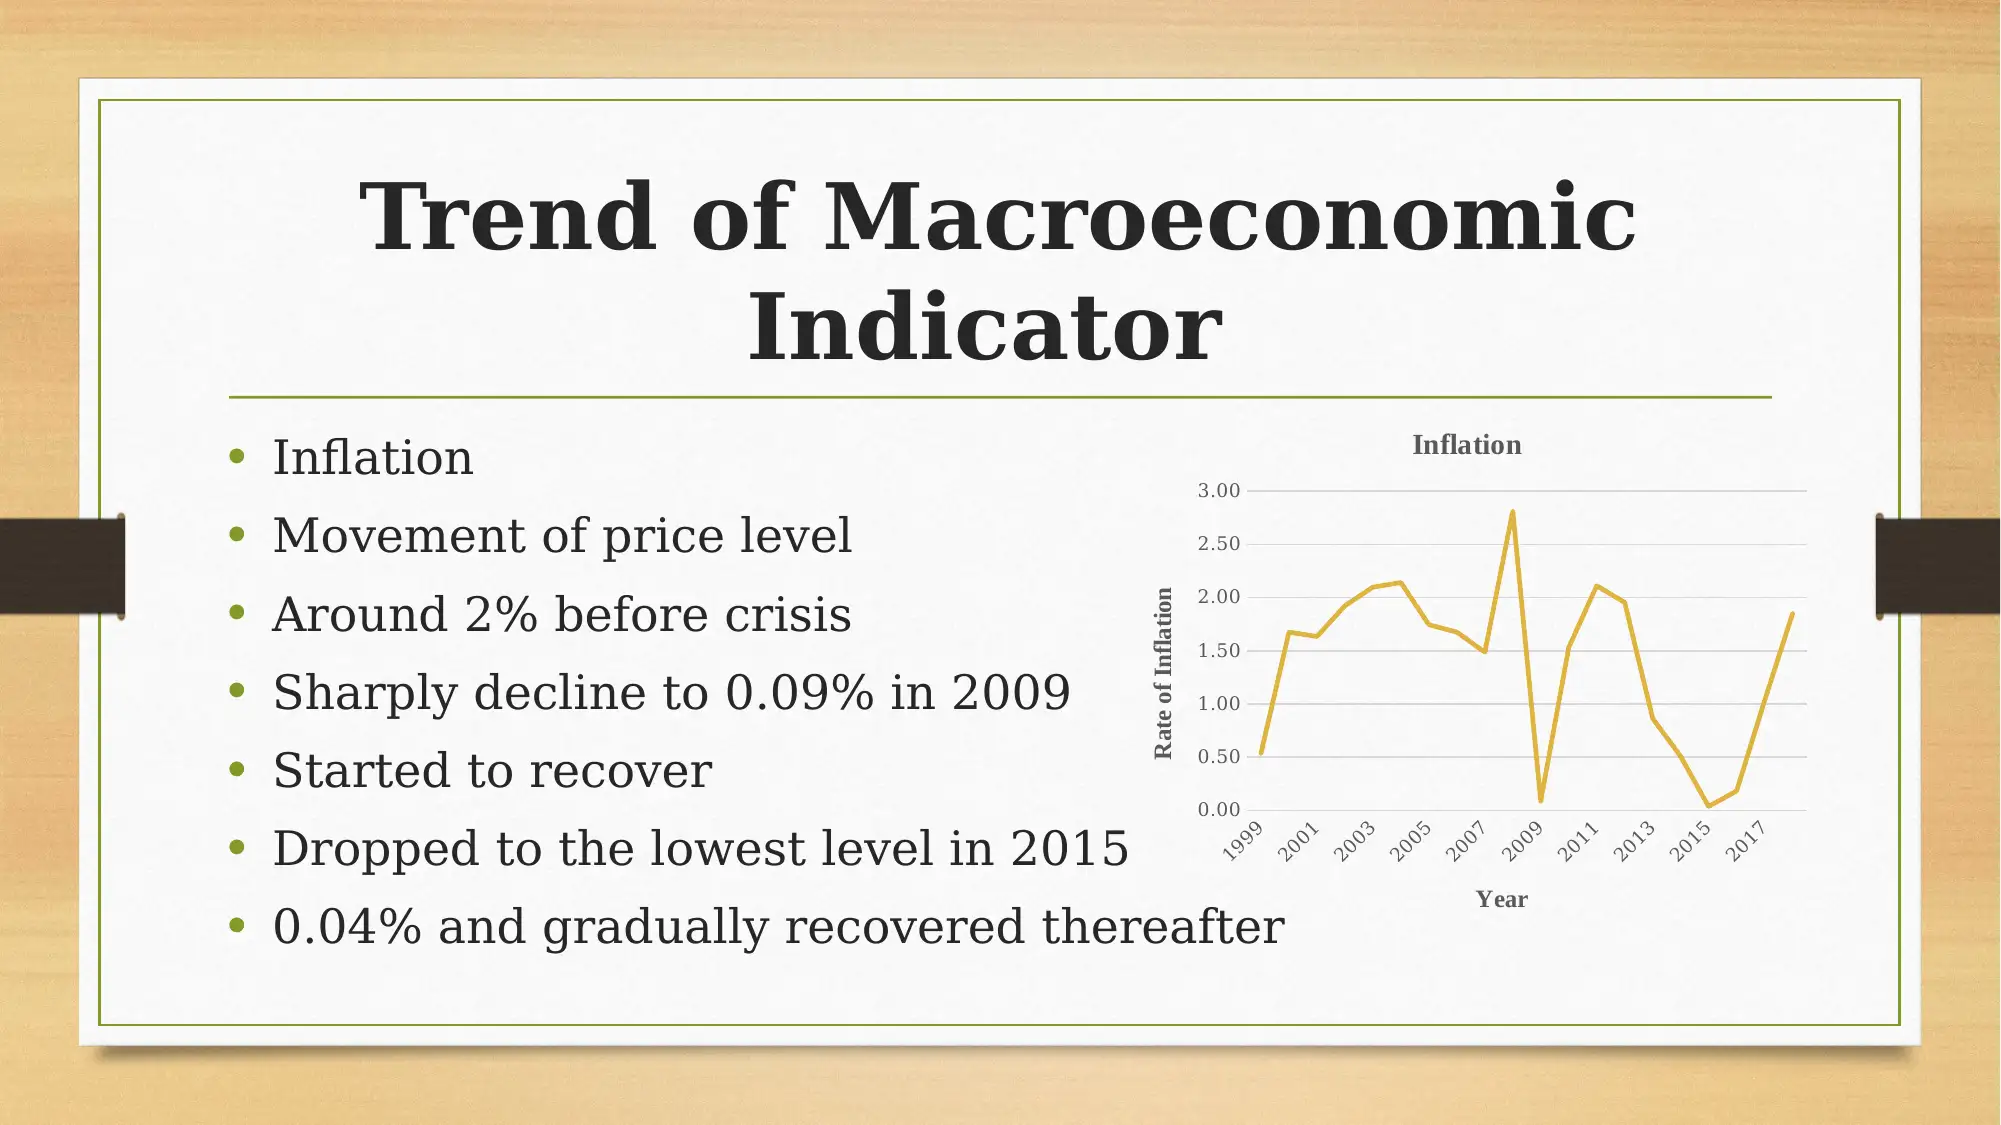
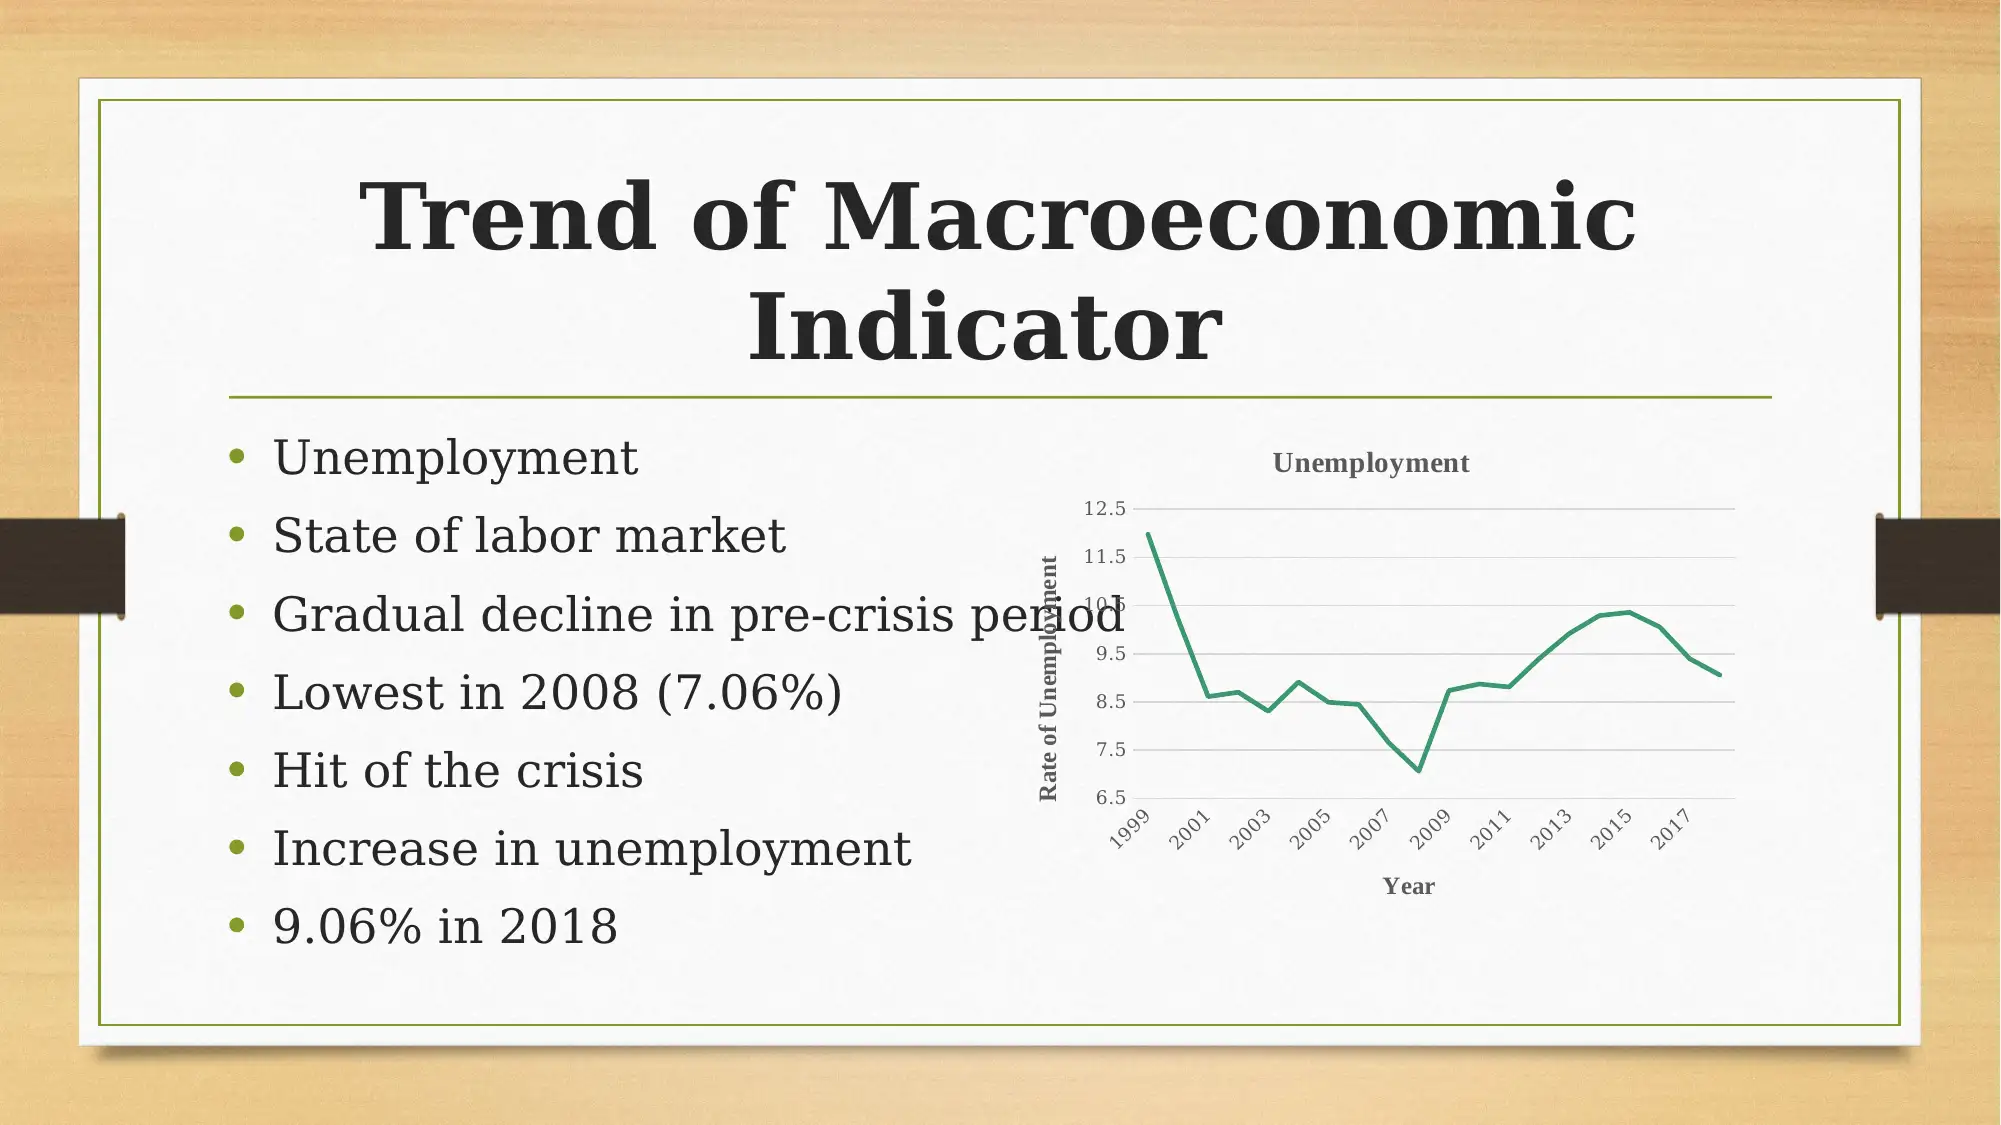
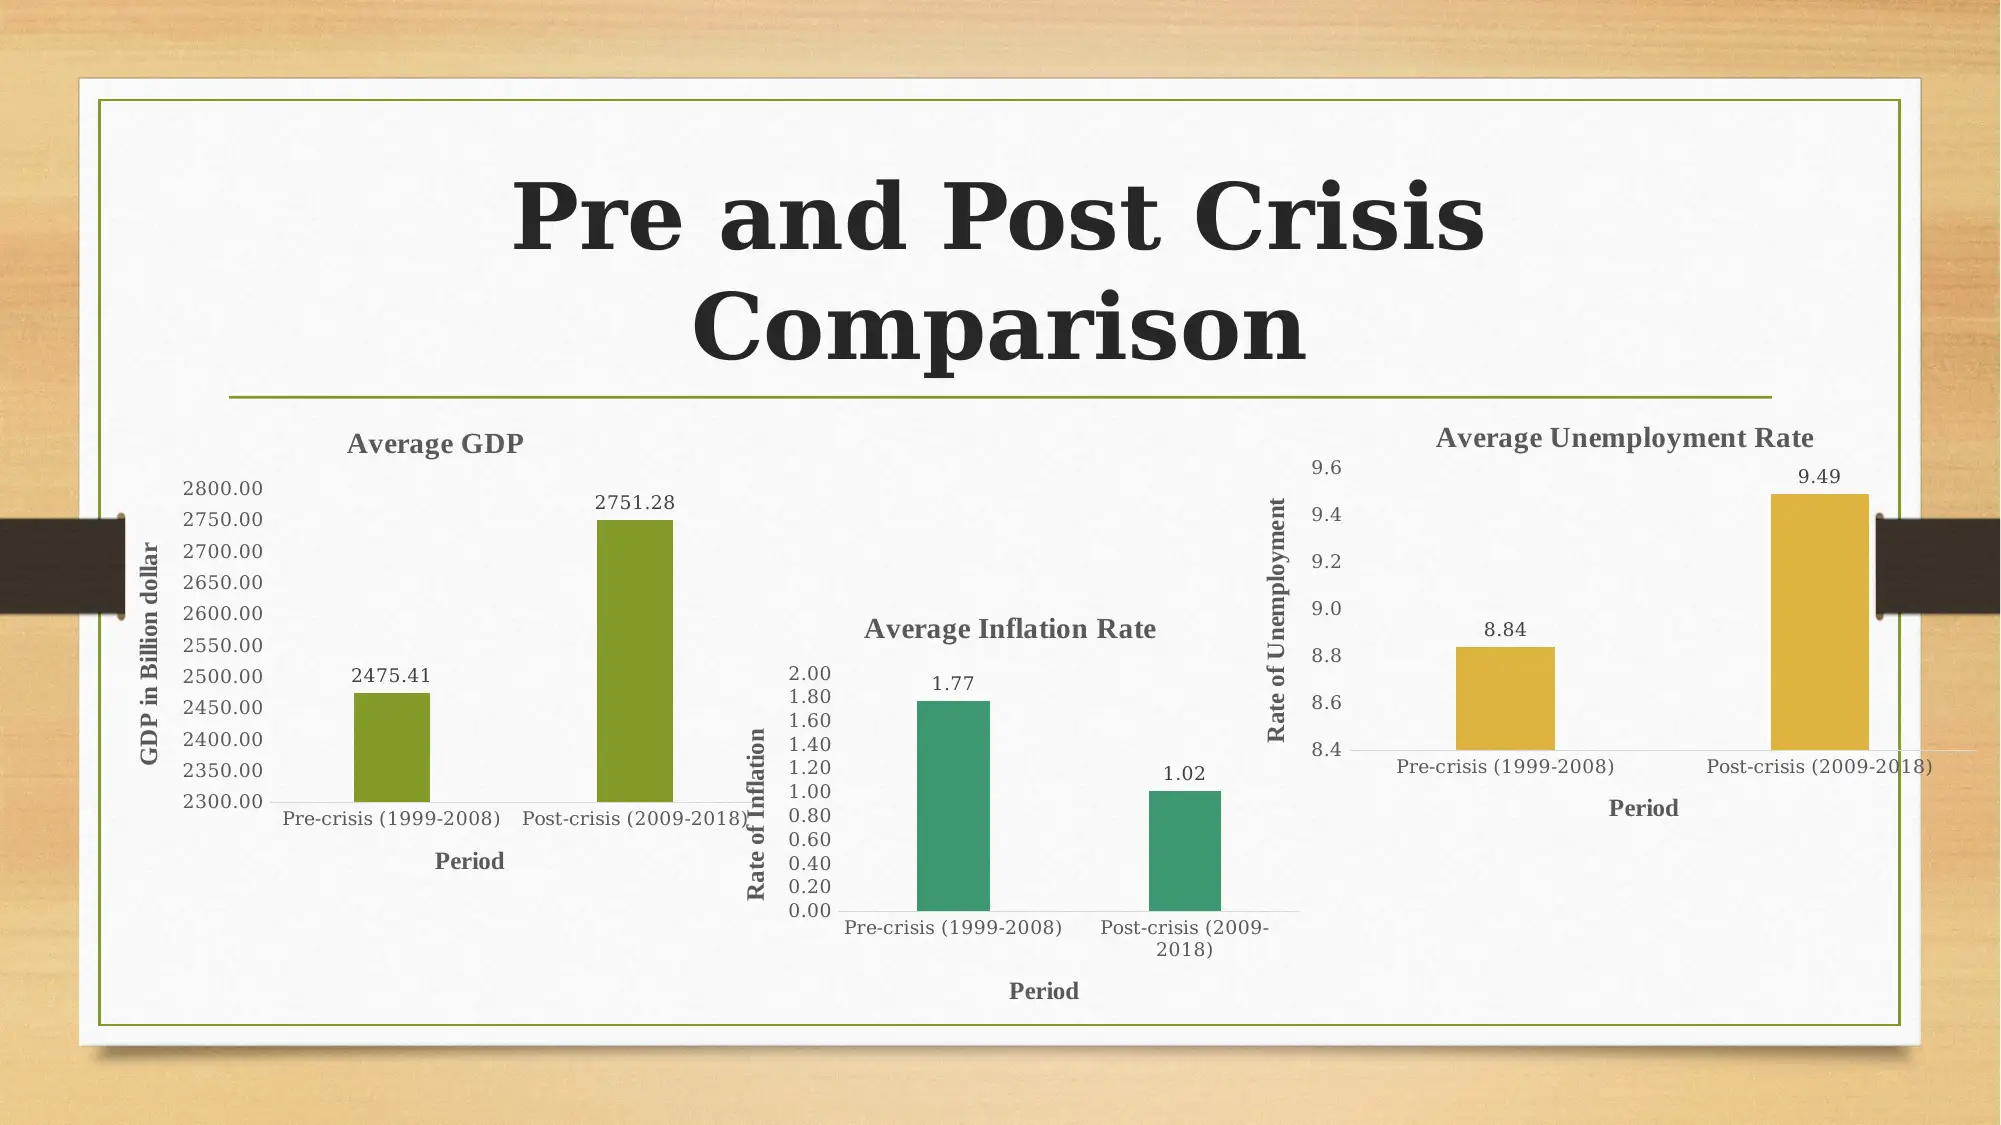
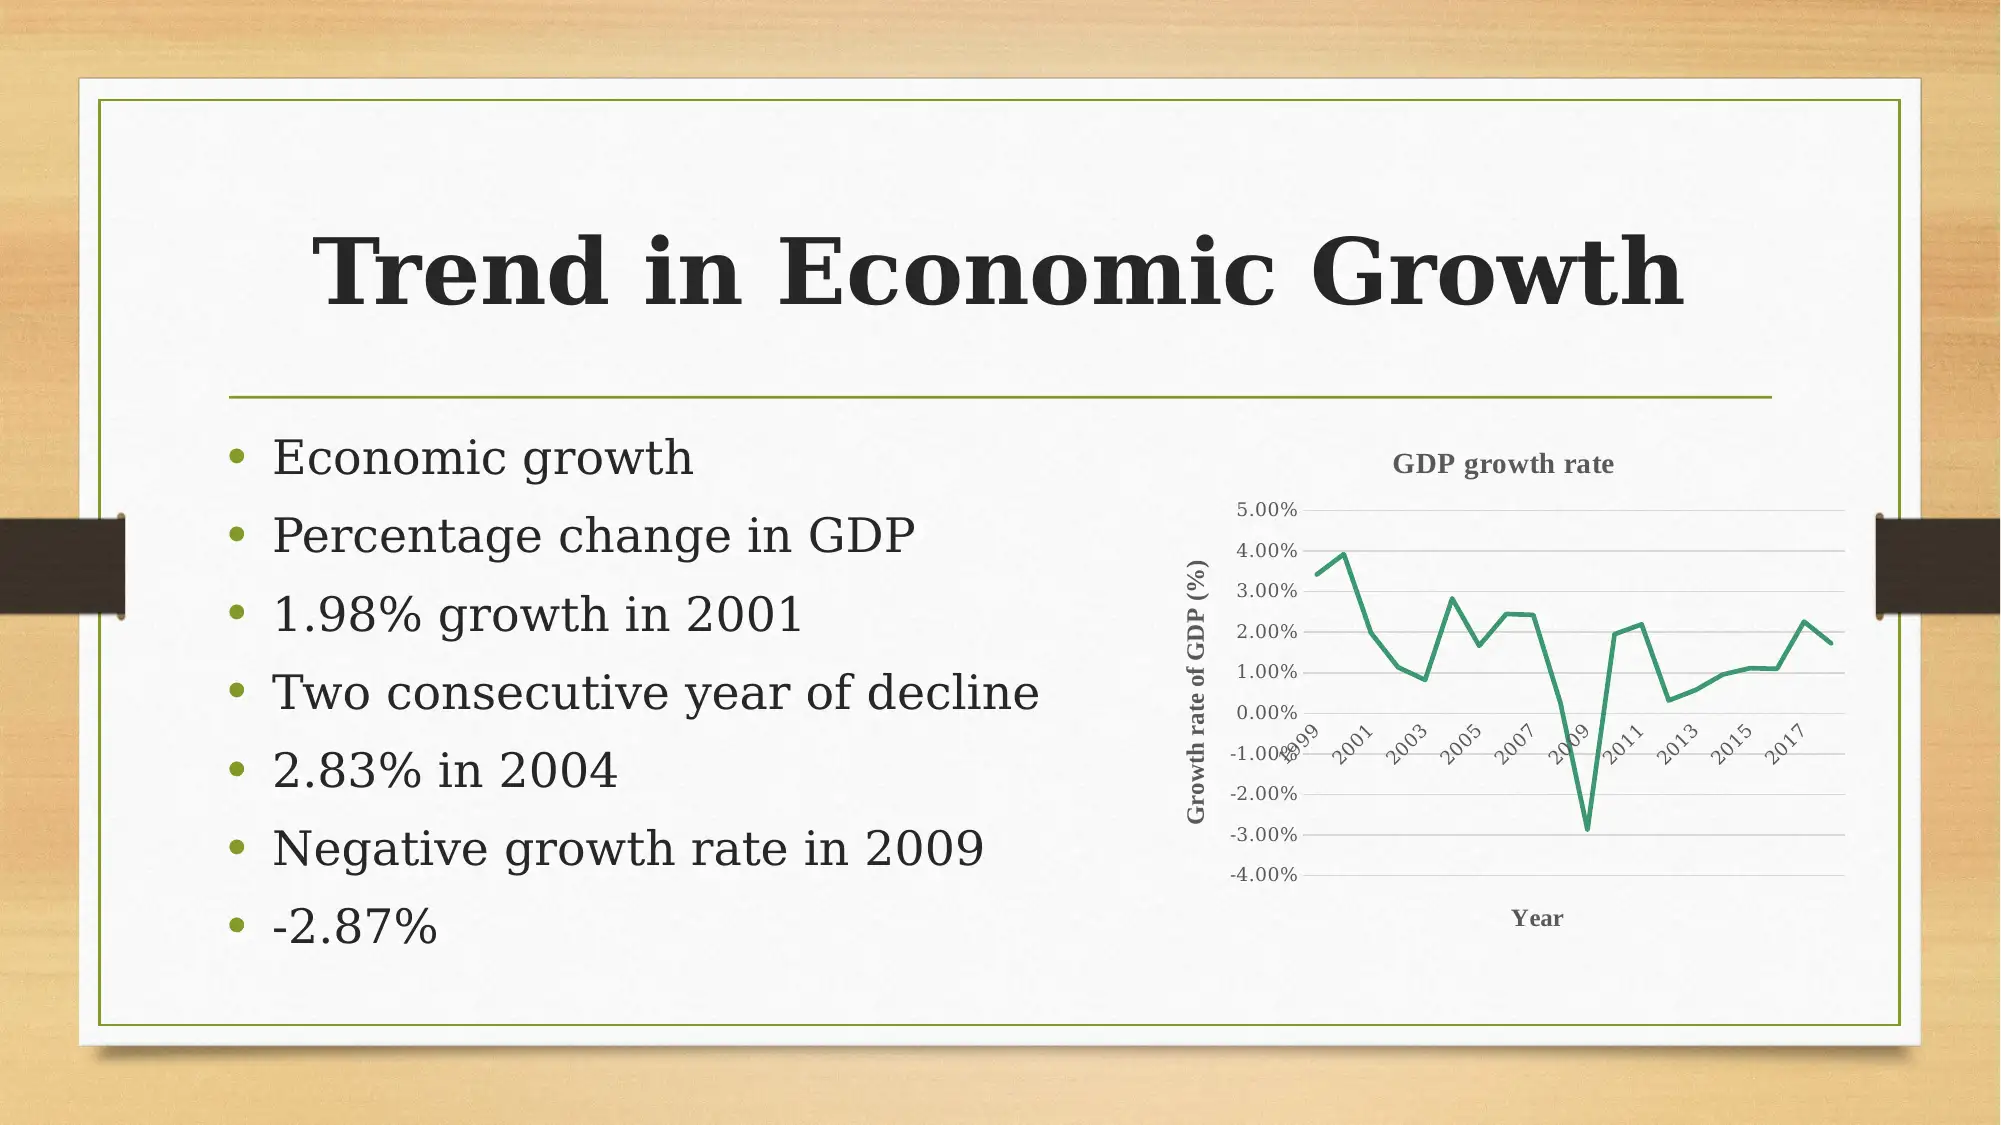
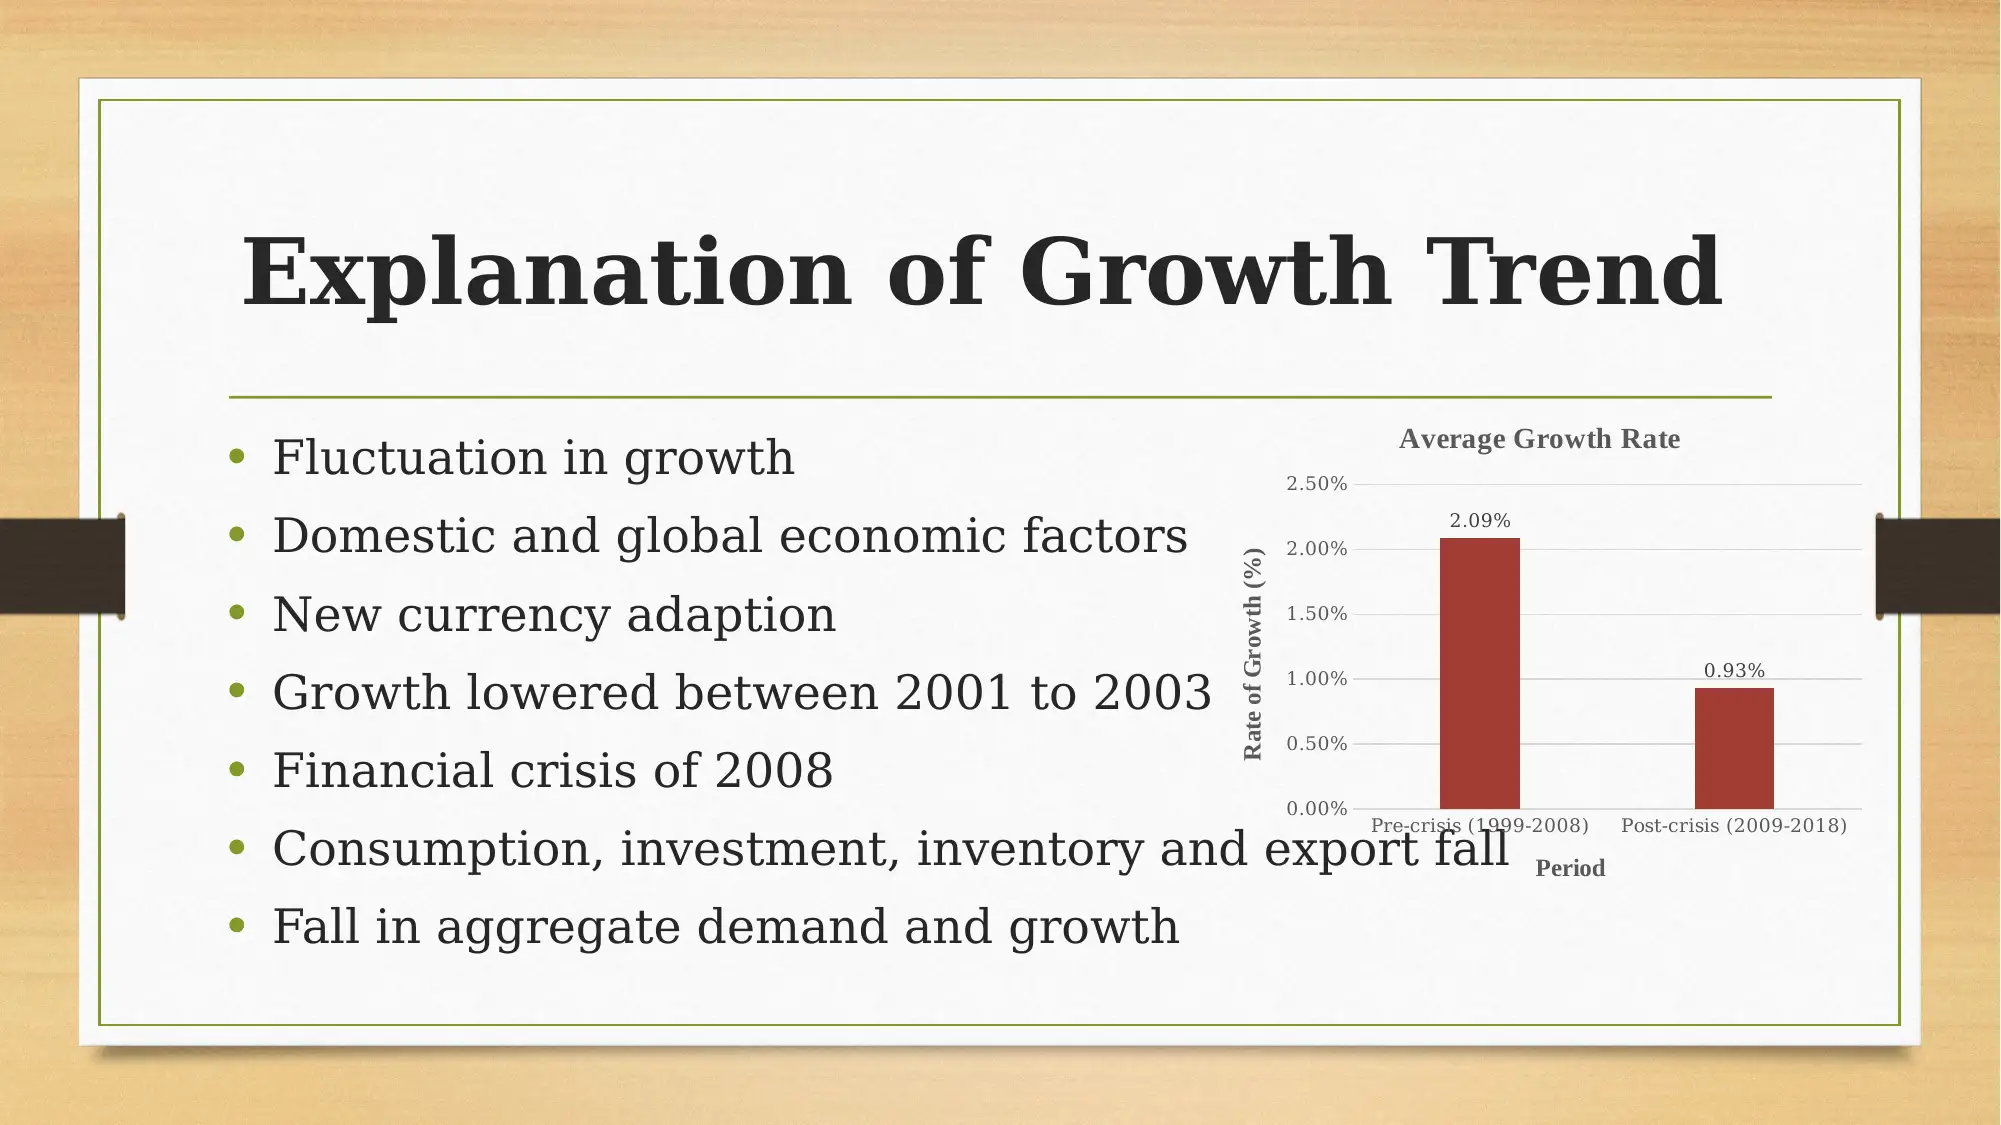
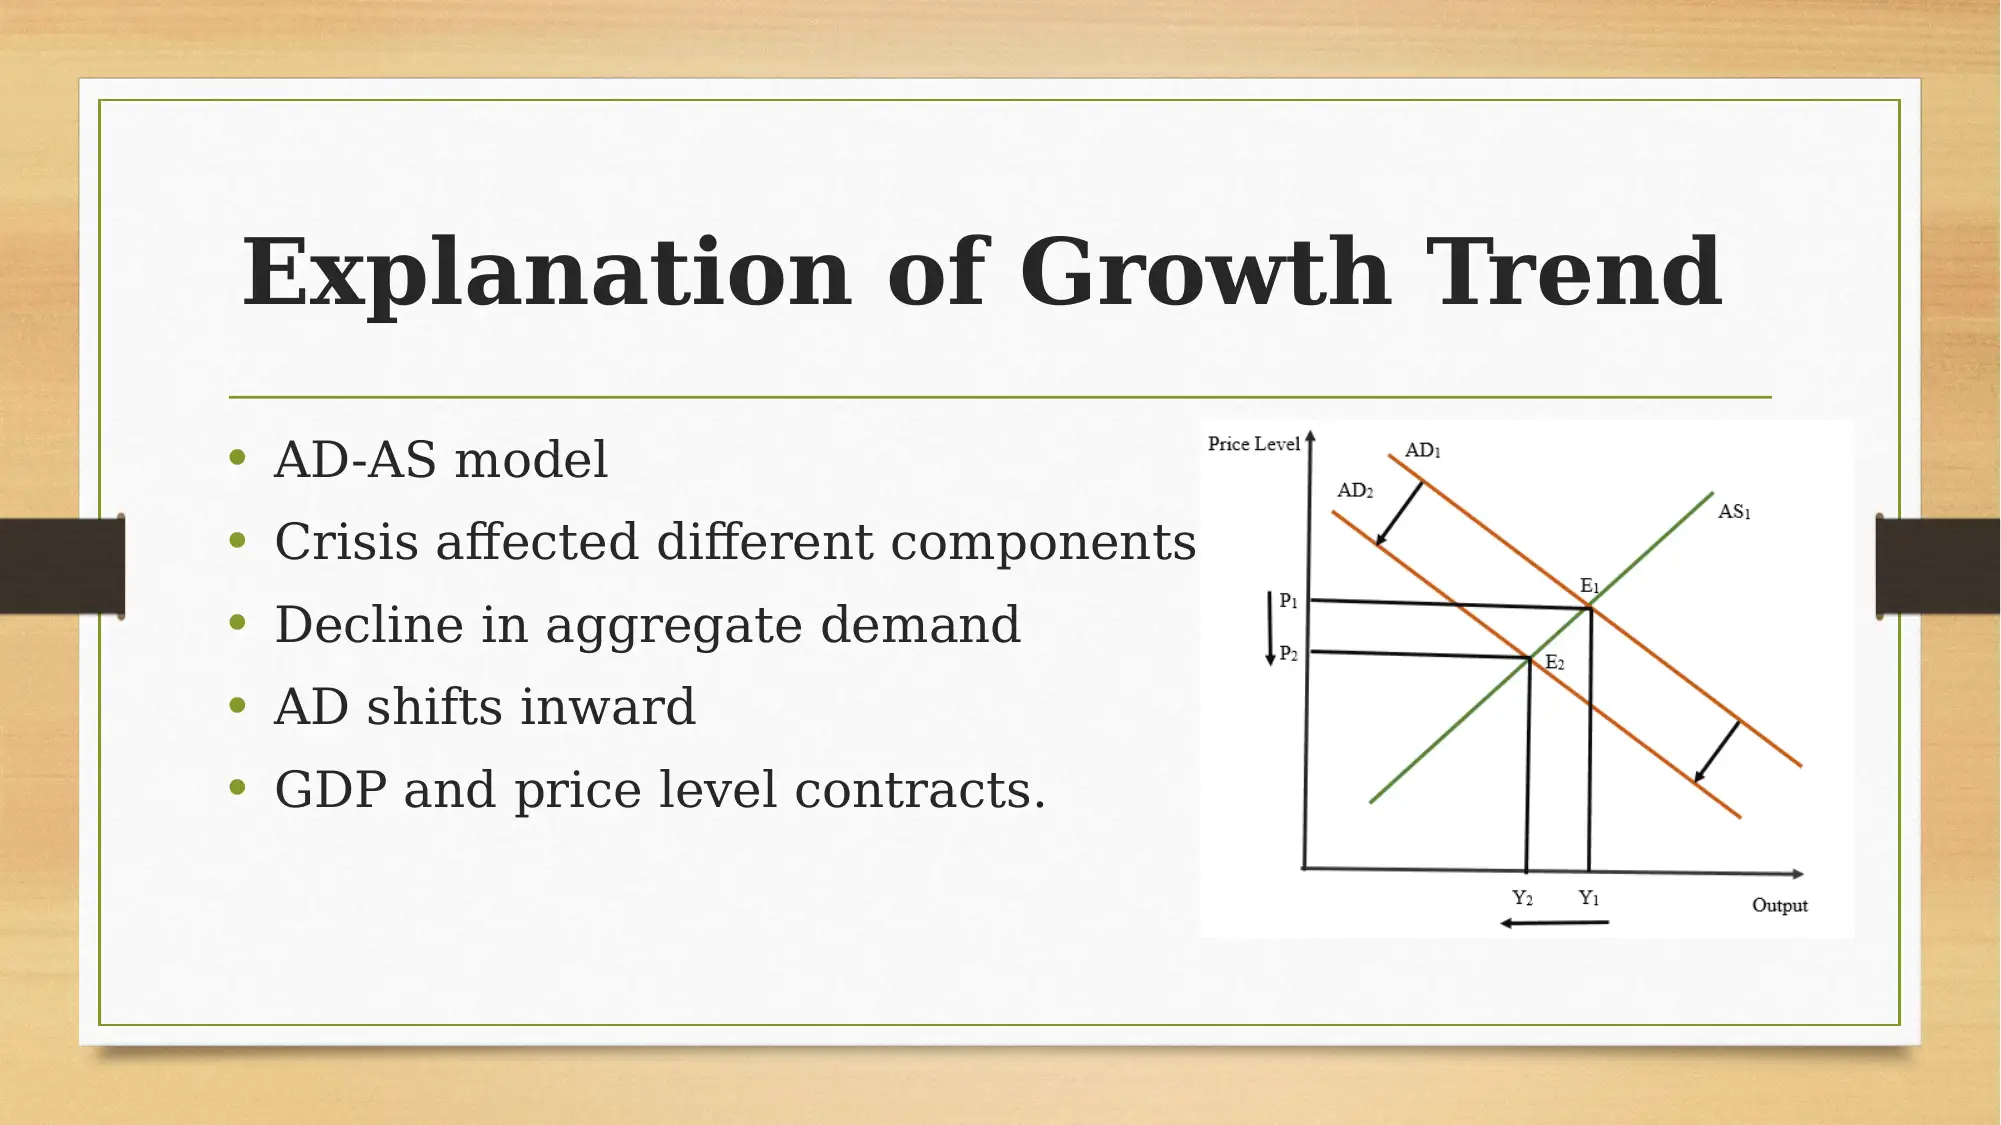
This report analyzes the impact of the 2008 economic crisis on the French economy. It begins by outlining the crisis's origin and global spread, followed by an examination of key macroeconomic indicators: GDP, inflation, and unemployment. The report presents the trends of these indicators, including pre-crisis levels, the sharp declines during the crisis, and subsequent recovery. GDP growth rates are calculated and analyzed, with explanations of the fluctuations and influencing factors. The report employs the AD-AS model and the circular flow model to explain the crisis's effects, focusing on the decline in aggregate demand and the impact on GDP and price levels. Finally, it offers policy recommendations, including structural and labor market reforms, along with expansionary monetary policies to stabilize economic growth and recover price levels. References from academic sources support the analysis.
Document Page
Macroeconomics
Name of the Student
Name of the University
Course ID
tabler-icon-diamond-filled.svg

Paraphrase This Document

Need a fresh take? Get an instant paraphrase of this document with our AI Paraphraser
Document Page
Introduction
World economic crisis
One significant economic event
Started in 2008
Subprime mortgage crisis
Originated in United State
Spread over other countries
Impact on France
Document Page
Trend of Macroeconomic
Indicator
Gross Domestic Product
Increased steadily from 1999 to 2008
Sharp fall in 2009
2592.08 billion dollars
Recovered since 2010
2924.903 billion dollars in 2018
1999
2001
2003
2005
2007
2009
2011
2013
2015
2017
2200
2300
2400
2500
2600
2700
2800
2900
3000
Gross Domestic Product
Year
GDP (in billion)
Document Page
Trend of Macroeconomic
Indicator
Inflation
Movement of price level
Around 2% before crisis
Sharply decline to 0.09% in 2009
Started to recover
Dropped to the lowest level in 2015
0.04% and gradually recovered thereafter
1999
2001
2003
2005
2007
2009
2011
2013
2015
2017
0.00
0.50
1.00
1.50
2.00
2.50
3.00
Inflation
Year
Rate of Inflation
tabler-icon-diamond-filled.svg

Paraphrase This Document

Need a fresh take? Get an instant paraphrase of this document with our AI Paraphraser
Document Page
Trend of Macroeconomic
Indicator
Unemployment
State of labor market
Gradual decline in pre-crisis period
Lowest in 2008 (7.06%)
Hit of the crisis
Increase in unemployment
9.06% in 2018
1999
2001
2003
2005
2007
2009
2011
2013
2015
2017
6.5
7.5
8.5
9.5
10.5
11.5
12.5
Unemployment
Year
Rate of Unemployment
Document Page
Pre and Post Crisis
Comparison
Pre-crisis (1999-2008) Post-crisis (2009-2018)
2300.00
2350.00
2400.00
2450.00
2500.00
2550.00
2600.00
2650.00
2700.00
2750.00
2800.00
2475.41
2751.28
Average GDP
Period
GDP in Billion dollar
Pre-crisis (1999-2008) Post-crisis (2009-
2018)
0.00
0.20
0.40
0.60
0.80
1.00
1.20
1.40
1.60
1.80
2.00 1.77
1.02
Average Inflation Rate
Period
Rate of Inflation
Pre-crisis (1999-2008) Post-crisis (2009-2018)
8.4
8.6
8.8
9.0
9.2
9.4
9.6
8.84
9.49
Average Unemployment Rate
Period
Rate of Unemployment
Document Page
Trend in Economic Growth
Economic growth
Percentage change in GDP
1.98% growth in 2001
Two consecutive year of decline
2.83% in 2004
Negative growth rate in 2009
-2.87%
1999
2001
2003
2005
2007
2009
2011
2013
2015
2017
-4.00%
-3.00%
-2.00%
-1.00%
0.00%
1.00%
2.00%
3.00%
4.00%
5.00%
GDP growth rate
Year
Growth rate of GDP (%)
tabler-icon-diamond-filled.svg

Paraphrase This Document

Need a fresh take? Get an instant paraphrase of this document with our AI Paraphraser
Document Page
Explanation of Growth Trend
Fluctuation in growth
Domestic and global economic factors
New currency adaption
Growth lowered between 2001 to 2003
Financial crisis of 2008
Consumption, investment, inventory and export fall
Fall in aggregate demand and growth
Pre-crisis (1999-2008) Post-crisis (2009-2018)
0.00%
0.50%
1.00%
1.50%
2.00%
2.50%
2.09%
0.93%
Average Growth Rate
Period
Rate of Growth (%)
Document Page
Explanation of Growth Trend
AD-AS model
Crisis affected different components of GDP
Decline in aggregate demand
AD shifts inward
GDP and price level contracts.
Document Page
Circular Flow Model
Circular flow model
Economic downturn
Cut in tax
Increase in spending
tabler-icon-diamond-filled.svg

Paraphrase This Document

Need a fresh take? Get an instant paraphrase of this document with our AI Paraphraser
Document Page
Circular Flow Model
Decrease in tax to household → Increase in disposable
income →Increase in consumption expenditure →Product
market→ Revenue of firm→ Cost of resources →Resource
market → Money income to household → Increased demand.
Increase in government expenditure → Product market →
Revenue of firm→ Cost of resources →Resource market →
Money income to household → Increases demand.
GDP and price level increases and unemployment falls.
Document Page
Policy Recommendation
Downturn in economic growth
Policies to stabilize growth
Structural reform
Labor market reform
Price level recovery
Expansionary monetary policy
chevron_up_icon
1 out of 15
circle_padding
hide_on_mobile
zoom_out_icon
[object Object]