Ratio Analysis Report: Frank's All American Barbeque Performance
VerifiedAdded on 2023/01/18
|6
|586
|20
Report
AI Summary
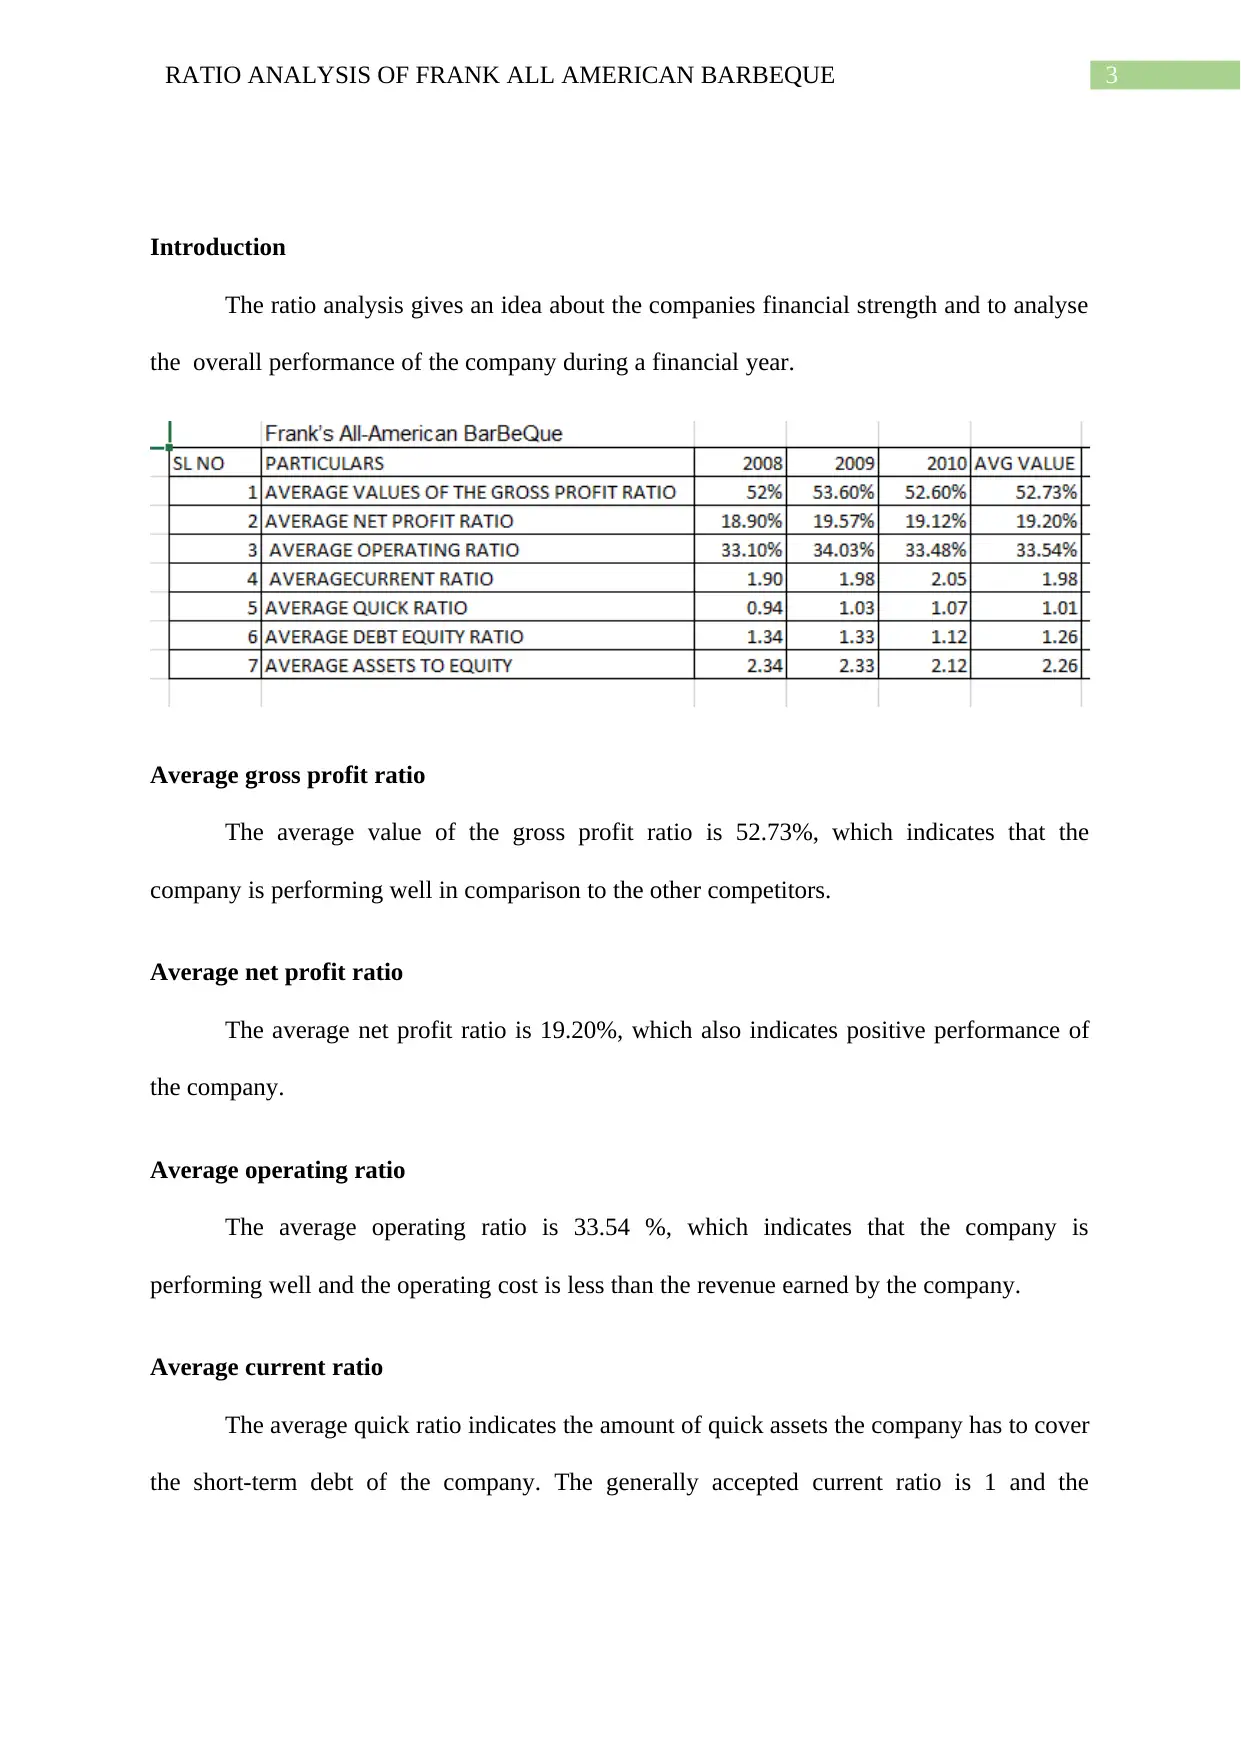
This report presents a ratio analysis of Frank's All American Barbeque, assessing its financial performance based on key metrics. The analysis includes the calculation and interpretation of various ratios, such as gross profit ratio, net profit ratio, operating ratio, current ratio, quick ratio, debt-equity r...
Read More
Contribute Materials
Your contribution can guide someone’s learning journey. Share your
documents today.

Running head: RATIO ANALYSIS OF FRANK’S ALL AMERICAN BARBEQUE
Ratio Analysis of Frank’s All American Barbeque
Name of the Student
Name of the University
Author’s note
Ratio Analysis of Frank’s All American Barbeque
Name of the Student
Name of the University
Author’s note
Secure Best Marks with AI Grader
Need help grading? Try our AI Grader for instant feedback on your assignments.

1RATIO ANALYSIS OF FRANK ALL AMERICAN BARBEQUE
Executive summary
The aim of the report is to analyse the financial strength of the small company by selecting
the various ratios of the company.
Executive summary
The aim of the report is to analyse the financial strength of the small company by selecting
the various ratios of the company.

2RATIO ANALYSIS OF FRANK ALL AMERICAN BARBEQUE
Table of Contents
Introduction................................................................................................................................3
Average gross profit ratio...........................................................................................................3
Average net profit ratio..............................................................................................................4
Average operating ratio..............................................................................................................4
Average current ratio..................................................................................................................4
Average quick ratio....................................................................................................................4
Average debt equity ratio...........................................................................................................4
Average assets to equity.............................................................................................................5
Conclusion..................................................................................................................................5

3RATIO ANALYSIS OF FRANK ALL AMERICAN BARBEQUE
Introduction
The ratio analysis gives an idea about the companies financial strength and to analyse
the overall performance of the company during a financial year.
Average gross profit ratio
The average value of the gross profit ratio is 52.73%, which indicates that the
company is performing well in comparison to the other competitors.
Average net profit ratio
The average net profit ratio is 19.20%, which also indicates positive performance of
the company.
Average operating ratio
The average operating ratio is 33.54 %, which indicates that the company is
performing well and the operating cost is less than the revenue earned by the company.
Average current ratio
The average quick ratio indicates the amount of quick assets the company has to cover
the short-term debt of the company. The generally accepted current ratio is 1 and the
Secure Best Marks with AI Grader
Need help grading? Try our AI Grader for instant feedback on your assignments.

4RATIO ANALYSIS OF FRANK ALL AMERICAN BARBEQUE
company’s current ratio is 1.98 which indicates that the company is going beyond the market
expectations.
Average quick ratio
The average quick ratio of the company is 1.01 and the market expected rate is 1, so
in this ratio also the company has been able to beat the market level and the company has
been able to create enough liquid assets to cover the current liabilities of the company
(Easton and Sommers 2018).
Average debt equity ratio
The average debt to equity ratio is expected to be 1.5 in general a high debt to equity
ratio indicates that the company is not able to generate enough cash to satisfy its debt
obligation. In the case of this company, the debt to equity ratio is 1.26, which means it has a
low debt equity ratio in comparison to the market rate. This indicates that the company is able
to generate more cash to satisfy its debt obligation (Muritala 2018).
Average assets to equity
The assets to equity ratio indicates the relation between the total assets of the firm to
the part owned by the shareholders. The average assets to equity ratio of the company is 2.26,
which indicates that the company is wisely trading on the equity.
Conclusion
From the above discussion it can be concluded that the company frank all American
barbeque has performed well and it will make further growth in the future also.

5RATIO ANALYSIS OF FRANK ALL AMERICAN BARBEQUE
Reference
Easton, M. and Sommers, Z., 2018. Financial Statement Analysis & Valuation, 5e.
Muritala, T.A., 2018. An empirical analysis of capital structure on firms’ performance in
Nigeria. IJAME.
Reference
Easton, M. and Sommers, Z., 2018. Financial Statement Analysis & Valuation, 5e.
Muritala, T.A., 2018. An empirical analysis of capital structure on firms’ performance in
Nigeria. IJAME.
1 out of 6
Related Documents

Your All-in-One AI-Powered Toolkit for Academic Success.
+13062052269
info@desklib.com
Available 24*7 on WhatsApp / Email
Unlock your academic potential
© 2024 | Zucol Services PVT LTD | All rights reserved.