Detailed Financial Analysis of Frank's All-Time Barbeque: A Case Study

Verified

Added on  2021/01/01

|3
|525
|248
Case Study
AI Summary
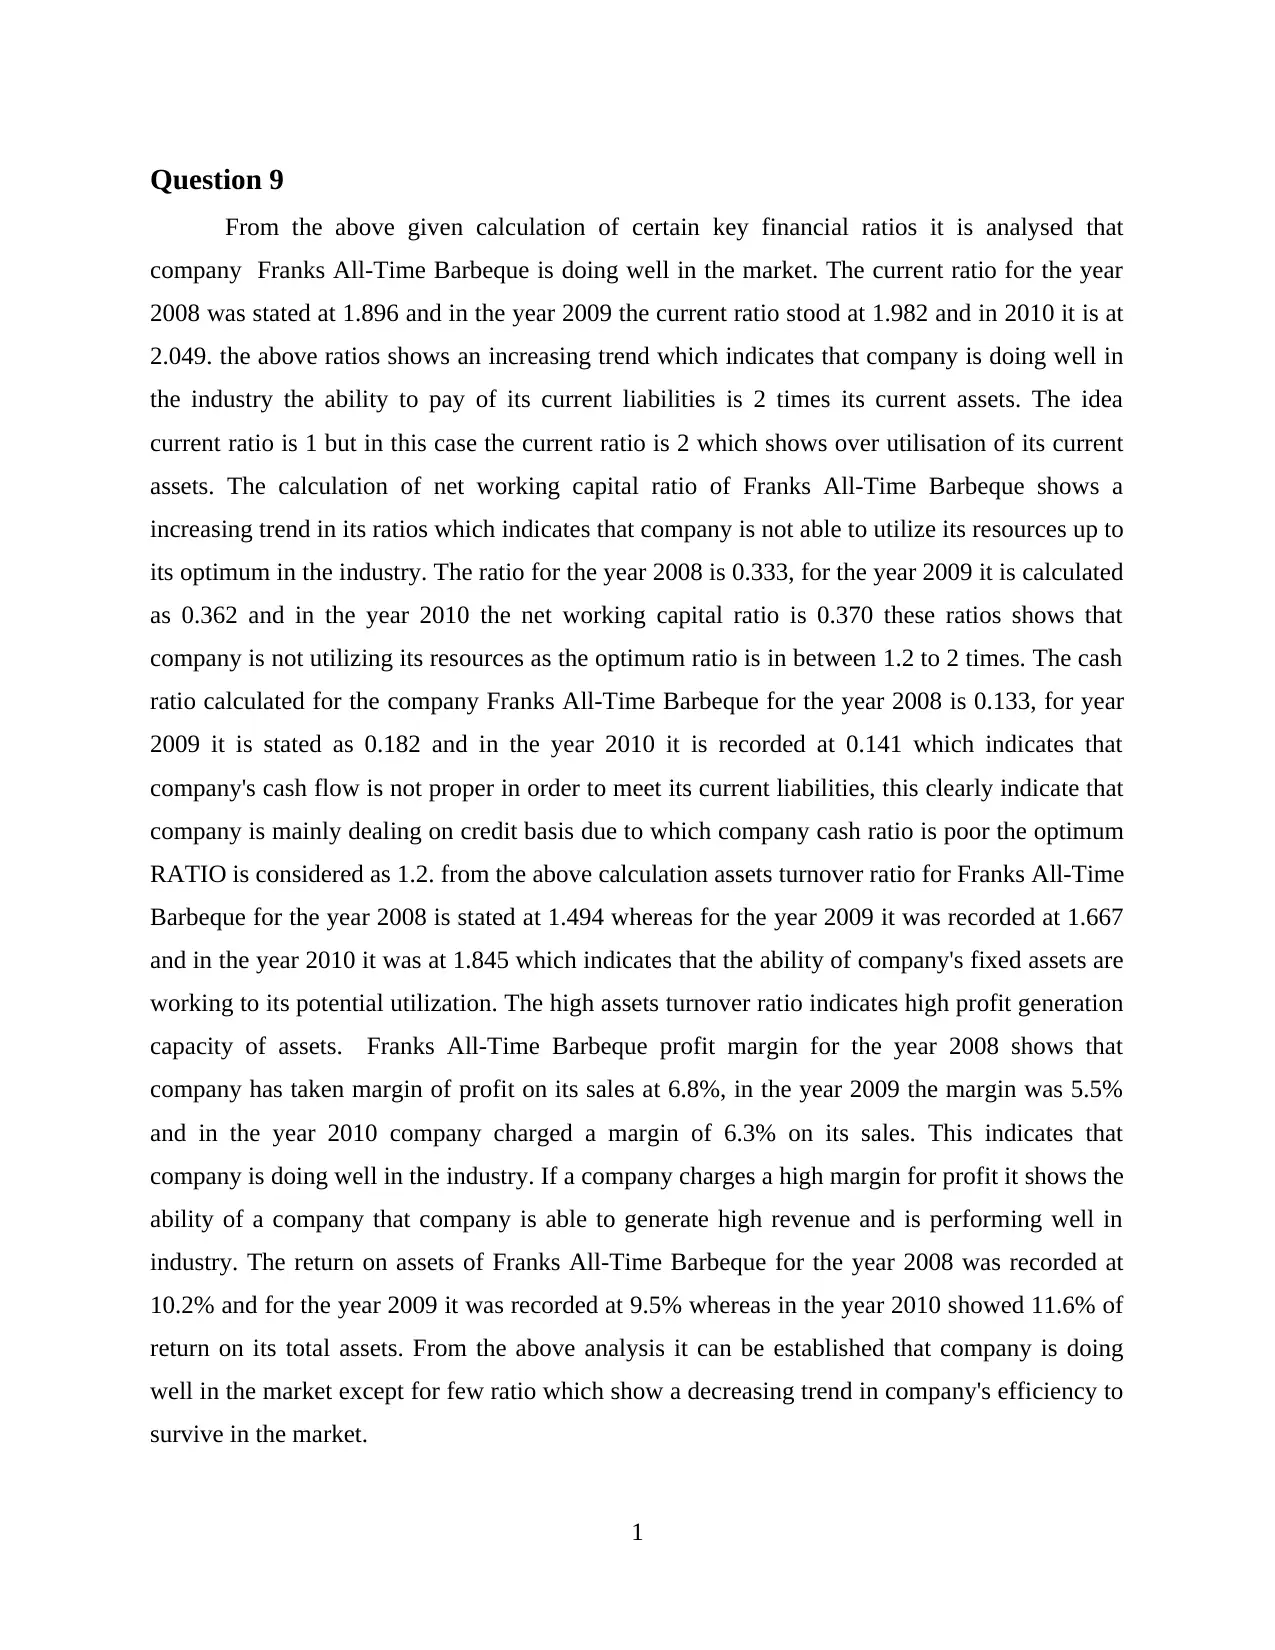
The assignment is a financial case study analyzing the performance of Frank's All-Time Barbeque from 2008 to 2010. It examines key financial ratios, including current, working capital, cash, asset turnover, profit margin, and return on assets. The analysis reveals that the company generally demonstrates a strong financial position, with increasing current ratios and a high asset turnover ratio, indicating efficient asset utilization and profitability. However, the analysis also notes some areas of concern, such as a lower cash ratio, suggesting reliance on credit. The case study highlights the company's ability to generate high revenue and its overall performance in the market, while also pointing out potential areas for improvement and strategic focus. This assignment provides insights into the financial health and operational efficiency of Frank's All-Time Barbeque.
tabler-icon-diamond-filled.svg

Contribute Materials

Your contribution can guide someone’s learning journey. Share your documents today.
Document Page
Business Case Study
tabler-icon-diamond-filled.svg

Secure Best Marks with AI Grader

Need help grading? Try our AI Grader for instant feedback on your assignments.
Document Page
Table of Contents
INTRODUCTION...........................................................................................................................1
Document Page
Question 9
From the above given calculation of certain key financial ratios it is analysed that
company Franks All-Time Barbeque is doing well in the market. The current ratio for the year
2008 was stated at 1.896 and in the year 2009 the current ratio stood at 1.982 and in 2010 it is at
2.049. the above ratios shows an increasing trend which indicates that company is doing well in
the industry the ability to pay of its current liabilities is 2 times its current assets. The idea
current ratio is 1 but in this case the current ratio is 2 which shows over utilisation of its current
assets. The calculation of net working capital ratio of Franks All-Time Barbeque shows a
increasing trend in its ratios which indicates that company is not able to utilize its resources up to
its optimum in the industry. The ratio for the year 2008 is 0.333, for the year 2009 it is calculated
as 0.362 and in the year 2010 the net working capital ratio is 0.370 these ratios shows that
company is not utilizing its resources as the optimum ratio is in between 1.2 to 2 times. The cash
ratio calculated for the company Franks All-Time Barbeque for the year 2008 is 0.133, for year
2009 it is stated as 0.182 and in the year 2010 it is recorded at 0.141 which indicates that
company's cash flow is not proper in order to meet its current liabilities, this clearly indicate that
company is mainly dealing on credit basis due to which company cash ratio is poor the optimum
RATIO is considered as 1.2. from the above calculation assets turnover ratio for Franks All-Time
Barbeque for the year 2008 is stated at 1.494 whereas for the year 2009 it was recorded at 1.667
and in the year 2010 it was at 1.845 which indicates that the ability of company's fixed assets are
working to its potential utilization. The high assets turnover ratio indicates high profit generation
capacity of assets. Franks All-Time Barbeque profit margin for the year 2008 shows that
company has taken margin of profit on its sales at 6.8%, in the year 2009 the margin was 5.5%
and in the year 2010 company charged a margin of 6.3% on its sales. This indicates that
company is doing well in the industry. If a company charges a high margin for profit it shows the
ability of a company that company is able to generate high revenue and is performing well in
industry. The return on assets of Franks All-Time Barbeque for the year 2008 was recorded at
10.2% and for the year 2009 it was recorded at 9.5% whereas in the year 2010 showed 11.6% of
return on its total assets. From the above analysis it can be established that company is doing
well in the market except for few ratio which show a decreasing trend in company's efficiency to
survive in the market.
1
chevron_up_icon
1 out of 3
circle_padding
hide_on_mobile
zoom_out_icon
logo.png

Your All-in-One AI-Powered Toolkit for Academic Success.

Available 24*7 on WhatsApp / Email

[object Object]