Free School Meals in UK Schools: A Comprehensive Data Analysis Report

Verified

Added on  2021/02/20

|2
|501
|73
Report
AI Summary
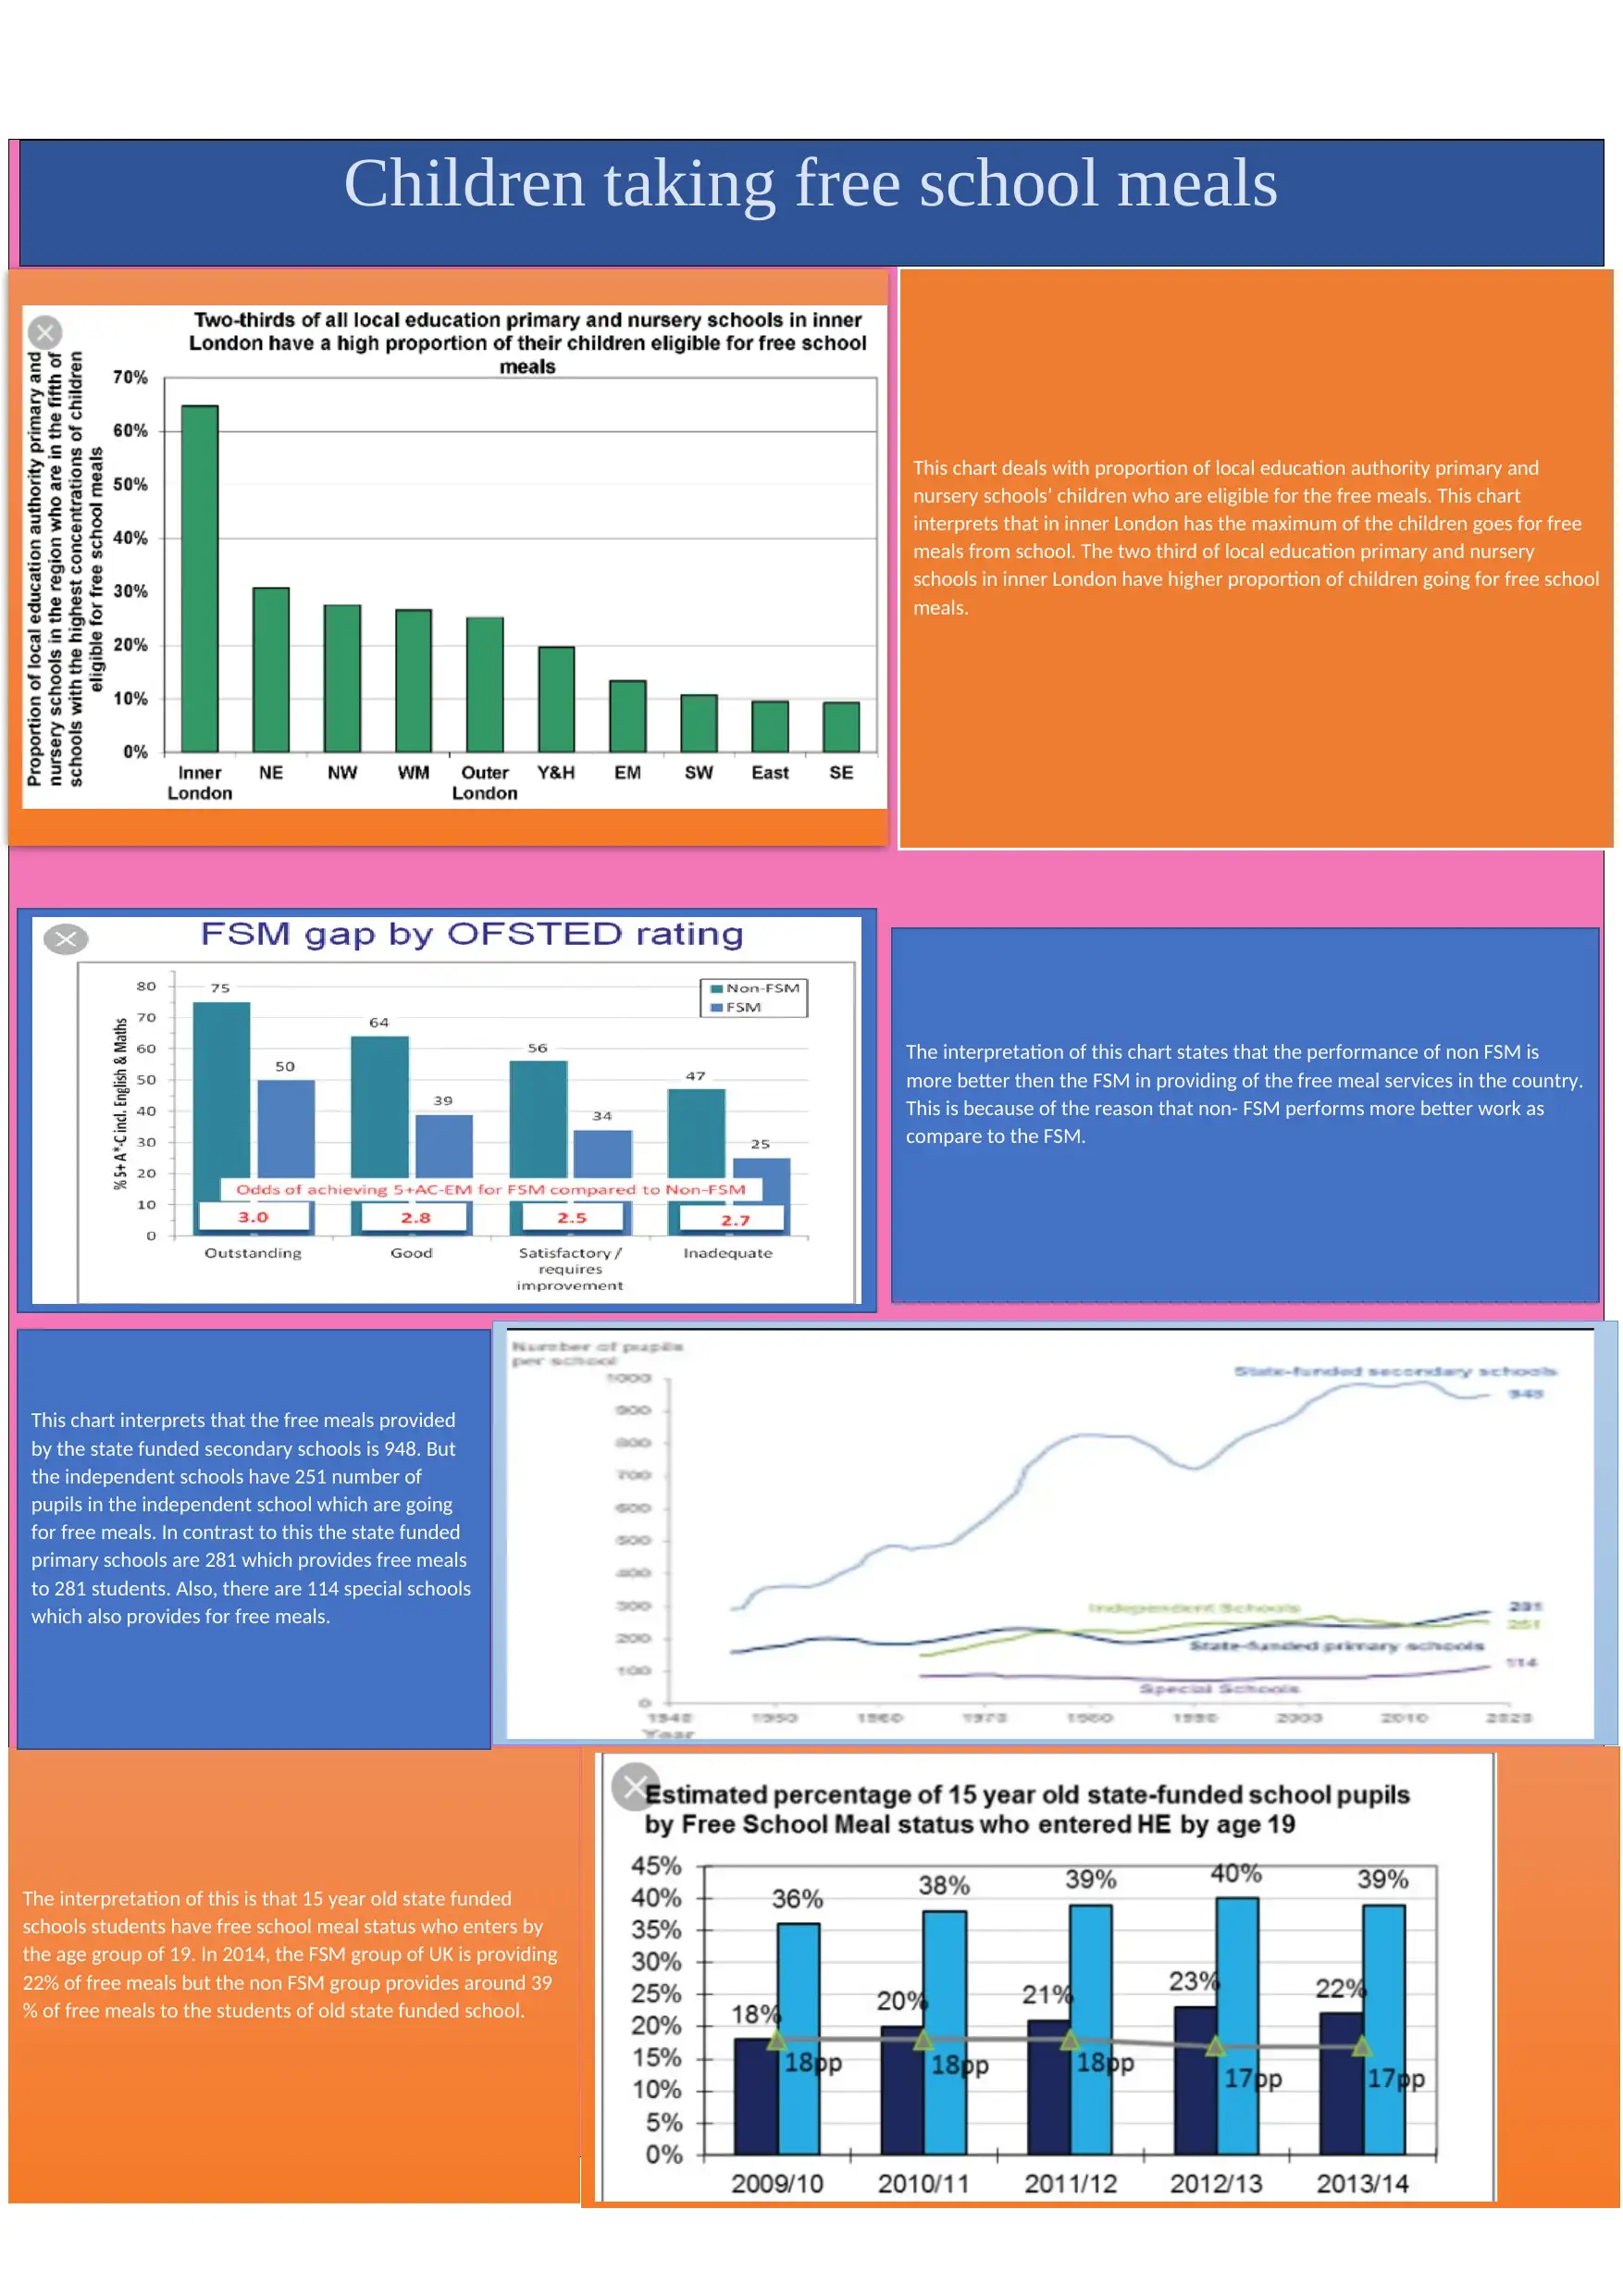
This report analyzes data related to free school meals (FSM) in the UK, examining the proportion of children eligible for free meals in local education authority primary and nursery schools. The analysis reveals that inner London has the highest proportion of children receiving free meals. The report compares the performance of FSM and non-FSM schools, highlighting differences in meal provision. Data includes the number of pupils receiving free meals in state-funded secondary schools, independent schools, state-funded primary schools, and special schools. The report also examines the percentage of free meals provided to 15-year-old students and compares FSM and non-FSM groups in 2014.
tabler-icon-diamond-filled.svg

Contribute Materials

Your contribution can guide someone’s learning journey. Share your documents today.
Document Page
Children taking free school meals
The interpretation of this is that 15 year old state funded
schools students have free school meal status who enters by
the age group of 19. In 2014, the FSM group of UK is providing
22% of free meals but the non FSM group provides around 39
% of free meals to the students of old state funded school.
This chart deals with proportion of local education authority primary and
nursery schools’ children who are eligible for the free meals. This chart
interprets that in inner London has the maximum of the children goes for free
meals from school. The two third of local education primary and nursery
schools in inner London have higher proportion of children going for free school
meals.
This chart interprets that the free meals provided
by the state funded secondary schools is 948. But
the independent schools have 251 number of
pupils in the independent school which are going
for free meals. In contrast to this the state funded
primary schools are 281 which provides free meals
to 281 students. Also, there are 114 special schools
which also provides for free meals.
The interpretation of this chart states that the performance of non FSM is
more better then the FSM in providing of the free meal services in the country.
This is because of the reason that non- FSM performs more better work as
compare to the FSM.
tabler-icon-diamond-filled.svg

Secure Best Marks with AI Grader

Need help grading? Try our AI Grader for instant feedback on your assignments.
Document Page
chevron_up_icon
1 out of 2
circle_padding
hide_on_mobile
zoom_out_icon
logo.png

Your All-in-One AI-Powered Toolkit for Academic Success.

Available 24*7 on WhatsApp / Email

[object Object]