Essay on Frequency Distribution: Organizing and Analyzing Data

Verified

Added on  2022/11/13

|6
|1190
|319
Essay
AI Summary
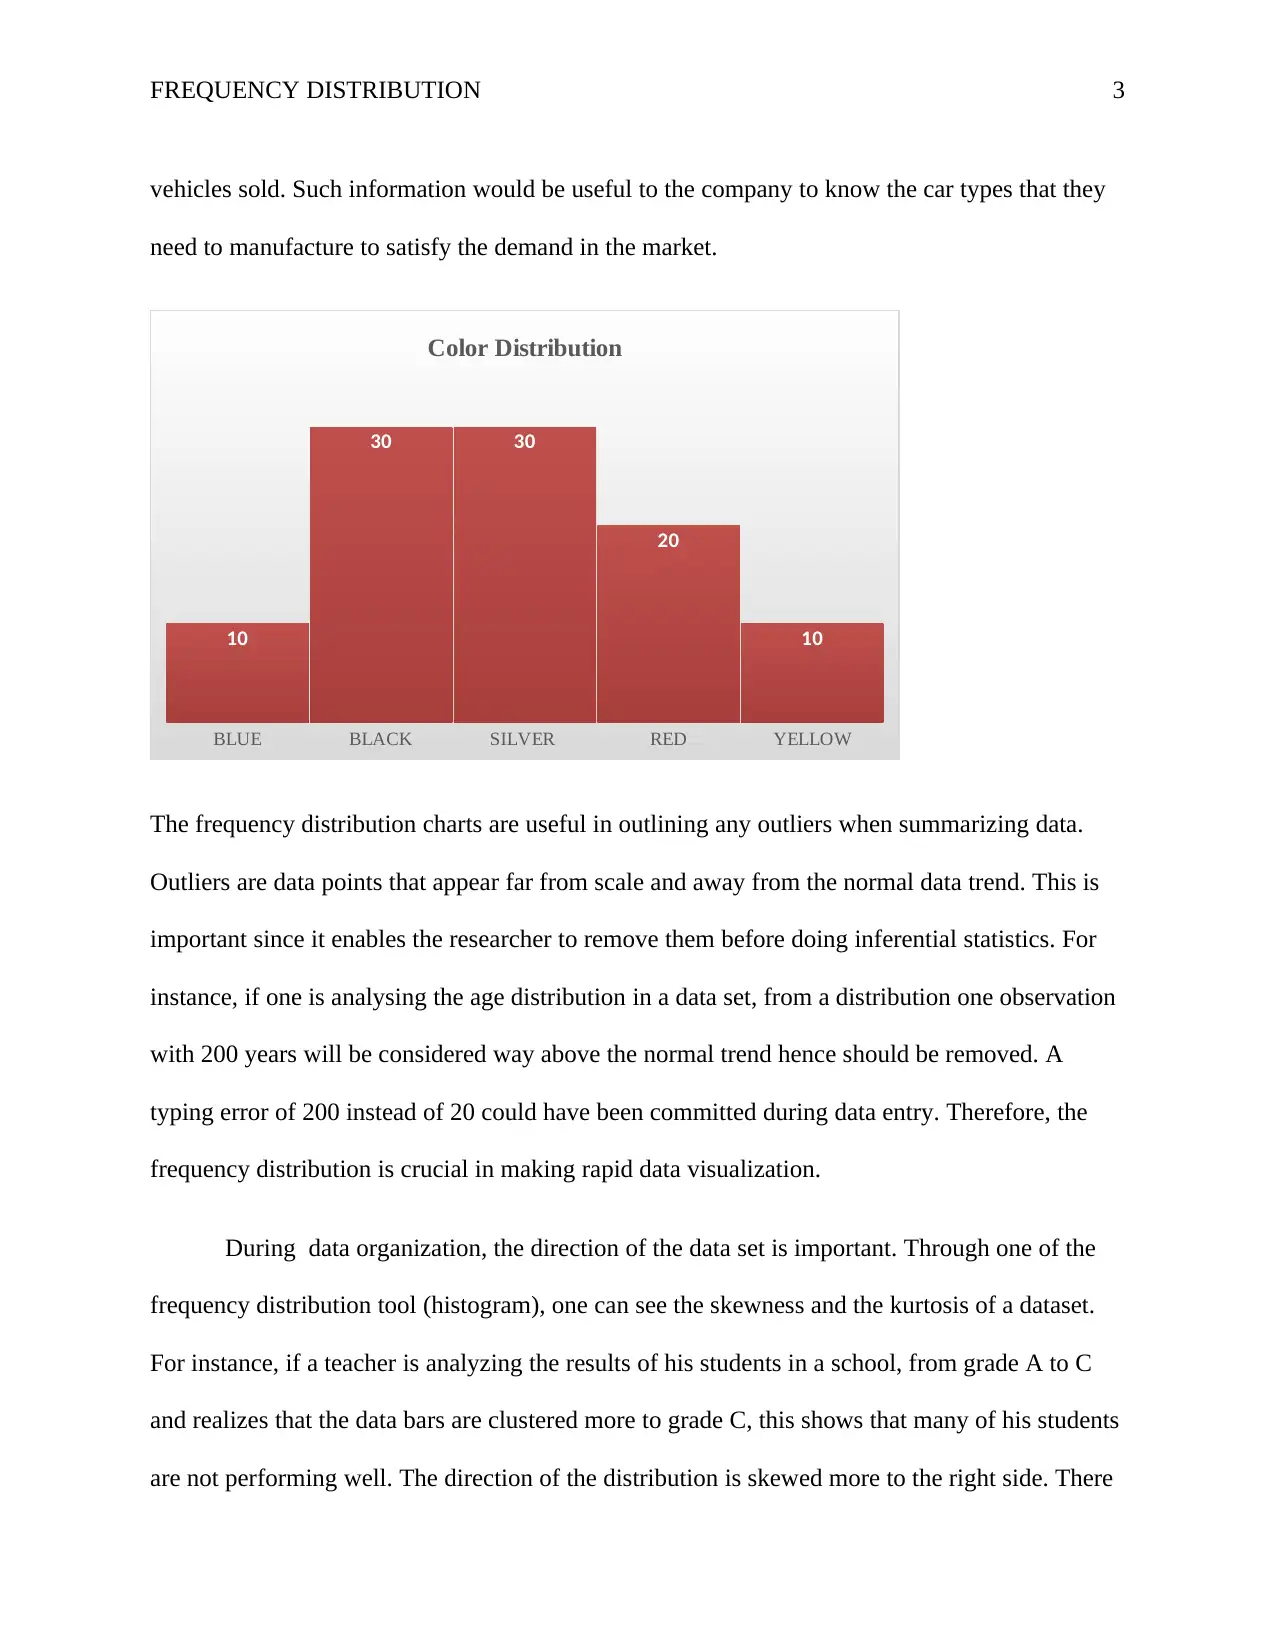
This essay explores the concept of frequency distribution as a crucial tool for organizing, analyzing, and interpreting large datasets. It defines frequency distribution as a summary of data showing the number of times a given observation appears, highlighting different types such as grouped, ungrouped, cumulative, relative, and relative cumulative distributions. The essay emphasizes the significance of frequency distributions in revealing patterns, identifying outliers, and assessing data skewness and kurtosis, using examples like analyzing vehicle color preferences. It also discusses the use of visual representations like histograms, pie charts, and line graphs for easier data understanding and interpretation. The essay further underscores the role of frequency distribution in descriptive statistics, ensuring data correctness before in-depth analysis, and its importance in determining the normality of data distribution, influencing the choice of statistical tests. The essay concludes by reinforcing the essential role of frequency distribution in organizing and preparing any dataset for meaningful insights.
Document Page
Running head: FREQUENCY DISTRIBUTION 1
Frequency Distribution
Student Name
Institution
tabler-icon-diamond-filled.svg

Paraphrase This Document

Need a fresh take? Get an instant paraphrase of this document with our AI Paraphraser
Document Page
FREQUENCY DISTRIBUTION 2
Frequency Distribution
In everyday large sets of data are collected by various researchers and firms on different
aspects of life across different industries. These large amounts of data need to be entered in the
databases, cleaned, analyzed and interpretation made to create meaningful conclusions. Huge
data sets can create problems to organizations since it is not easy to interpret them. Therefore,
industries must invest in human resource and technologies that can organize and summarize
large amounts of data to reveal any kind of patterns and relationships found using various data
analysis software such as; Excel, SPSS, R, STATA, SAS, MINITAB among others. These
patterns and summaries are then interpreted for industries to make decisions.
According to Cox (2018), the frequency distribution is one way of organizing large
amounts of data. A frequency distribution is a summary of data showing the number of times that
a given observation appears in a dataset. These summaries are done after creating categories and
ranges of the data variable in question. There exist different types of a frequency distribution;
grouped, ungrouped, cumulative, relative and relative cumulative frequency distributions
(Chambers, 2017). These distributions utilize tables, bar graphs, histograms, frequency polygon
to display the data summaries.
Frequency distributions are of great importance since they make it possible and easy to
organize and make a detailed analysis of a given structure of a population. Data is grouped and
from this, the degree of concentrations of the data is generalized into either symmetric or
asymmetric. In other words it useful in showing the shape any given data has.
For instance, assuming a researcher collected data on the colors of 100 vehicles that were sold
from a showroom in country X. The data can be organized and presented to show the most
popular color and its distribution. The figure below shows a summary of the colors of the
Document Page
FREQUENCY DISTRIBUTION 3
vehicles sold. Such information would be useful to the company to know the car types that they
need to manufacture to satisfy the demand in the market.
BLUE BLACK SILVER RED YELLOW
10
30 30
20
10
Color Distribution
The frequency distribution charts are useful in outlining any outliers when summarizing data.
Outliers are data points that appear far from scale and away from the normal data trend. This is
important since it enables the researcher to remove them before doing inferential statistics. For
instance, if one is analysing the age distribution in a data set, from a distribution one observation
with 200 years will be considered way above the normal trend hence should be removed. A
typing error of 200 instead of 20 could have been committed during data entry. Therefore, the
frequency distribution is crucial in making rapid data visualization.
During data organization, the direction of the data set is important. Through one of the
frequency distribution tool (histogram), one can see the skewness and the kurtosis of a dataset.
For instance, if a teacher is analyzing the results of his students in a school, from grade A to C
and realizes that the data bars are clustered more to grade C, this shows that many of his students
are not performing well. The direction of the distribution is skewed more to the right side. There
Document Page
FREQUENCY DISTRIBUTION 4
is, therefore, need for this teacher to monitor the students more and ensure the grades are skewed
more towards grade A.
As seen above, there are various ways that data can be presented in a distribution. Some
of the methods of frequency distribution provide a graphical presentation of data. This gives the
user an easier time to understand and interpret the data analyzed. Visual displays in histograms,
pie chart and bar charts can be easily understood by users with little or no mathematical
background.
Line graphs can identify the changes that are occurring in a dataset over a short or long
period. They can be used to compare the changes that occur in a similar period taken for more
than one particular group. For instance, an investor can be able to check the trend of a stock over
a while to decide on whether to invest in it. The line graph can create a simple trend analysis that
can be used to make decisions of high-cost implications. This data could be for several years but
presented simply and clearly. Frequency distributed is therefore useful in such areas to show the
trend of data. They can also be used in forecasting and helping a firm to plan. From a line graph,
the management can see the worst performing periods even before the end of the financial year
and hence fix them in advance.
Descriptive statistics and analysis of patterns are carried out before in-depth data analysis
is done (Johnson & Bhattacharyya,2019). During the analysis of patterns, frequency distributions
are useful since they provide a background on the correctness and validity of the tests to be
carried out before inferential statistics. They can flush out outliers, and abnormal patterns that
can be corrected by a researcher before in-depth analysis. This, therefore, will save on cost and
time that would be wasted on corrections and publishing of papers that are not correct. For
tabler-icon-diamond-filled.svg

Paraphrase This Document

Need a fresh take? Get an instant paraphrase of this document with our AI Paraphraser
Document Page
FREQUENCY DISTRIBUTION 5
instance, if a researcher is measuring the heights of students in a school, considering entry of a
student height of say 5metres. When analyzing the mean height, this observation will result in a
higher figure of the average height. This will result in incorrect conclusions. Therefore, running
of the frequency distribution will provide a platform where the researcher does a ‘postmortem' of
the correctness of their data.
Lastly, the frequency distribution is very important in organizing of any dataset. It can
easily point out if data is normally distributed by forming a bell-shaped curve on the graph
drawn. (Groebner & Smith, 2013). This is one of the assumptions that must be met before
carrying out of some parametric tests. Non-normality will point out that the researcher should
carry out non-parametric tests.
Document Page
FREQUENCY DISTRIBUTION 6
References
Chambers, J. M. (2017). Graphical methods for data analysis: 0. Chapman and Hall/CRC.
Cox, D. R. (2018). Applied statistics-principles and examples. Routledge.
Groebner, D. F., Shannon, P. W., Fry, P. C., & Smith, K. D. (2013). Business statistics. Pearson
Education UK.
Johnson, R. A., & Bhattacharyya, G. K. (2019). Statistics: principles and methods. John Wiley &
Sons.
chevron_up_icon
1 out of 6
circle_padding
hide_on_mobile
zoom_out_icon
[object Object]