MATH 200 Statistics: Analyzing Frequency Distributions Case Assignment

Verified

Added on  2019/09/23

|3
|720
|309
Homework Assignment
AI Summary
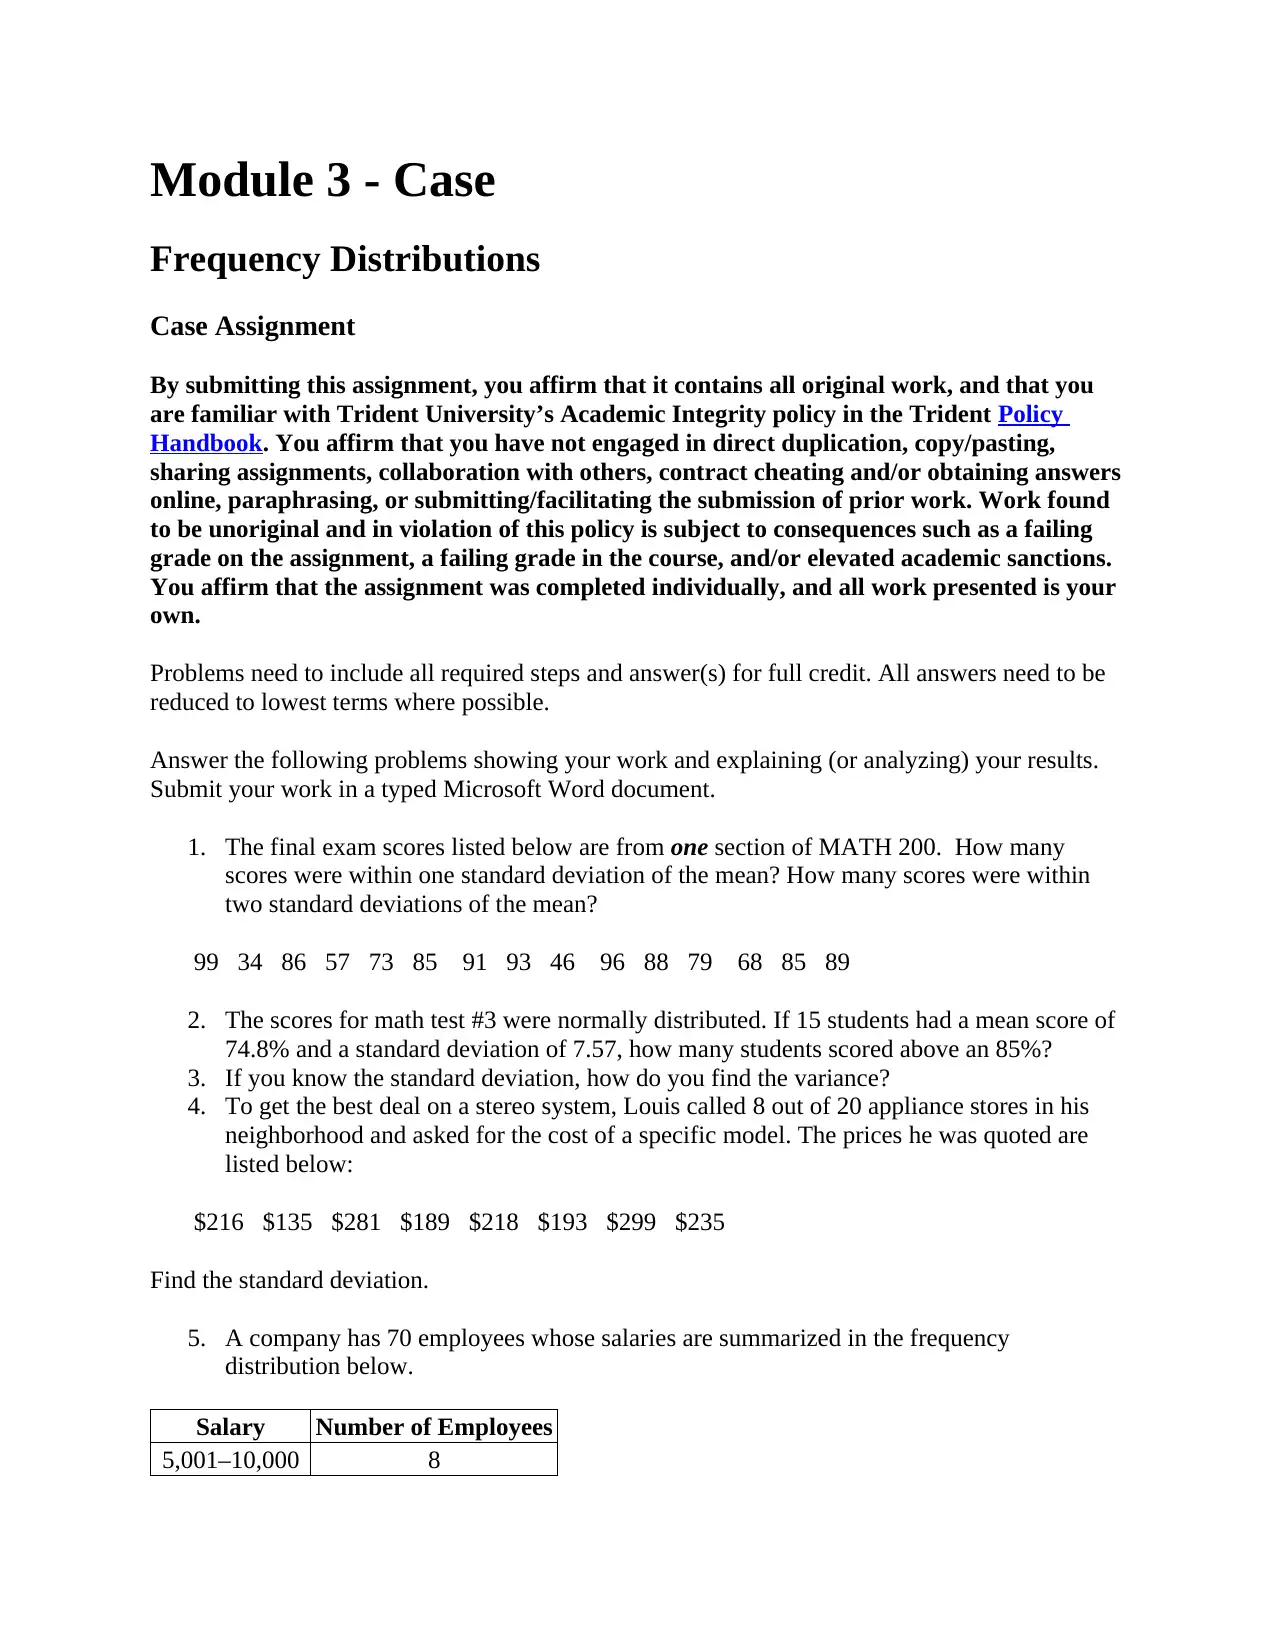
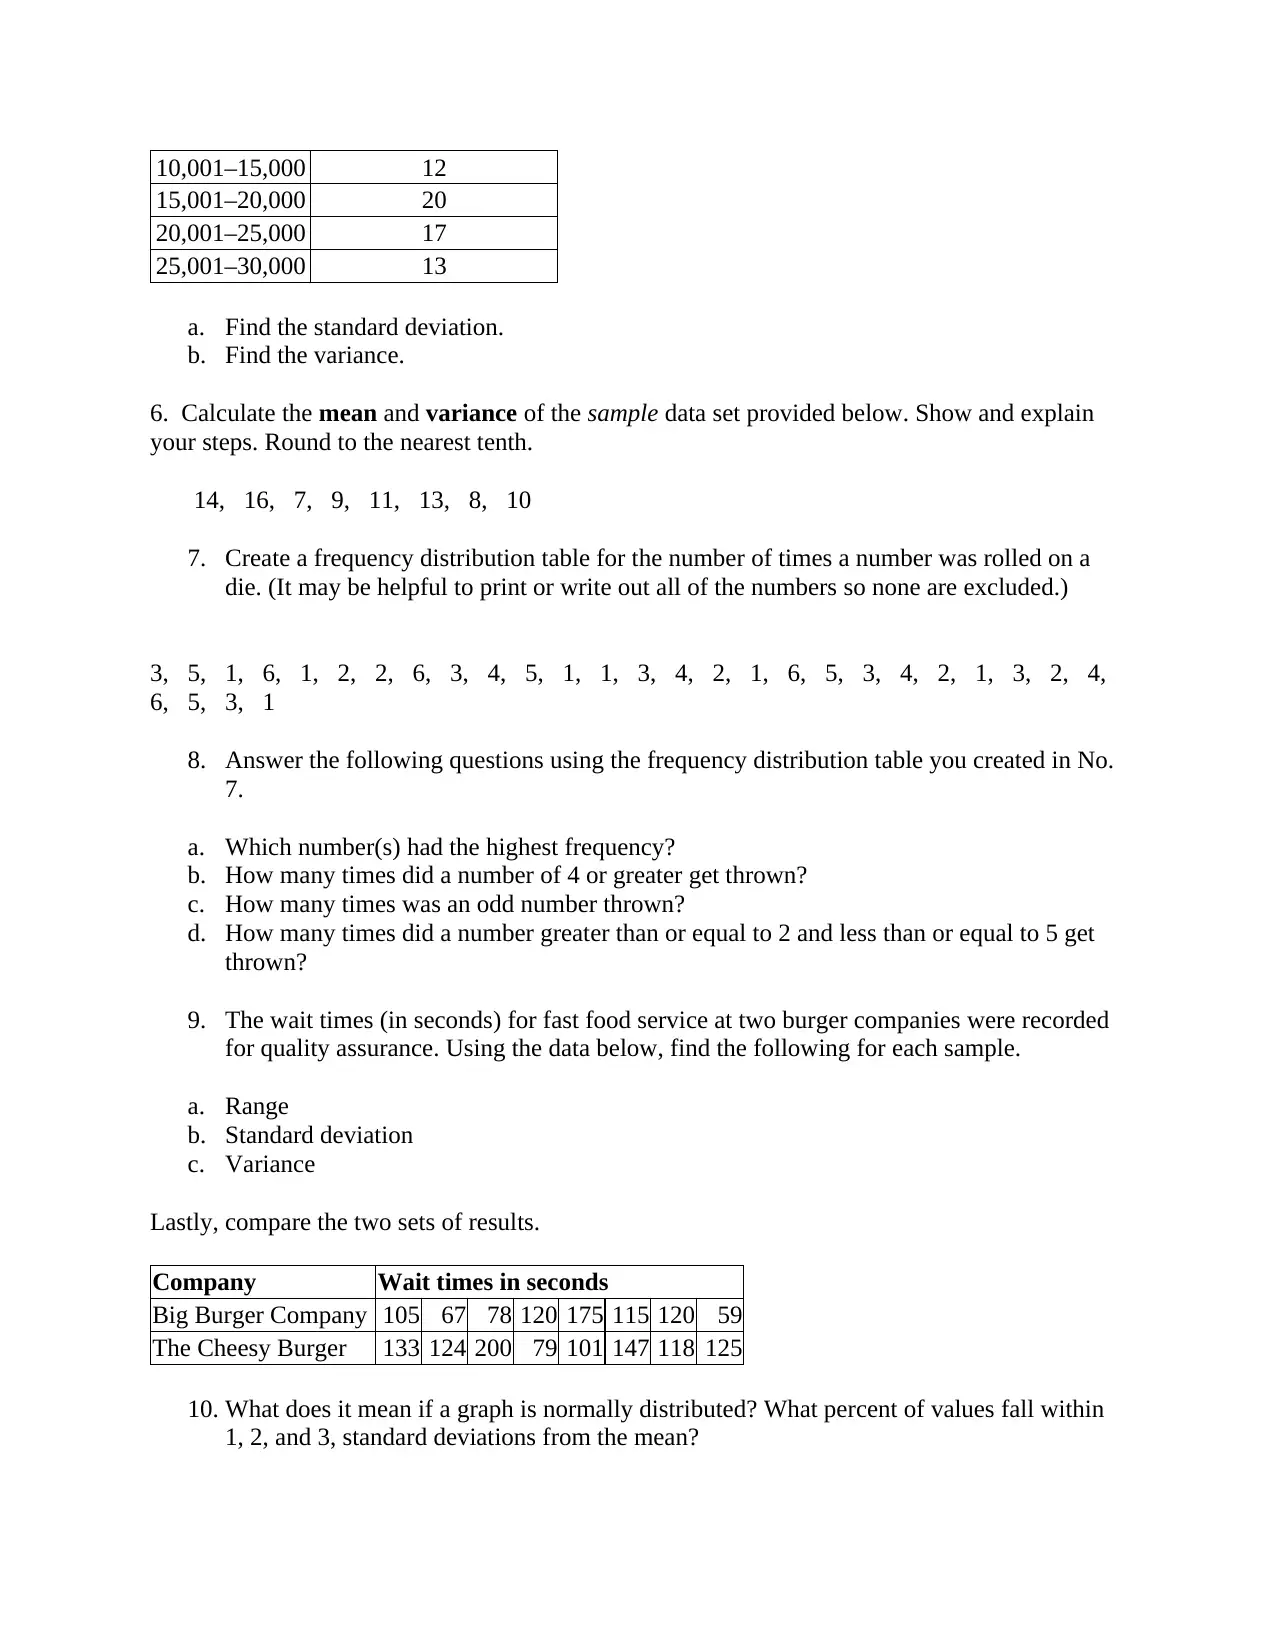
This assignment focuses on the analysis of frequency distributions and statistical concepts. It includes problems involving calculating standard deviation, variance, and mean from given datasets, as well as interpreting normally distributed data. The assignment covers various scenarios, such as analyzing test scores, salary distributions, and wait times. Students are required to create frequency distribution tables, answer questions based on them, and compare the results of different datasets. Additionally, the assignment explores the properties of normal distributions and the percentage of values falling within specific standard deviations from the mean. The solutions provided offer step-by-step explanations and analysis to enhance understanding of statistical principles.
Document Page
Module 3 - Case
Frequency Distributions
Case Assignment
By submitting this assignment, you affirm that it contains all original work, and that you
are familiar with Trident University’s Academic Integrity policy in the Trident Policy
Handbook. You affirm that you have not engaged in direct duplication, copy/pasting,
sharing assignments, collaboration with others, contract cheating and/or obtaining answers
online, paraphrasing, or submitting/facilitating the submission of prior work. Work found
to be unoriginal and in violation of this policy is subject to consequences such as a failing
grade on the assignment, a failing grade in the course, and/or elevated academic sanctions.
You affirm that the assignment was completed individually, and all work presented is your
own.
Problems need to include all required steps and answer(s) for full credit. All answers need to be
reduced to lowest terms where possible.
Answer the following problems showing your work and explaining (or analyzing) your results.
Submit your work in a typed Microsoft Word document.
1. The final exam scores listed below are from one section of MATH 200. How many
scores were within one standard deviation of the mean? How many scores were within
two standard deviations of the mean?
99 34 86 57 73 85 91 93 46 96 88 79 68 85 89
2. The scores for math test #3 were normally distributed. If 15 students had a mean score of
74.8% and a standard deviation of 7.57, how many students scored above an 85%?
3. If you know the standard deviation, how do you find the variance?
4. To get the best deal on a stereo system, Louis called 8 out of 20 appliance stores in his
neighborhood and asked for the cost of a specific model. The prices he was quoted are
listed below:
$216 $135 $281 $189 $218 $193 $299 $235
Find the standard deviation.
5. A company has 70 employees whose salaries are summarized in the frequency
distribution below.
Salary Number of Employees
5,001–10,000 8
tabler-icon-diamond-filled.svg

Paraphrase This Document

Need a fresh take? Get an instant paraphrase of this document with our AI Paraphraser
Document Page
10,001–15,000 12
15,001–20,000 20
20,001–25,000 17
25,001–30,000 13
a. Find the standard deviation.
b. Find the variance.
6. Calculate the mean and variance of the sample data set provided below. Show and explain
your steps. Round to the nearest tenth.
14, 16, 7, 9, 11, 13, 8, 10
7. Create a frequency distribution table for the number of times a number was rolled on a
die. (It may be helpful to print or write out all of the numbers so none are excluded.)
3, 5, 1, 6, 1, 2, 2, 6, 3, 4, 5, 1, 1, 3, 4, 2, 1, 6, 5, 3, 4, 2, 1, 3, 2, 4,
6, 5, 3, 1
8. Answer the following questions using the frequency distribution table you created in No.
7.
a. Which number(s) had the highest frequency?
b. How many times did a number of 4 or greater get thrown?
c. How many times was an odd number thrown?
d. How many times did a number greater than or equal to 2 and less than or equal to 5 get
thrown?
9. The wait times (in seconds) for fast food service at two burger companies were recorded
for quality assurance. Using the data below, find the following for each sample.
a. Range
b. Standard deviation
c. Variance
Lastly, compare the two sets of results.
Company Wait times in seconds
Big Burger Company 105 67 78 120 175 115 120 59
The Cheesy Burger 133 124 200 79 101 147 118 125
10. What does it mean if a graph is normally distributed? What percent of values fall within
1, 2, and 3, standard deviations from the mean?
Document Page
Submit your work by the module due date. If you are having difficulty, please contact your
professor.
chevron_up_icon
1 out of 3
circle_padding
hide_on_mobile
zoom_out_icon
[object Object]