Fresnillo Plc: Assessment of Risk and Global Financial Strategies
VerifiedAdded on 2020/06/06
|27
|4334
|120
Report
AI Summary
This report offers a comprehensive analysis of Fresnillo Plc's financial strategy, focusing on risk management and global expansion. Part A examines key investment attractions in foreign countries like Indonesia, China, and Brazil, highlighting the benefits of economies of scale, skilled labor, and tax concessions. It then reviews Fresnillo's five-year performance across different geographic locations (Zacatecas, Durango, and Sonora), assessing revenue and profit trends to identify growth areas and potential risks. The report also explores how Fresnillo manages exchange rate, market, and commodity risks, with an analysis of GBP/MXN exchange rate fluctuations. Part B includes financial calculations related to net sterling receipts/payments and money market analysis. Overall, the report provides valuable insights into Fresnillo's financial performance, risk mitigation strategies, and future growth prospects within the precious metals mining industry. The competitor analysis included, compares Fresnillo with Barrick Gold Corporation and Dowa Holdings Co Ltd.

Fresnillo Risk & Global Financial Strategy
Paraphrase This Document
Need a fresh take? Get an instant paraphrase of this document with our AI Paraphraser
TABLE OF CONTENTS
PART A...........................................................................................................................................3
INTRODUCTION...........................................................................................................................3
1. Assessing key attractions for Fresnillo investing in foreign countries....................................3
2. Reviewing 5 years trend of Fresnillo and presenting the areas of business which is likely to
grow.............................................................................................................................................4
3. Stating the manner in which company is managing its exchange, market and commodity
risk.............................................................................................................................................11
CONCLUSION..............................................................................................................................16
PART B.........................................................................................................................................16
a. Calculating net sterling receipts / payments..........................................................................16
2. Money market........................................................................................................................18
B.................................................................................................................................................19
b.................................................................................................................................................20
b: Computing forward and future value.....................................................................................20
REFERENCES..............................................................................................................................23
APPENDIX....................................................................................................................................25
1. Share prices of Fresnillo Plc..................................................................................................25
PART A
INTRODUCTION
In the present times, business units are encouraged to trade or perform activities at global
level with the motive to enhance customer base and profit margin. Hence, when business unit
operates globally then it has to face several risks in relation to exchange rate, commodity
fluctuations etc. In this, firm requires sound and strategic framework which provides assistance
to it in performing activities more effectually. Moreover, the main motive of company behind
global expansion is to enhance market share and profit margin. Thus, by preparing competent
framework company can make contribution in the attainment of goals. The present report is
based on Fresnillo Plc, Mexican company, which is one of the leading precious metal mining
firms incorporated in UK. Fresnillo has attained leading position in world under the category of
silver and gold mining. In this, report will shed light on the attraction points for Fresnillo in
relation to FDI. Besides this, it will also highlight the business segment of the company which is
highly growing. Along with this, report will provide deeper insight about how effectively
Fresnillo is managing risks.
1. Assessing key attractions for Fresnillo investing in foreign countries
From assessment, it has found that from investment perspective in the mining sector there
are several countries in which Fresnillo can invest such as Insdonesia, China, Brazil etc. All such
are the main countries in which Fresnillo can explore its business operations and functions.
When business unit expands its operations and functions at global level then it gets several
benefits in terms of high economies of scale, maximization of profitability, tax concessions and
availability of skilled personnel (Aliyu, Saleha, Jalila and Zunita, 2016). For mining activities
firm requires highly skilled and efficient individuals. Along with this, when business operates at
large level then it attains benefits in terms of cost reductions. All such aspects positively
contribute in the productivity and profitability aspect of firm. Countries which are recognized as
an attraction for foreign investment include following:
Indonesia: In Indonesia, political condition is highly stable which is one of the main
attraction point that entice foreign capital. Along with this, labour cost is also low in
⊘ This is a preview!⊘
Do you want full access?
Subscribe today to unlock all pages.
Trusted by 1+ million students worldwide
Indonesia which in turn places direct impact on profitability aspects in a positive manner.
Thus, by considering such aspects, it can be said that for the purpose of better mining and
maximizing profitability aspect Fresnillo should focus on expanding business operations
in such country.
China: From research, it has been asserted that China is number one producer of gold in
the world. Further, cost of labour is low in China as compared to other countries and it
also has identified that economy of China will grow by 6.5% in the year of 2017. Cost is
one of the main factors that place significant impact on the profit margin of firm. On the
basis of such aspect, by employing skilled and low salaries workers Fresnillo can gain
benefits in monetary terms.
Brazil: Mining sector of Brazil has made significant contribution in the economic growth
and development (What drives the price of gold?, 2017). Forecasted results or estimations
show that GDP of Brazil will increase or grow by 2.2% at the end of 2018. Along with
this, Brazil provides investors with easy access pertaining to raw material. Further,
diversified economy exists in such country which in turn less vulnerable to international
monetary crisis.
By taking into account all the above mentioned aspects it can be stated that through investing
money in the countries like Brazil, China and Indonesia firm can get benefit in term of both
financial as well as non-financial.
2. Reviewing 5 years trend of Fresnillo and presenting the areas of business which is likely to
grow
Financial evaluation as per geographic location and business segment: On the basis of
cited case situation, turnover and profitability aspect of each location has been evaluated with the
motive to assess risk as well as business area which is highly growing. Such assessment is highly
significant which in turn provides deeper insight about the business entity about the area which is
contributing in organizational profitability (Allen, Macalady, Chenchouni, Bachelet, McDowell,
Vennetier, Kitzberger, Rigling, Breshears, Hogg and Gonzalez, 2010). Besides this, such
evaluation also clearly indicates the areas of business that impose risk in front of Fresnillon in
both monetary and non-monetary aspects. On the basis of geographic location aspects firm is
operated in Zacatecas, Durango, aned Sonora.
Paraphrase This Document
Need a fresh take? Get an instant paraphrase of this document with our AI Paraphraser
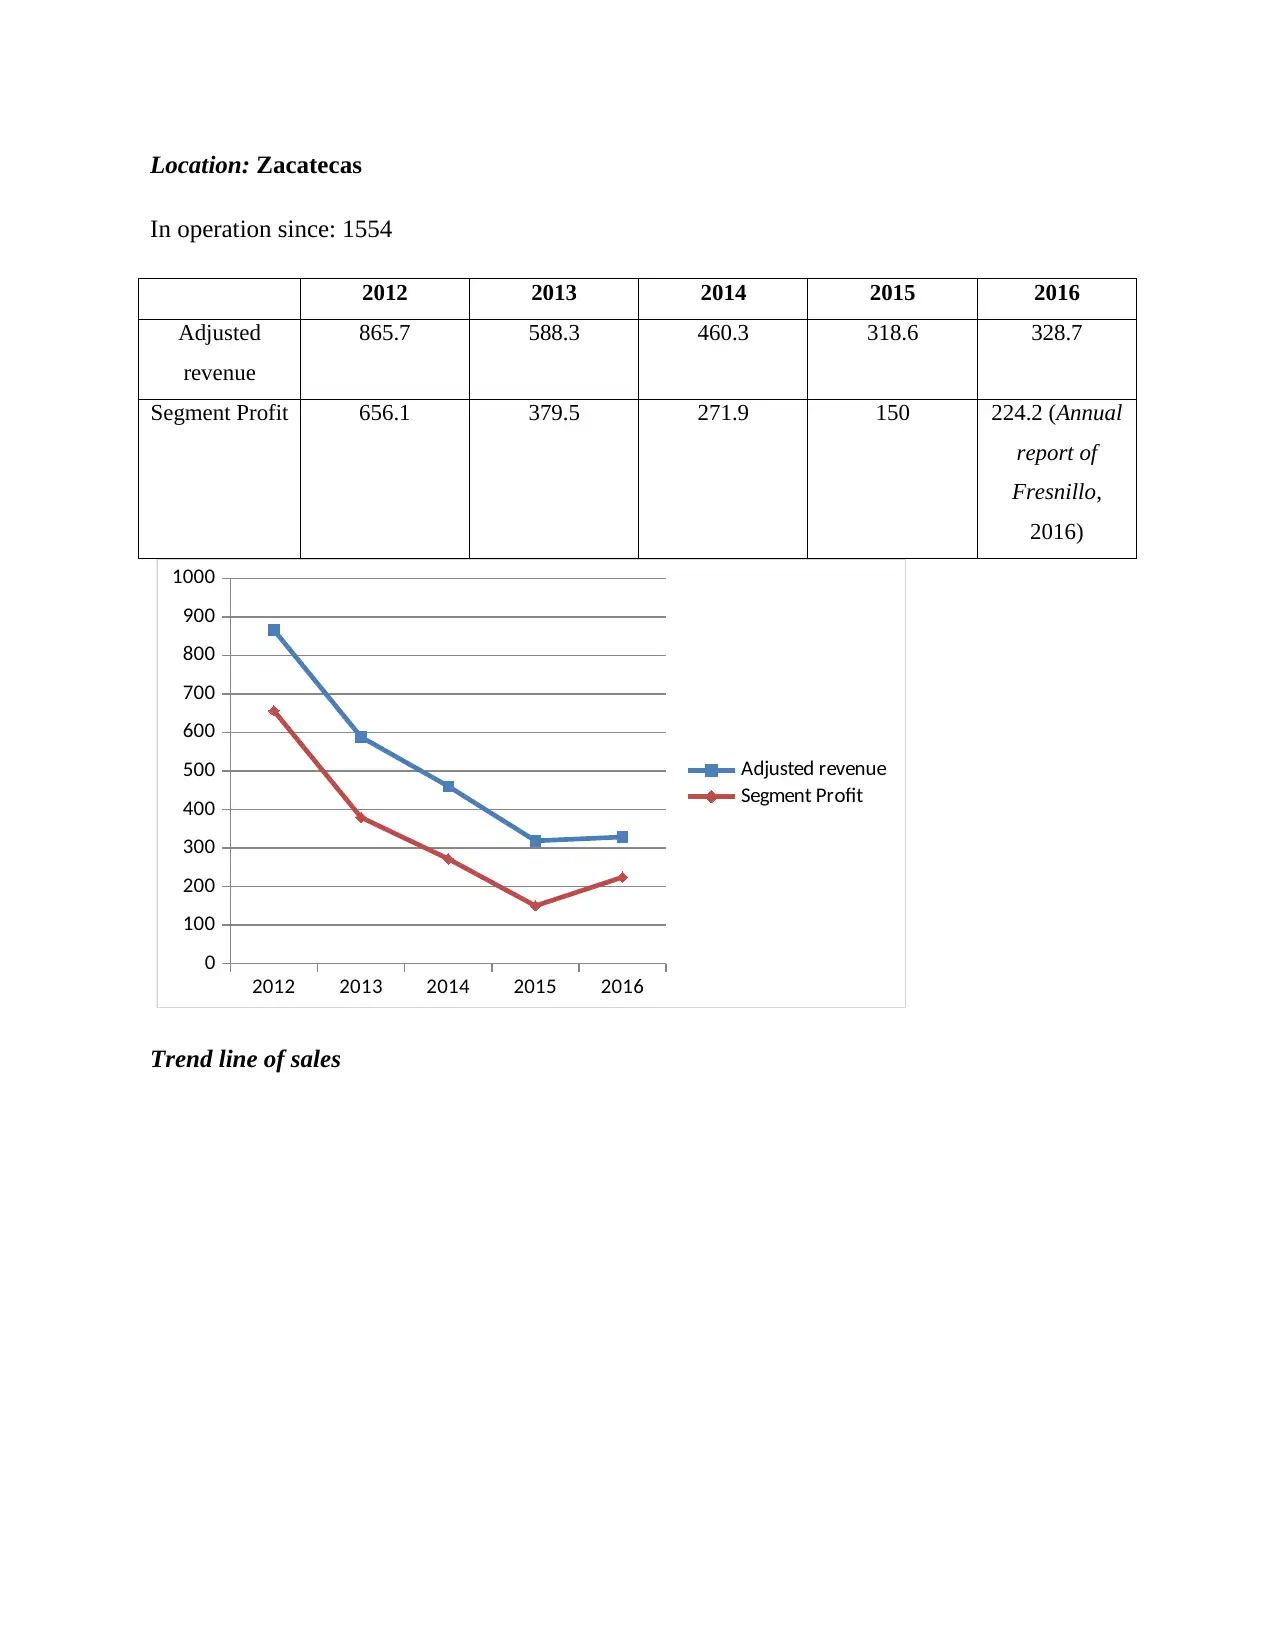
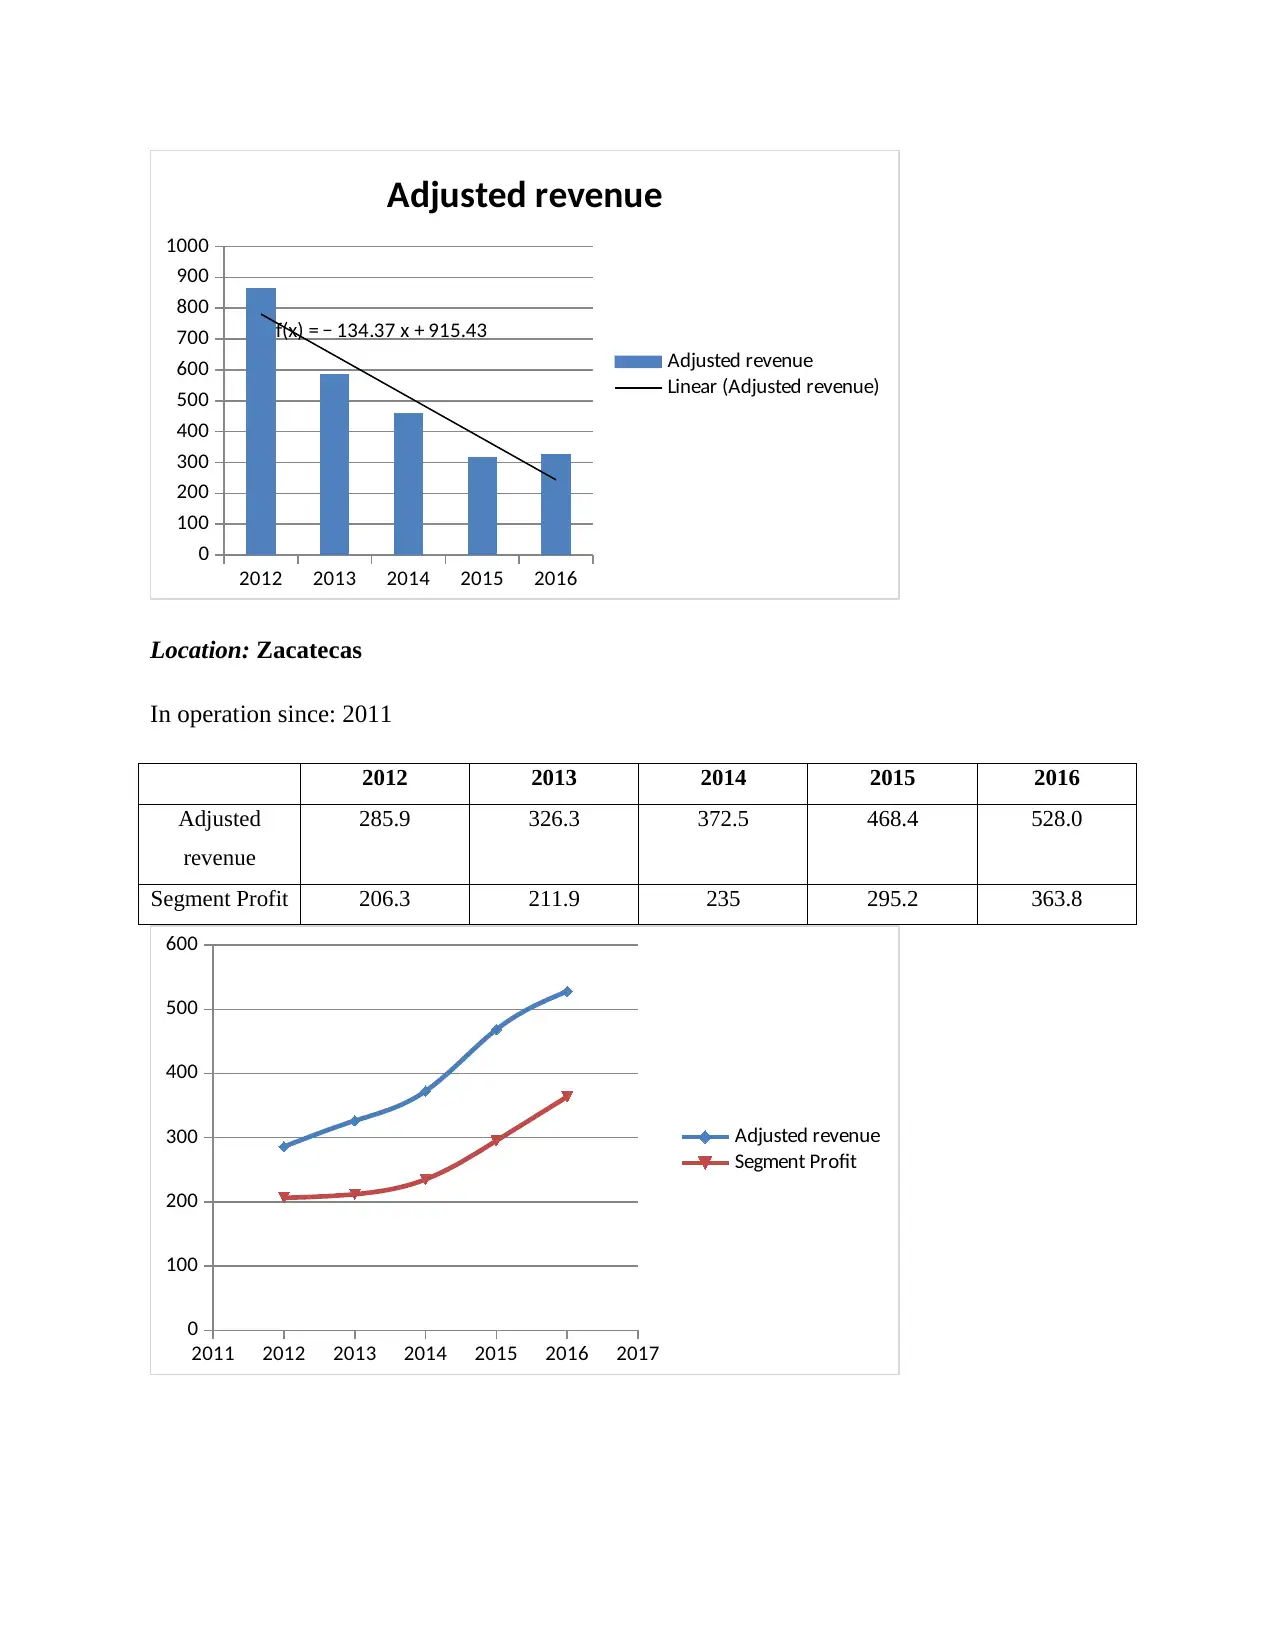
Location: Zacatecas
In operation since: 1554
2012 2013 2014 2015 2016
Adjusted
revenue
865.7 588.3 460.3 318.6 328.7
Segment Profit 656.1 379.5 271.9 150 224.2 (Annual
report of
Fresnillo,
2016)
2012 2013 2014 2015 2016
0
100
200
300
400
500
600
700
800
900
1000
Adjusted revenue
Segment Profit
Trend line of sales
In operation since: 1554
2012 2013 2014 2015 2016
Adjusted
revenue
865.7 588.3 460.3 318.6 328.7
Segment Profit 656.1 379.5 271.9 150 224.2 (Annual
report of
Fresnillo,
2016)
2012 2013 2014 2015 2016
0
100
200
300
400
500
600
700
800
900
1000
Adjusted revenue
Segment Profit
Trend line of sales
2012 2013 2014 2015 2016
0
100
200
300
400
500
600
700
800
900
1000
f(x) = − 134.37 x + 915.43
Adjusted revenue
Adjusted revenue
Linear (Adjusted revenue)
Location: Zacatecas
In operation since: 2011
2012 2013 2014 2015 2016
Adjusted
revenue
285.9 326.3 372.5 468.4 528.0
Segment Profit 206.3 211.9 235 295.2 363.8
2011 2012 2013 2014 2015 2016 2017
0
100
200
300
400
500
600
Adjusted revenue
Segment Profit
0
100
200
300
400
500
600
700
800
900
1000
f(x) = − 134.37 x + 915.43
Adjusted revenue
Adjusted revenue
Linear (Adjusted revenue)
Location: Zacatecas
In operation since: 2011
2012 2013 2014 2015 2016
Adjusted
revenue
285.9 326.3 372.5 468.4 528.0
Segment Profit 206.3 211.9 235 295.2 363.8
2011 2012 2013 2014 2015 2016 2017
0
100
200
300
400
500
600
Adjusted revenue
Segment Profit
⊘ This is a preview!⊘
Do you want full access?
Subscribe today to unlock all pages.
Trusted by 1+ million students worldwide
2012 2013 2014 2015 2016
0
100
200
300
400
500
600
f(x) = 62.63 x + 208.33
Adjusted revenue
Adjusted revenue
Linear (Adjusted revenue)
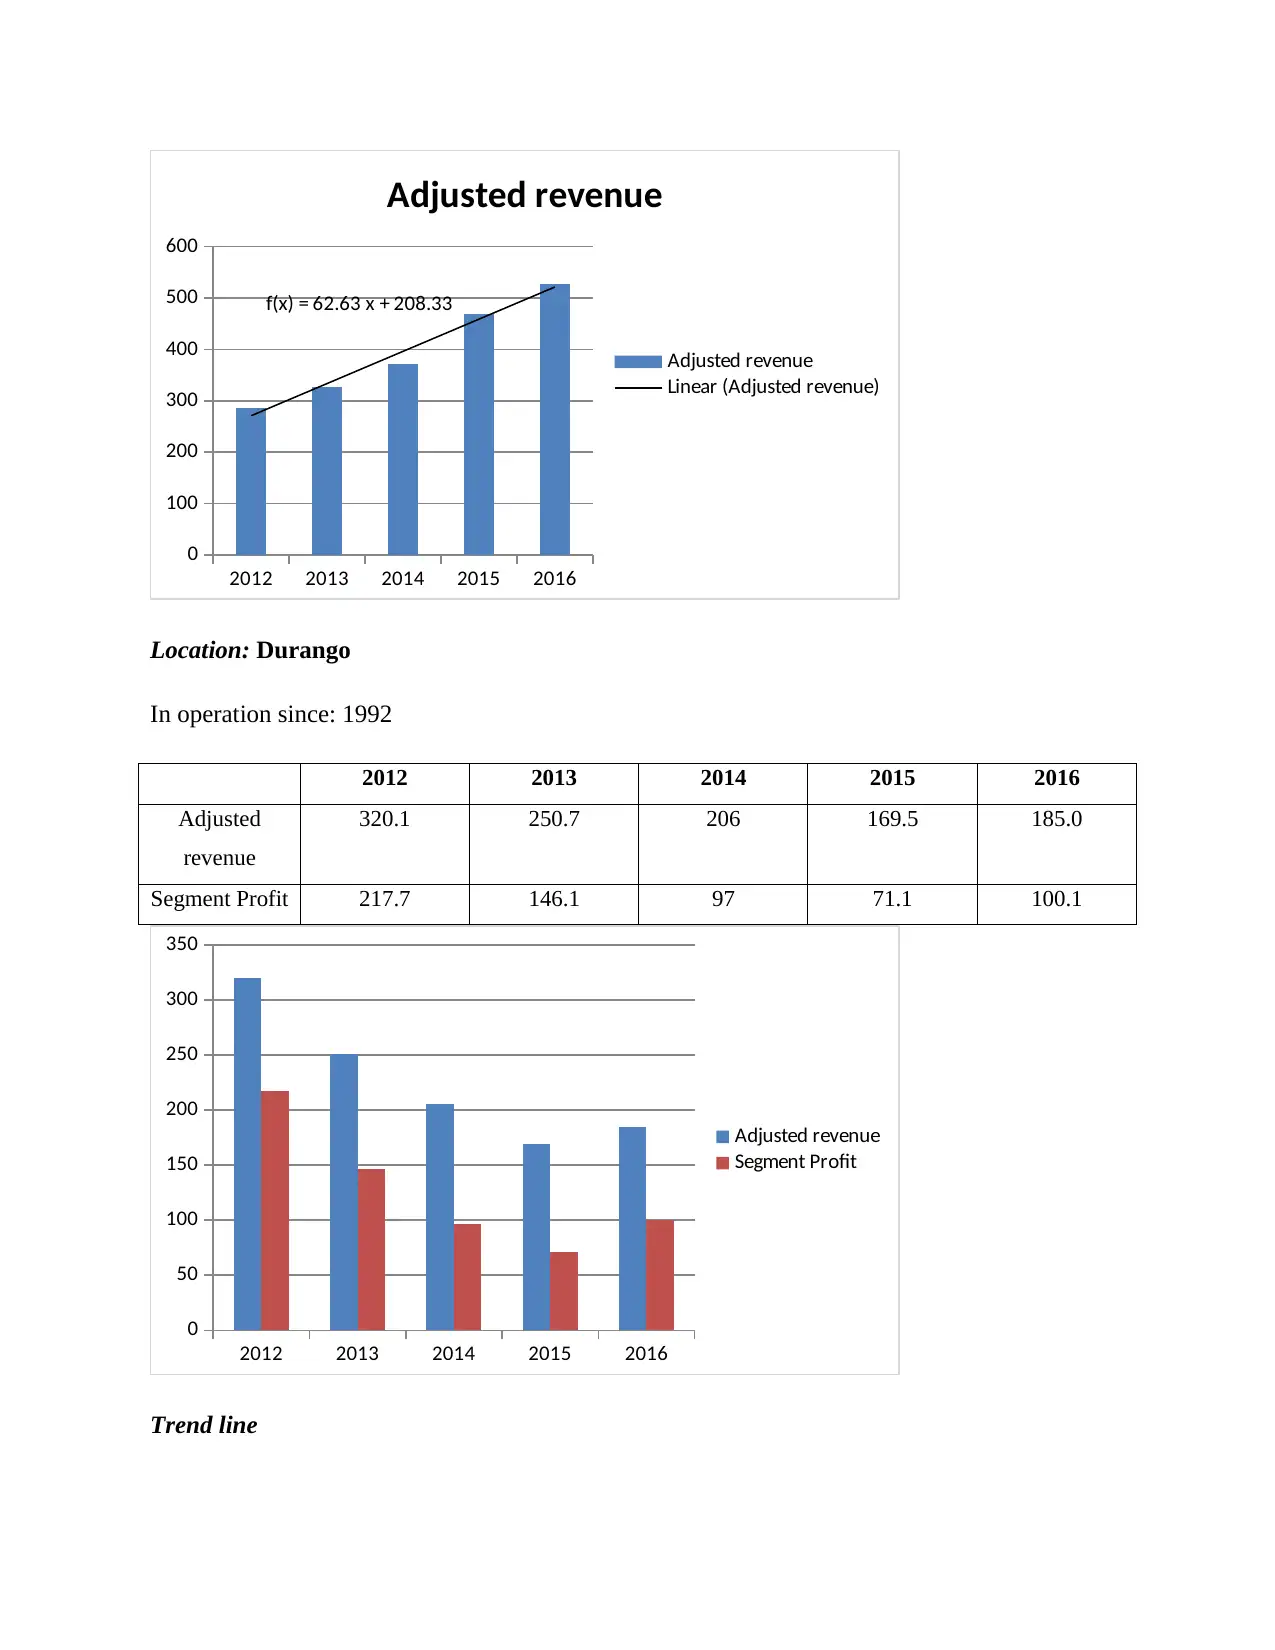
Location: Durango
In operation since: 1992
2012 2013 2014 2015 2016
Adjusted
revenue
320.1 250.7 206 169.5 185.0
Segment Profit 217.7 146.1 97 71.1 100.1
2012 2013 2014 2015 2016
0
50
100
150
200
250
300
350
Adjusted revenue
Segment Profit
Trend line
0
100
200
300
400
500
600
f(x) = 62.63 x + 208.33
Adjusted revenue
Adjusted revenue
Linear (Adjusted revenue)
Location: Durango
In operation since: 1992
2012 2013 2014 2015 2016
Adjusted
revenue
320.1 250.7 206 169.5 185.0
Segment Profit 217.7 146.1 97 71.1 100.1
2012 2013 2014 2015 2016
0
50
100
150
200
250
300
350
Adjusted revenue
Segment Profit
Trend line
Paraphrase This Document
Need a fresh take? Get an instant paraphrase of this document with our AI Paraphraser
2012 2013 2014 2015 2016
0
50
100
150
200
250
300
350
f(x) = − 35.14 x + 331.68
Adjusted revenue
Adjusted revenue
Linear (Adjusted revenue)
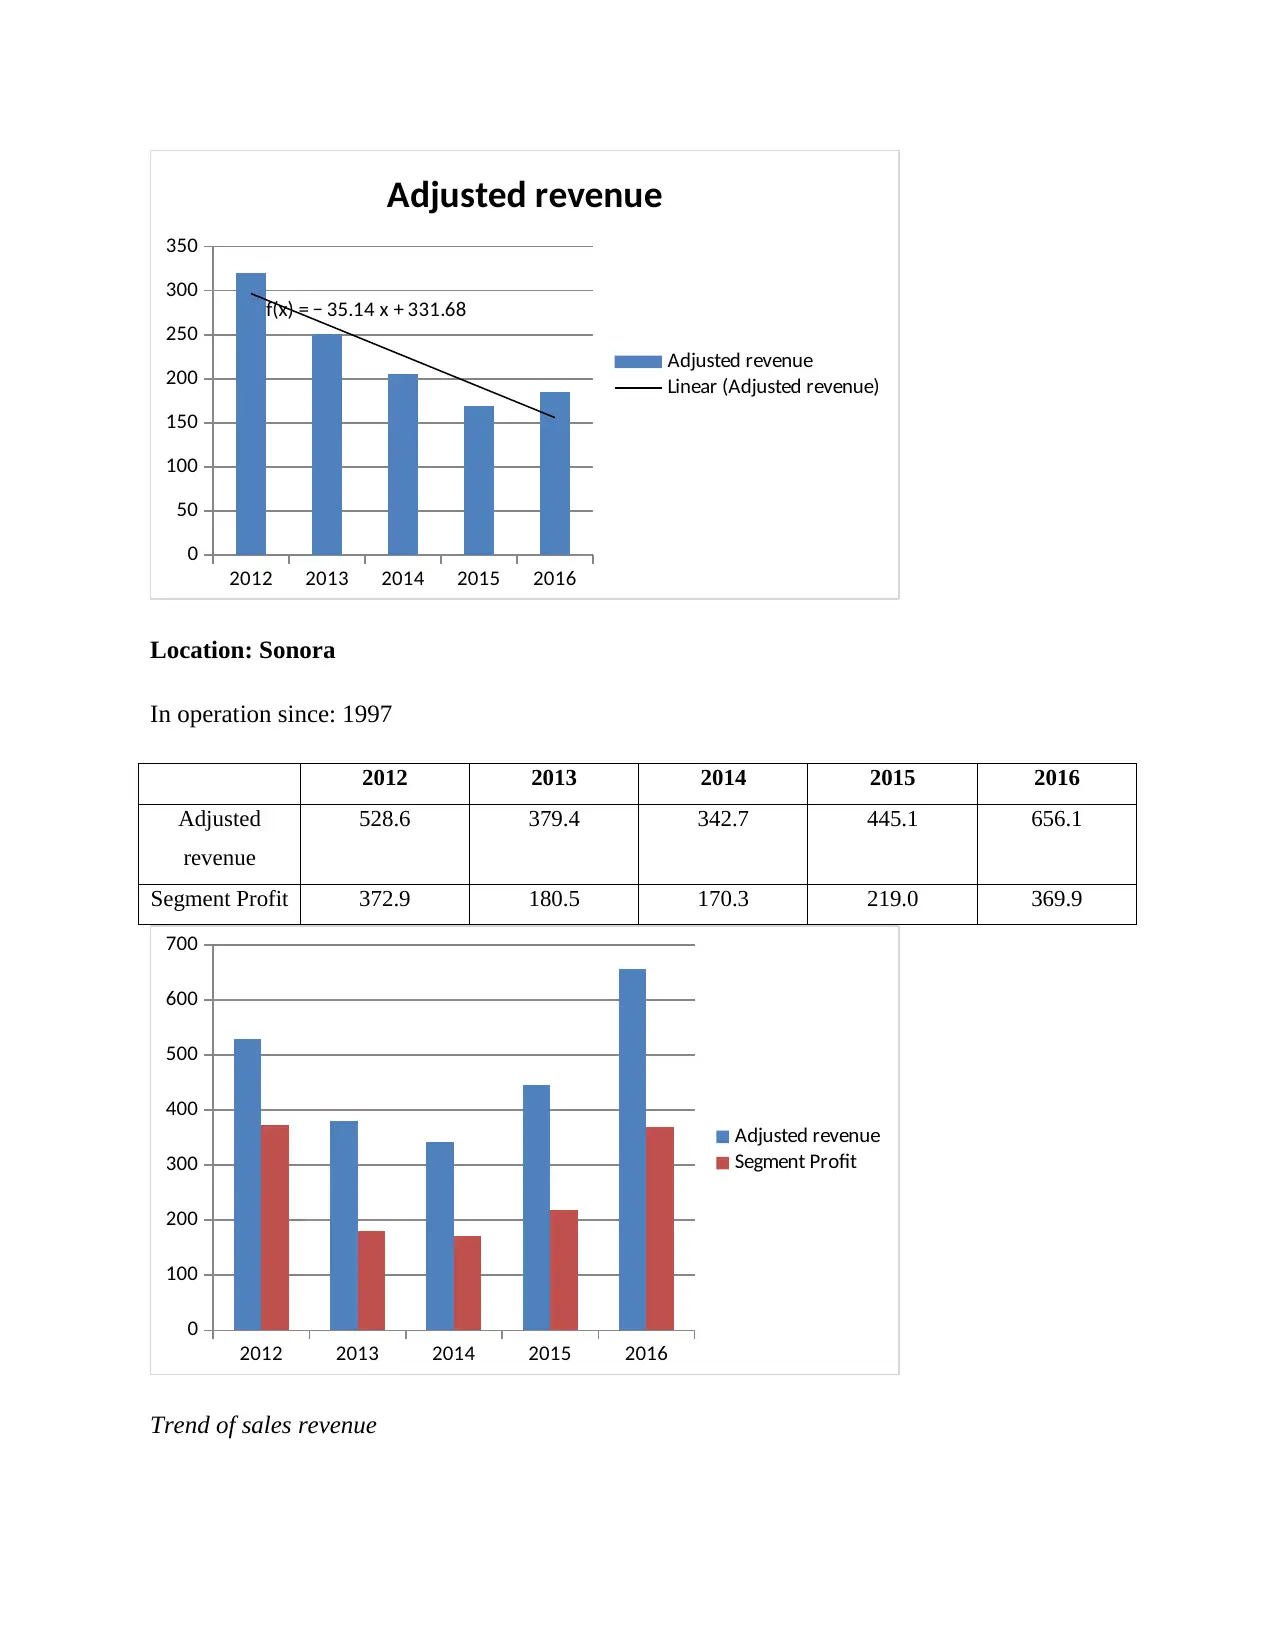
Location: Sonora
In operation since: 1997
2012 2013 2014 2015 2016
Adjusted
revenue
528.6 379.4 342.7 445.1 656.1
Segment Profit 372.9 180.5 170.3 219.0 369.9
2012 2013 2014 2015 2016
0
100
200
300
400
500
600
700
Adjusted revenue
Segment Profit
Trend of sales revenue
0
50
100
150
200
250
300
350
f(x) = − 35.14 x + 331.68
Adjusted revenue
Adjusted revenue
Linear (Adjusted revenue)
Location: Sonora
In operation since: 1997
2012 2013 2014 2015 2016
Adjusted
revenue
528.6 379.4 342.7 445.1 656.1
Segment Profit 372.9 180.5 170.3 219.0 369.9
2012 2013 2014 2015 2016
0
100
200
300
400
500
600
700
Adjusted revenue
Segment Profit
Trend of sales revenue
2012 2013 2014 2015 2016
0
100
200
300
400
500
600
700
f(x) = 32.07 x + 374.17
Adjusted revenue
Adjusted revenue
Linear (Adjusted revenue)
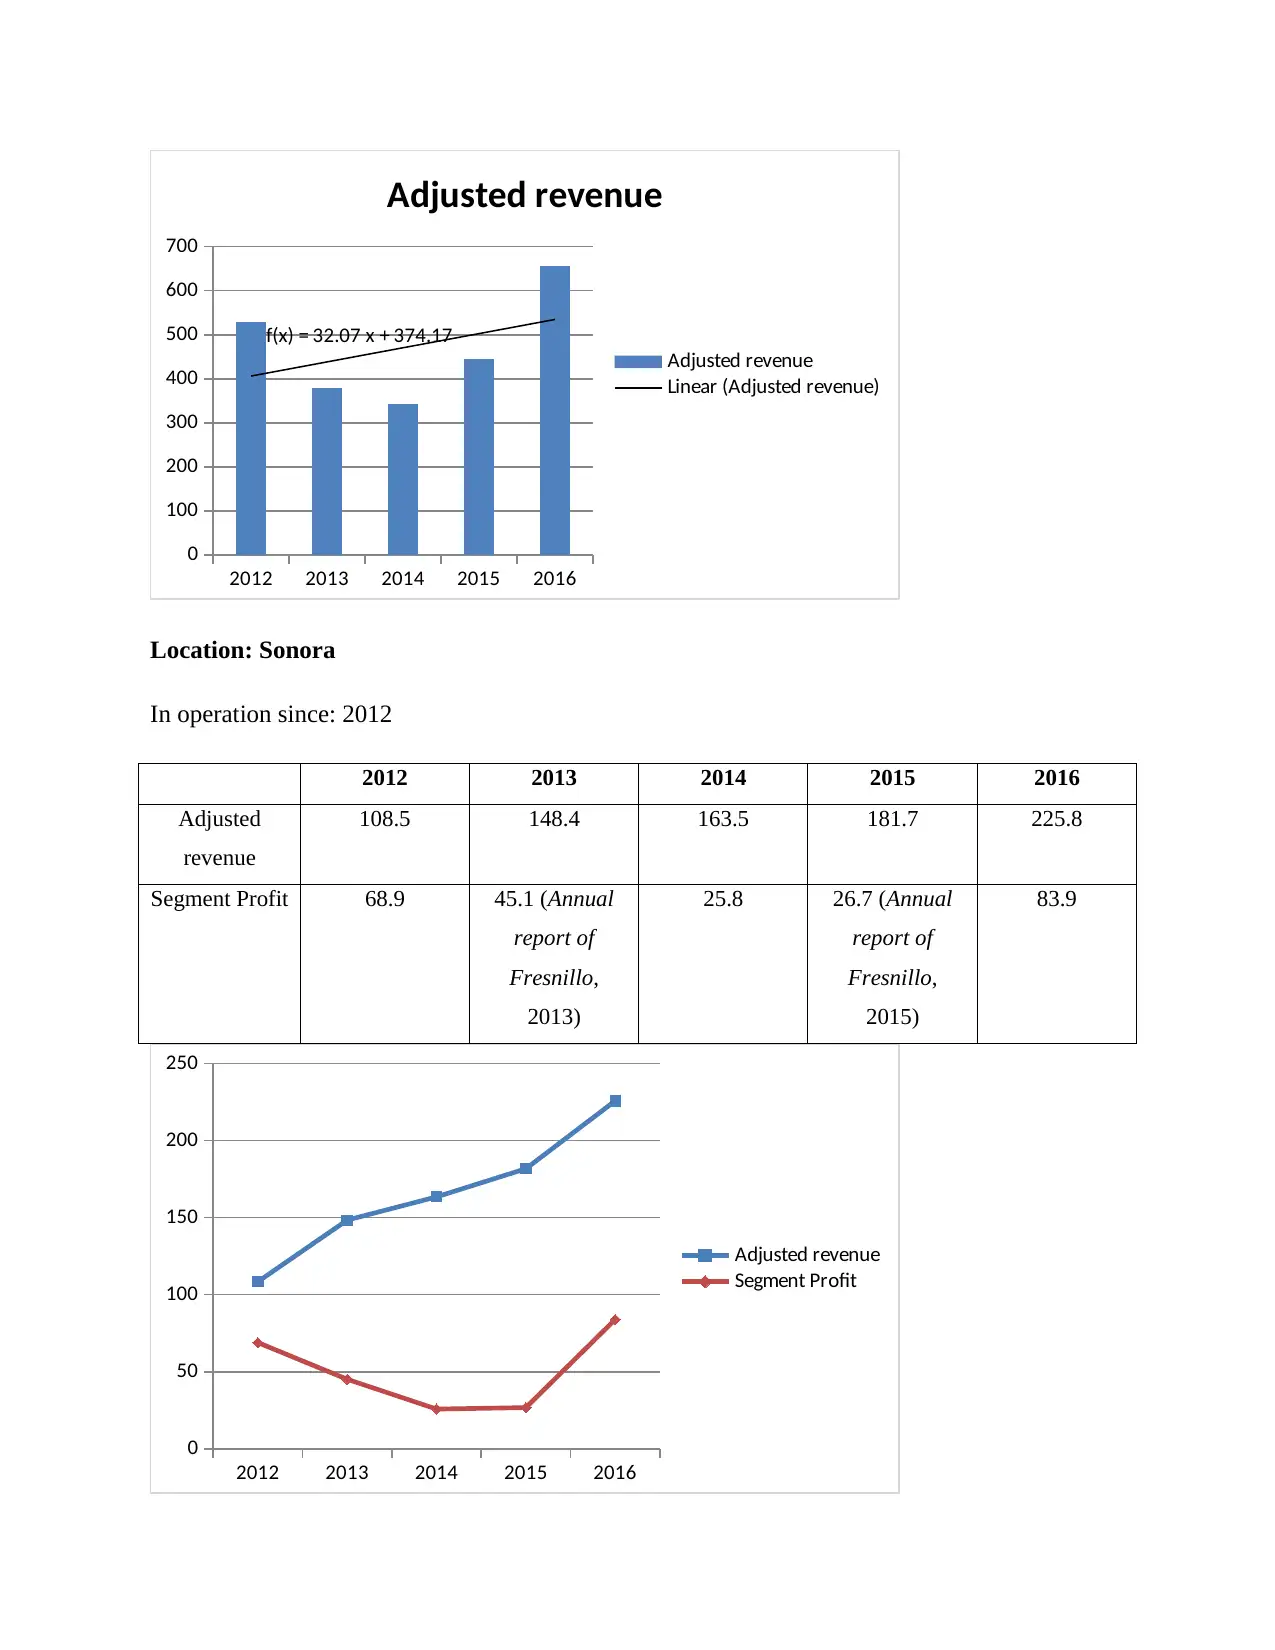
Location: Sonora
In operation since: 2012
2012 2013 2014 2015 2016
Adjusted
revenue
108.5 148.4 163.5 181.7 225.8
Segment Profit 68.9 45.1 (Annual
report of
Fresnillo,
2013)
25.8 26.7 (Annual
report of
Fresnillo,
2015)
83.9
2012 2013 2014 2015 2016
0
50
100
150
200
250
Adjusted revenue
Segment Profit
0
100
200
300
400
500
600
700
f(x) = 32.07 x + 374.17
Adjusted revenue
Adjusted revenue
Linear (Adjusted revenue)
Location: Sonora
In operation since: 2012
2012 2013 2014 2015 2016
Adjusted
revenue
108.5 148.4 163.5 181.7 225.8
Segment Profit 68.9 45.1 (Annual
report of
Fresnillo,
2013)
25.8 26.7 (Annual
report of
Fresnillo,
2015)
83.9
2012 2013 2014 2015 2016
0
50
100
150
200
250
Adjusted revenue
Segment Profit
⊘ This is a preview!⊘
Do you want full access?
Subscribe today to unlock all pages.
Trusted by 1+ million students worldwide
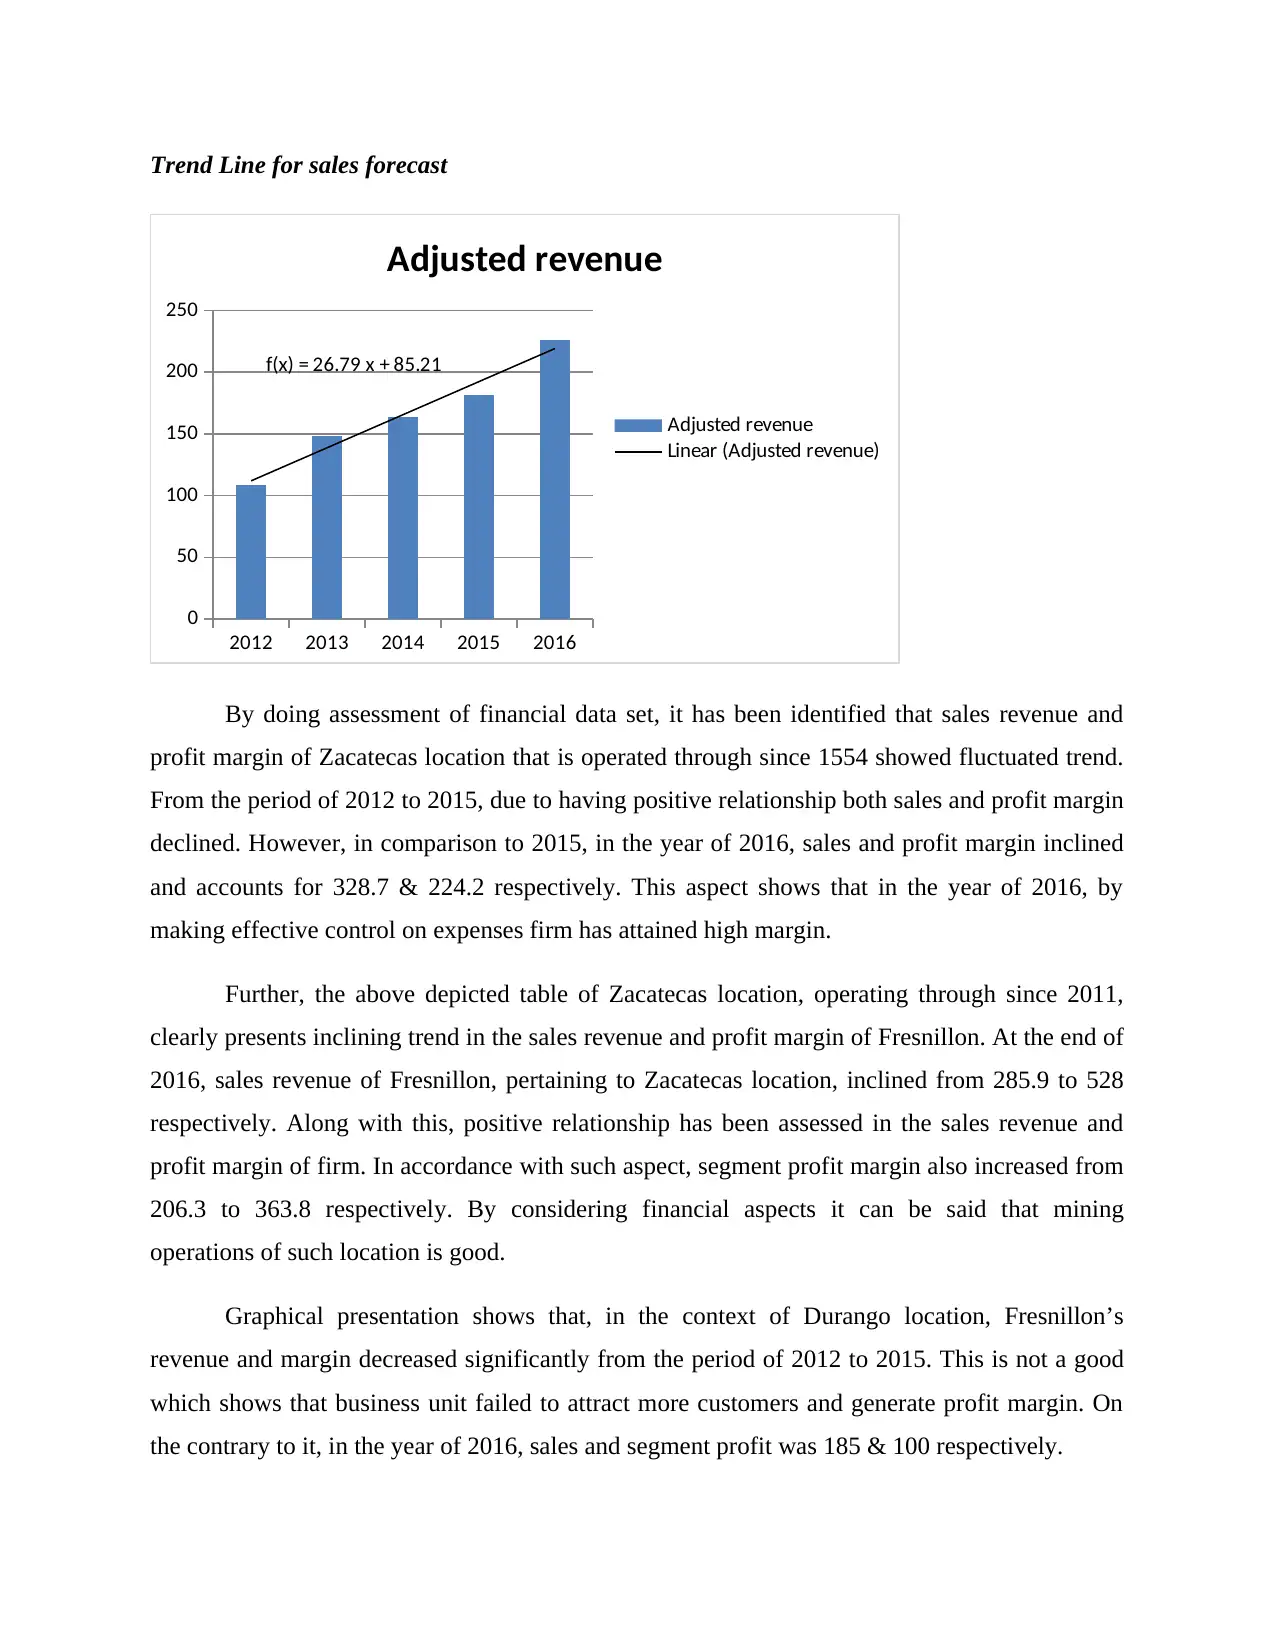
Trend Line for sales forecast
2012 2013 2014 2015 2016
0
50
100
150
200
250
f(x) = 26.79 x + 85.21
Adjusted revenue
Adjusted revenue
Linear (Adjusted revenue)
By doing assessment of financial data set, it has been identified that sales revenue and
profit margin of Zacatecas location that is operated through since 1554 showed fluctuated trend.
From the period of 2012 to 2015, due to having positive relationship both sales and profit margin
declined. However, in comparison to 2015, in the year of 2016, sales and profit margin inclined
and accounts for 328.7 & 224.2 respectively. This aspect shows that in the year of 2016, by
making effective control on expenses firm has attained high margin.
Further, the above depicted table of Zacatecas location, operating through since 2011,
clearly presents inclining trend in the sales revenue and profit margin of Fresnillon. At the end of
2016, sales revenue of Fresnillon, pertaining to Zacatecas location, inclined from 285.9 to 528
respectively. Along with this, positive relationship has been assessed in the sales revenue and
profit margin of firm. In accordance with such aspect, segment profit margin also increased from
206.3 to 363.8 respectively. By considering financial aspects it can be said that mining
operations of such location is good.
Graphical presentation shows that, in the context of Durango location, Fresnillon’s
revenue and margin decreased significantly from the period of 2012 to 2015. This is not a good
which shows that business unit failed to attract more customers and generate profit margin. On
the contrary to it, in the year of 2016, sales and segment profit was 185 & 100 respectively.
Paraphrase This Document
Need a fresh take? Get an instant paraphrase of this document with our AI Paraphraser
Annual reports of Fresnillon, from the period of 2012 to 2016, exhibits fluctuated trend in
both sales as well as profit margin of Sonora location, operating from since 1997. During the
time period of 5 years, performance of Fresnillon’s was good in financial terms in 2012 & 2016.
In the middle years such as 2013, 2014 & 2015, business unit failed to generate enough and high
margin due to increasing cost and decreasing revenue.
By doing assessment of financial statements, it has been identified that sales and profit
margin of Sonora location, which is operating from since 2012, increased significantly over the
years. This aspect indicates that business unit has exerted effectual control on cost and thereby
generated high margin.
Conclusive section: Considering the overall assessment, it can be presented that sales and
profitability of Fresnillon’s different locations such as Zacatecas (2011), Sonora (1997) and
Sonora (2012) is growing. Hence, by developing sound framework business unit can maximize
the level of both sales and profit margin. Thus, by exploring business at such location firm can
get the desired level of outcome or success. On the other side, financial performance of locations
such as Zacatecas (1554), Durango (1992), are imposing high level of risk in front of Fresnillon.
Moreover, decreasing trend of sales and profit shows management at such locations are not good.
Thus, business unit is required to identify the causes due to which at such location firm failed to
achieve objectives. By doing this, firm would become able to develop suitable strategies as well
as policies and thereby would become able to gain competitive edge over others.
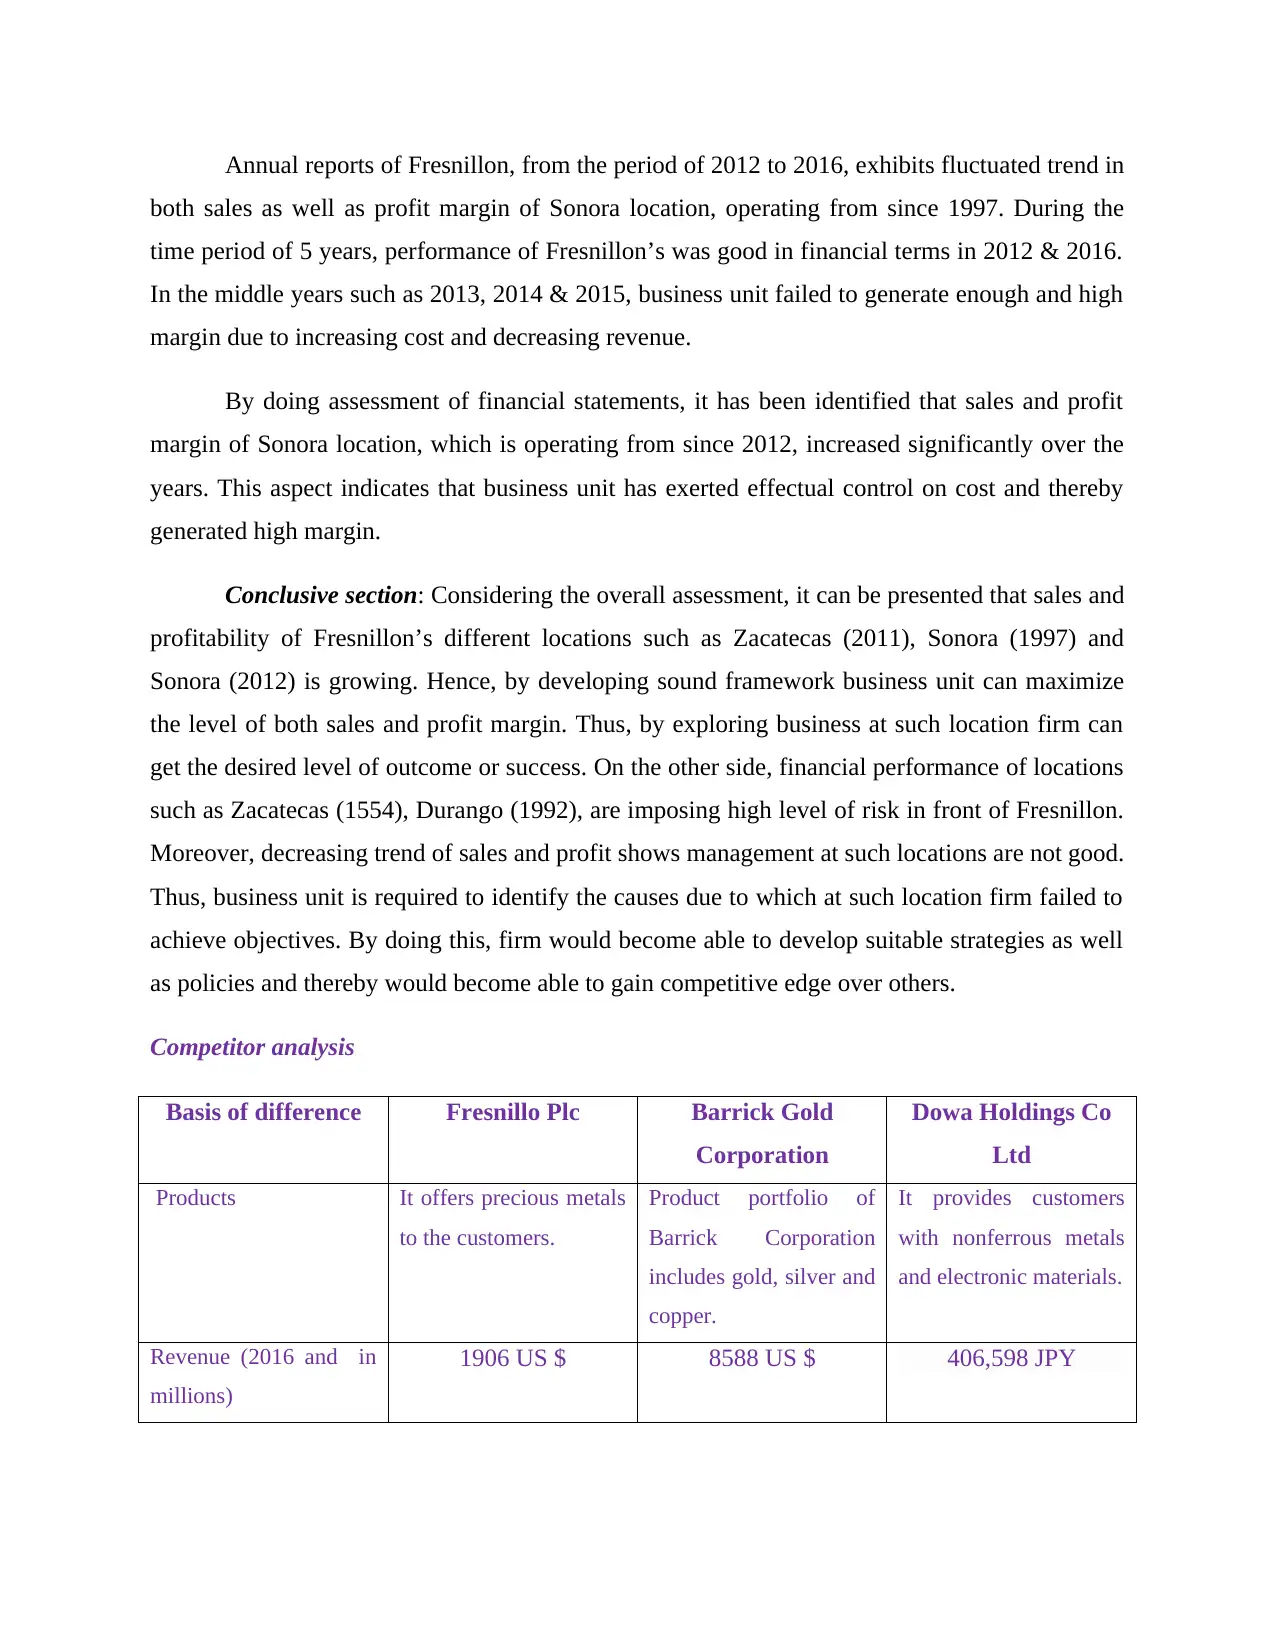
Competitor analysis
Basis of difference Fresnillo Plc Barrick Gold
Corporation
Dowa Holdings Co
Ltd
Products It offers precious metals
to the customers.
Product portfolio of
Barrick Corporation
includes gold, silver and
copper.
It provides customers
with nonferrous metals
and electronic materials.
Revenue (2016 and in
millions)
1906 US $ 8588 US $ 406,598 JPY
both sales as well as profit margin of Sonora location, operating from since 1997. During the
time period of 5 years, performance of Fresnillon’s was good in financial terms in 2012 & 2016.
In the middle years such as 2013, 2014 & 2015, business unit failed to generate enough and high
margin due to increasing cost and decreasing revenue.
By doing assessment of financial statements, it has been identified that sales and profit
margin of Sonora location, which is operating from since 2012, increased significantly over the
years. This aspect indicates that business unit has exerted effectual control on cost and thereby
generated high margin.
Conclusive section: Considering the overall assessment, it can be presented that sales and
profitability of Fresnillon’s different locations such as Zacatecas (2011), Sonora (1997) and
Sonora (2012) is growing. Hence, by developing sound framework business unit can maximize
the level of both sales and profit margin. Thus, by exploring business at such location firm can
get the desired level of outcome or success. On the other side, financial performance of locations
such as Zacatecas (1554), Durango (1992), are imposing high level of risk in front of Fresnillon.
Moreover, decreasing trend of sales and profit shows management at such locations are not good.
Thus, business unit is required to identify the causes due to which at such location firm failed to
achieve objectives. By doing this, firm would become able to develop suitable strategies as well
as policies and thereby would become able to gain competitive edge over others.
Competitor analysis
Basis of difference Fresnillo Plc Barrick Gold
Corporation
Dowa Holdings Co
Ltd
Products It offers precious metals
to the customers.
Product portfolio of
Barrick Corporation
includes gold, silver and
copper.
It provides customers
with nonferrous metals
and electronic materials.
Revenue (2016 and in
millions)
1906 US $ 8588 US $ 406,598 JPY
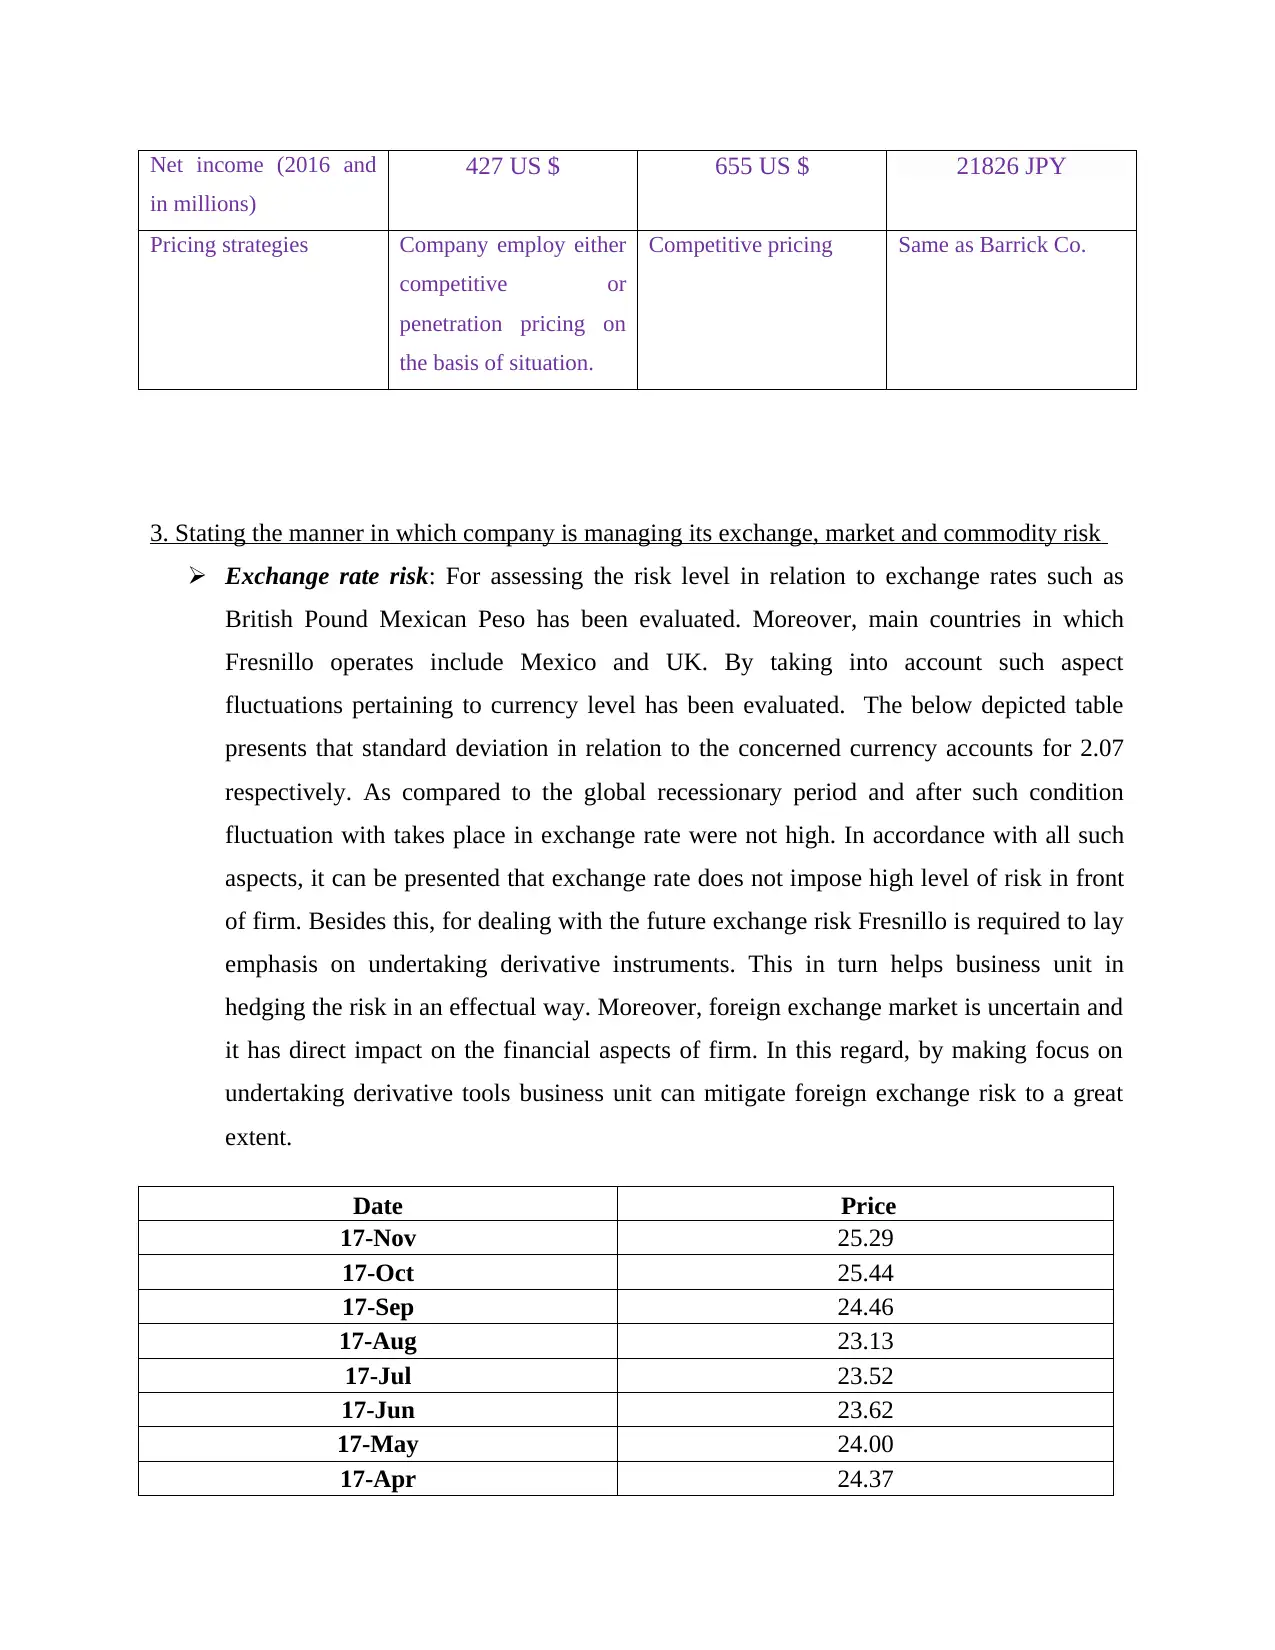
Net income (2016 and
in millions)
427 US $ 655 US $ 21826 JPY
Pricing strategies Company employ either
competitive or
penetration pricing on
the basis of situation.
Competitive pricing Same as Barrick Co.
3. Stating the manner in which company is managing its exchange, market and commodity risk
Exchange rate risk: For assessing the risk level in relation to exchange rates such as
British Pound Mexican Peso has been evaluated. Moreover, main countries in which
Fresnillo operates include Mexico and UK. By taking into account such aspect
fluctuations pertaining to currency level has been evaluated. The below depicted table
presents that standard deviation in relation to the concerned currency accounts for 2.07
respectively. As compared to the global recessionary period and after such condition
fluctuation with takes place in exchange rate were not high. In accordance with all such
aspects, it can be presented that exchange rate does not impose high level of risk in front
of firm. Besides this, for dealing with the future exchange risk Fresnillo is required to lay
emphasis on undertaking derivative instruments. This in turn helps business unit in
hedging the risk in an effectual way. Moreover, foreign exchange market is uncertain and
it has direct impact on the financial aspects of firm. In this regard, by making focus on
undertaking derivative tools business unit can mitigate foreign exchange risk to a great
extent.
Date Price
17-Nov 25.29
17-Oct 25.44
17-Sep 24.46
17-Aug 23.13
17-Jul 23.52
17-Jun 23.62
17-May 24.00
17-Apr 24.37
⊘ This is a preview!⊘
Do you want full access?
Subscribe today to unlock all pages.
Trusted by 1+ million students worldwide
1 out of 27
Related Documents


Your All-in-One AI-Powered Toolkit for Academic Success.
+13062052269
info@desklib.com
Available 24*7 on WhatsApp / Email
![[object Object]](/_next/static/media/star-bottom.7253800d.svg)
Unlock your academic potential
Copyright © 2020–2026 A2Z Services. All Rights Reserved. Developed and managed by ZUCOL.