Operations Management Report: Analyzing Friendly Courier's Challenges

Verified

Added on  2023/05/29

|7
|1133
|441
Report
AI Summary
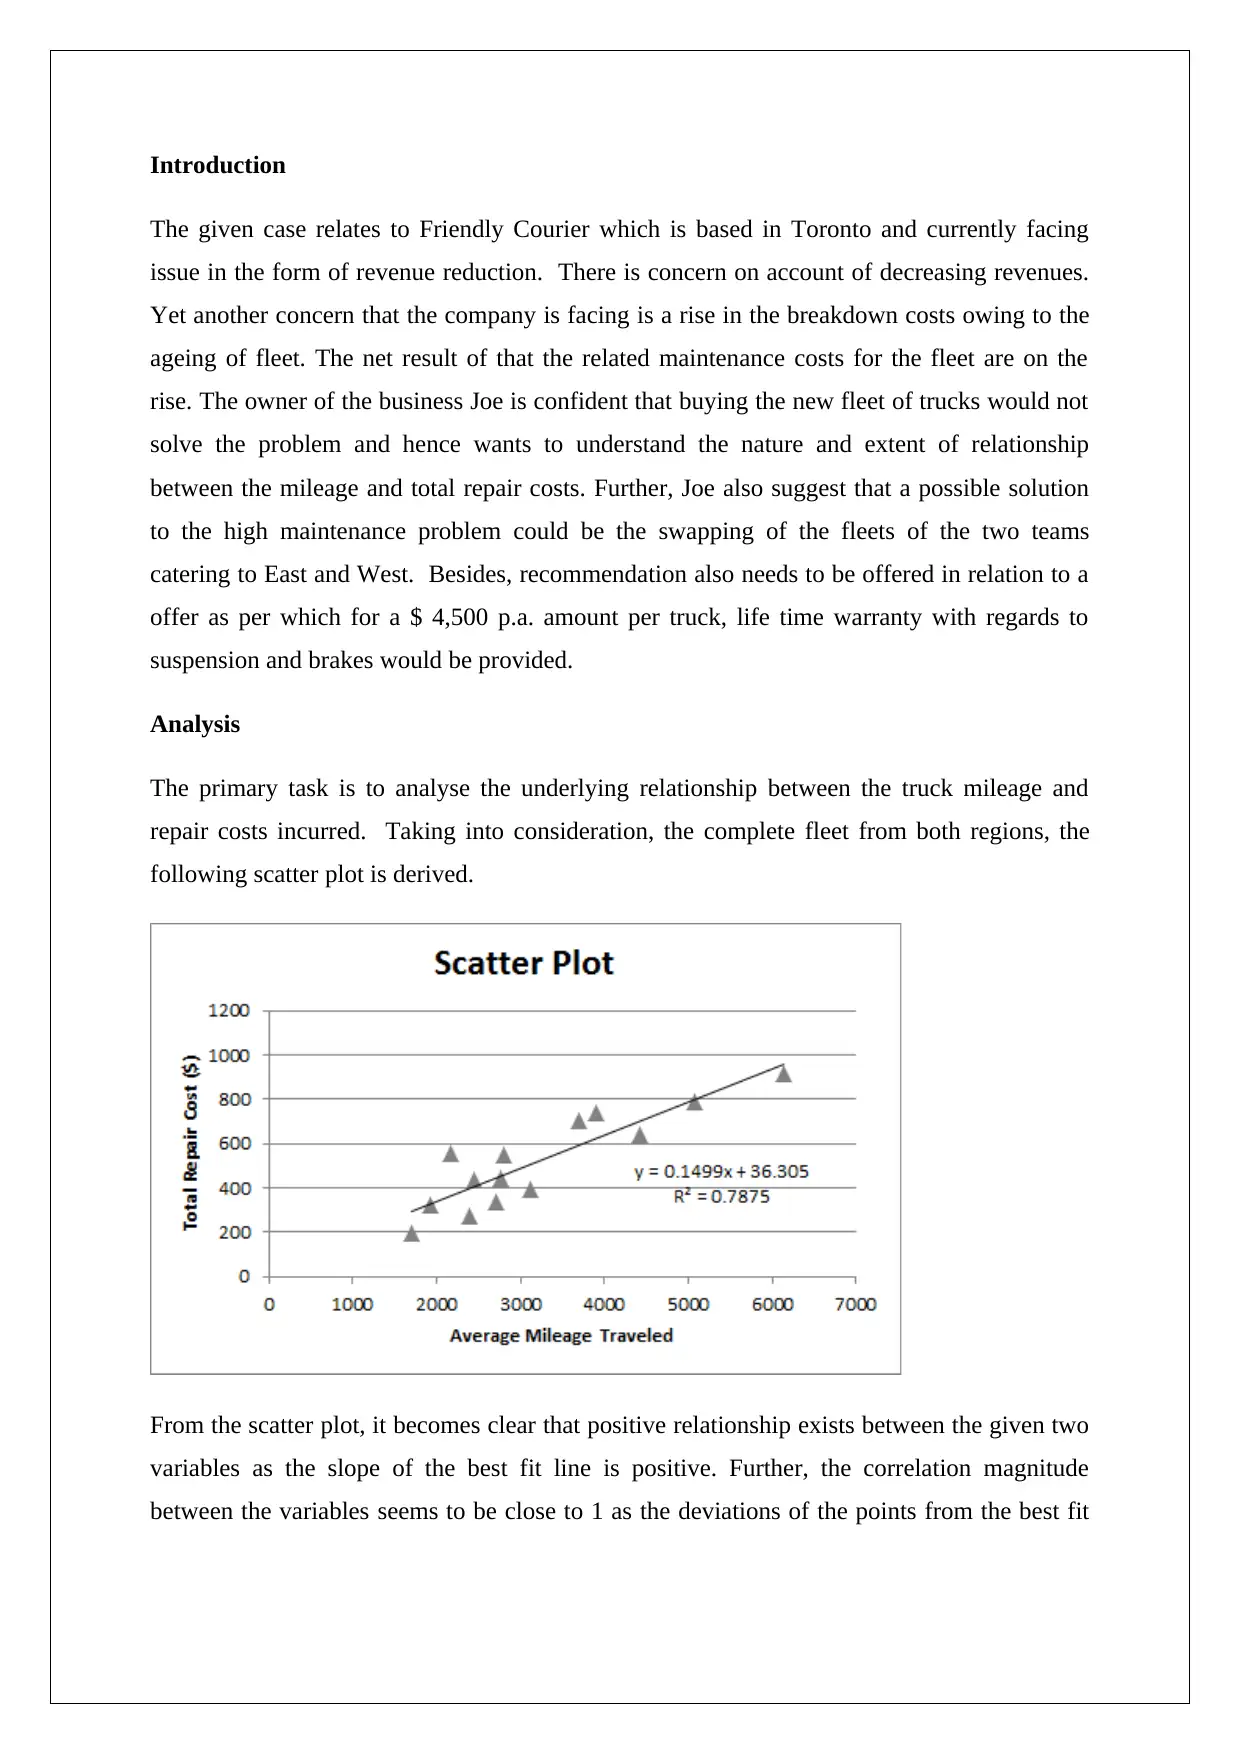
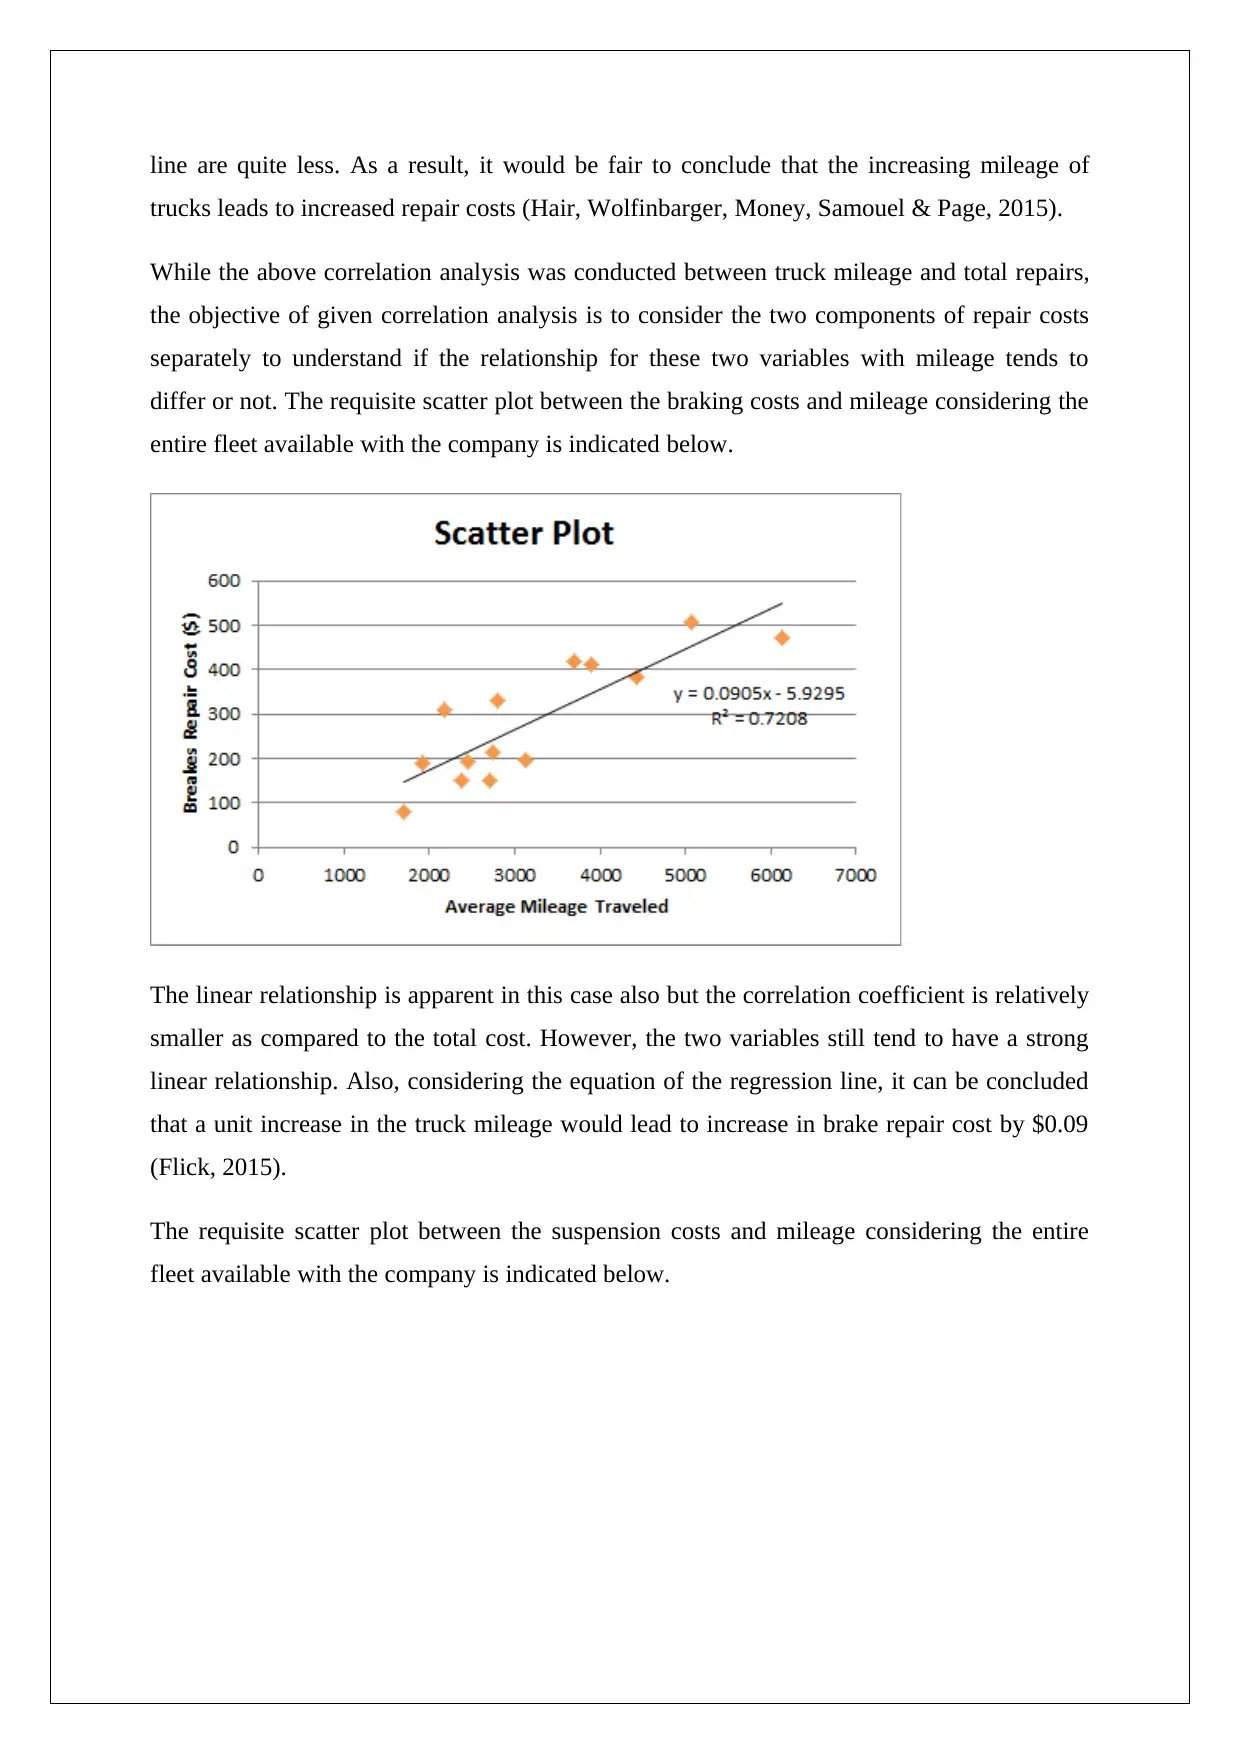
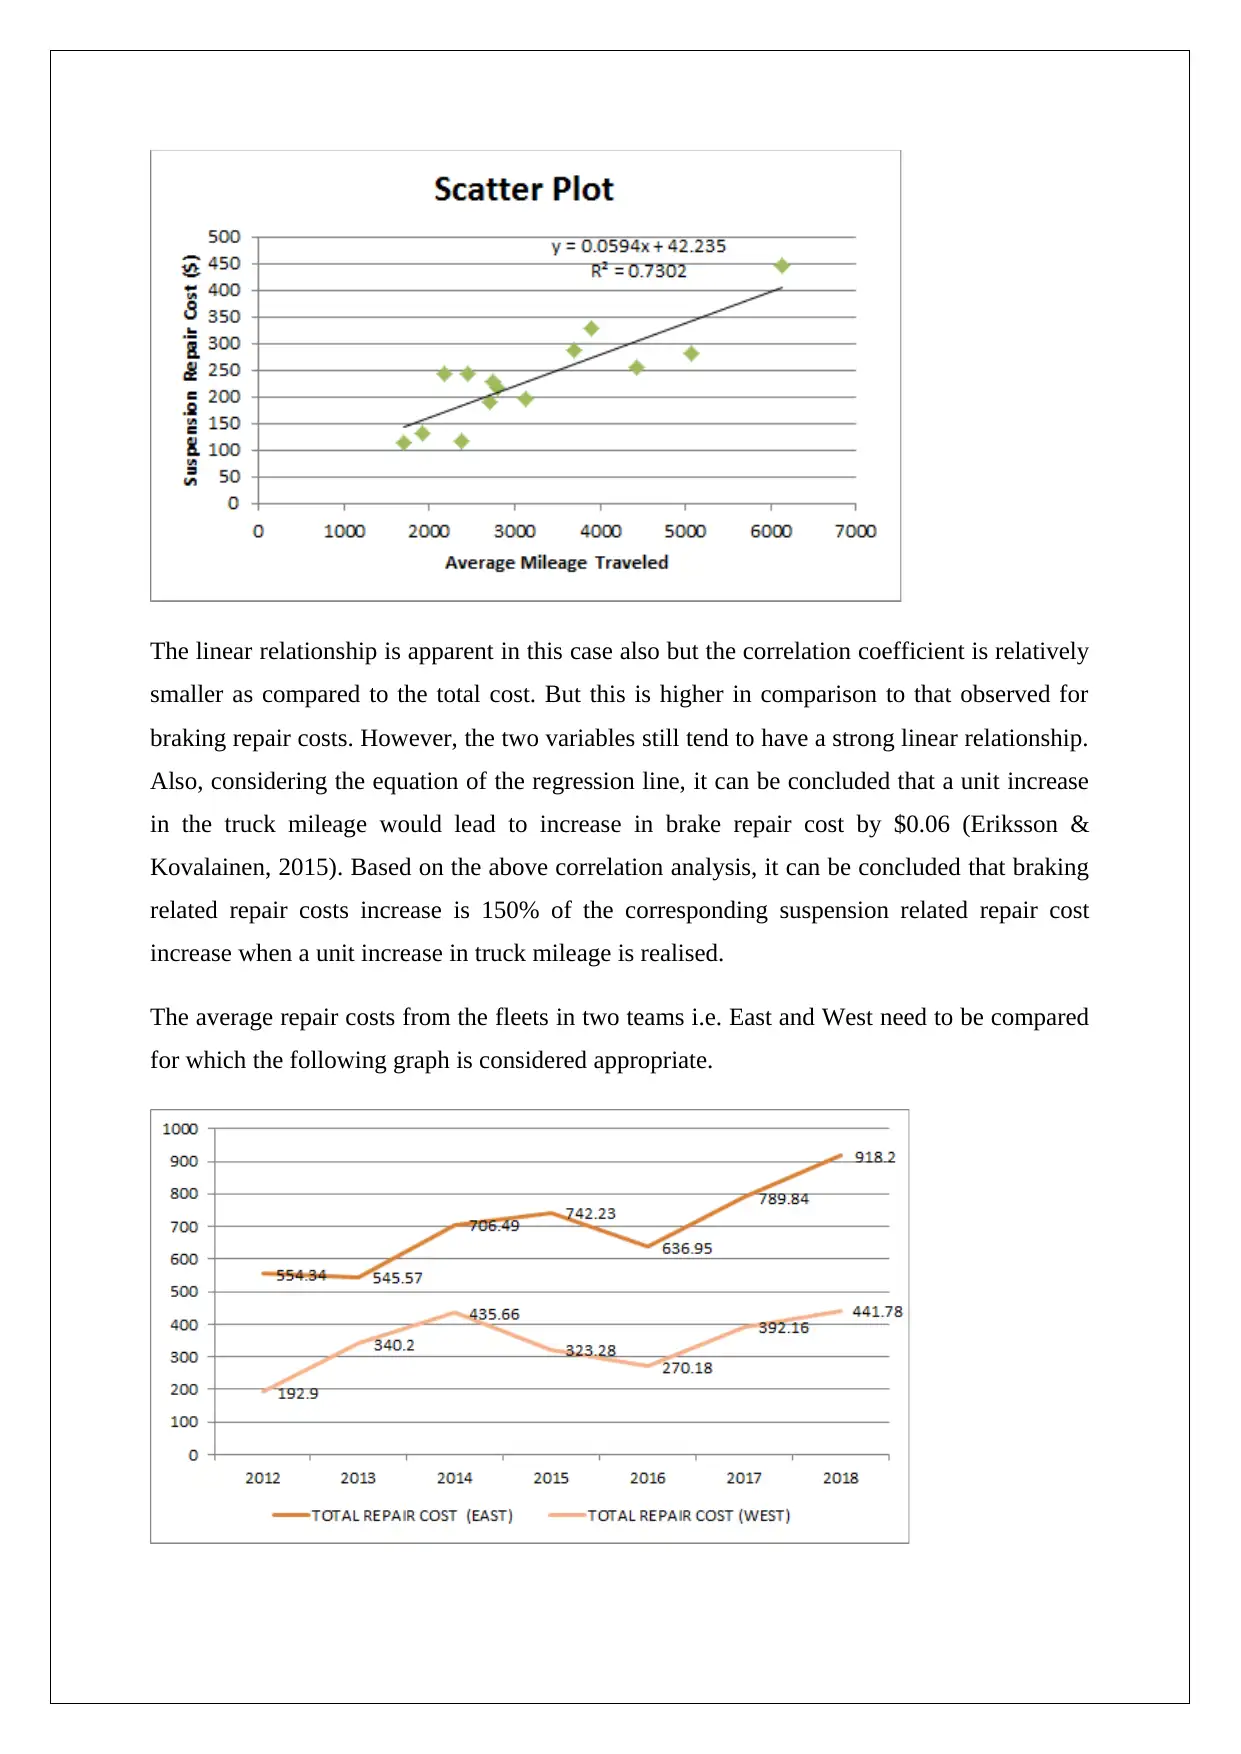
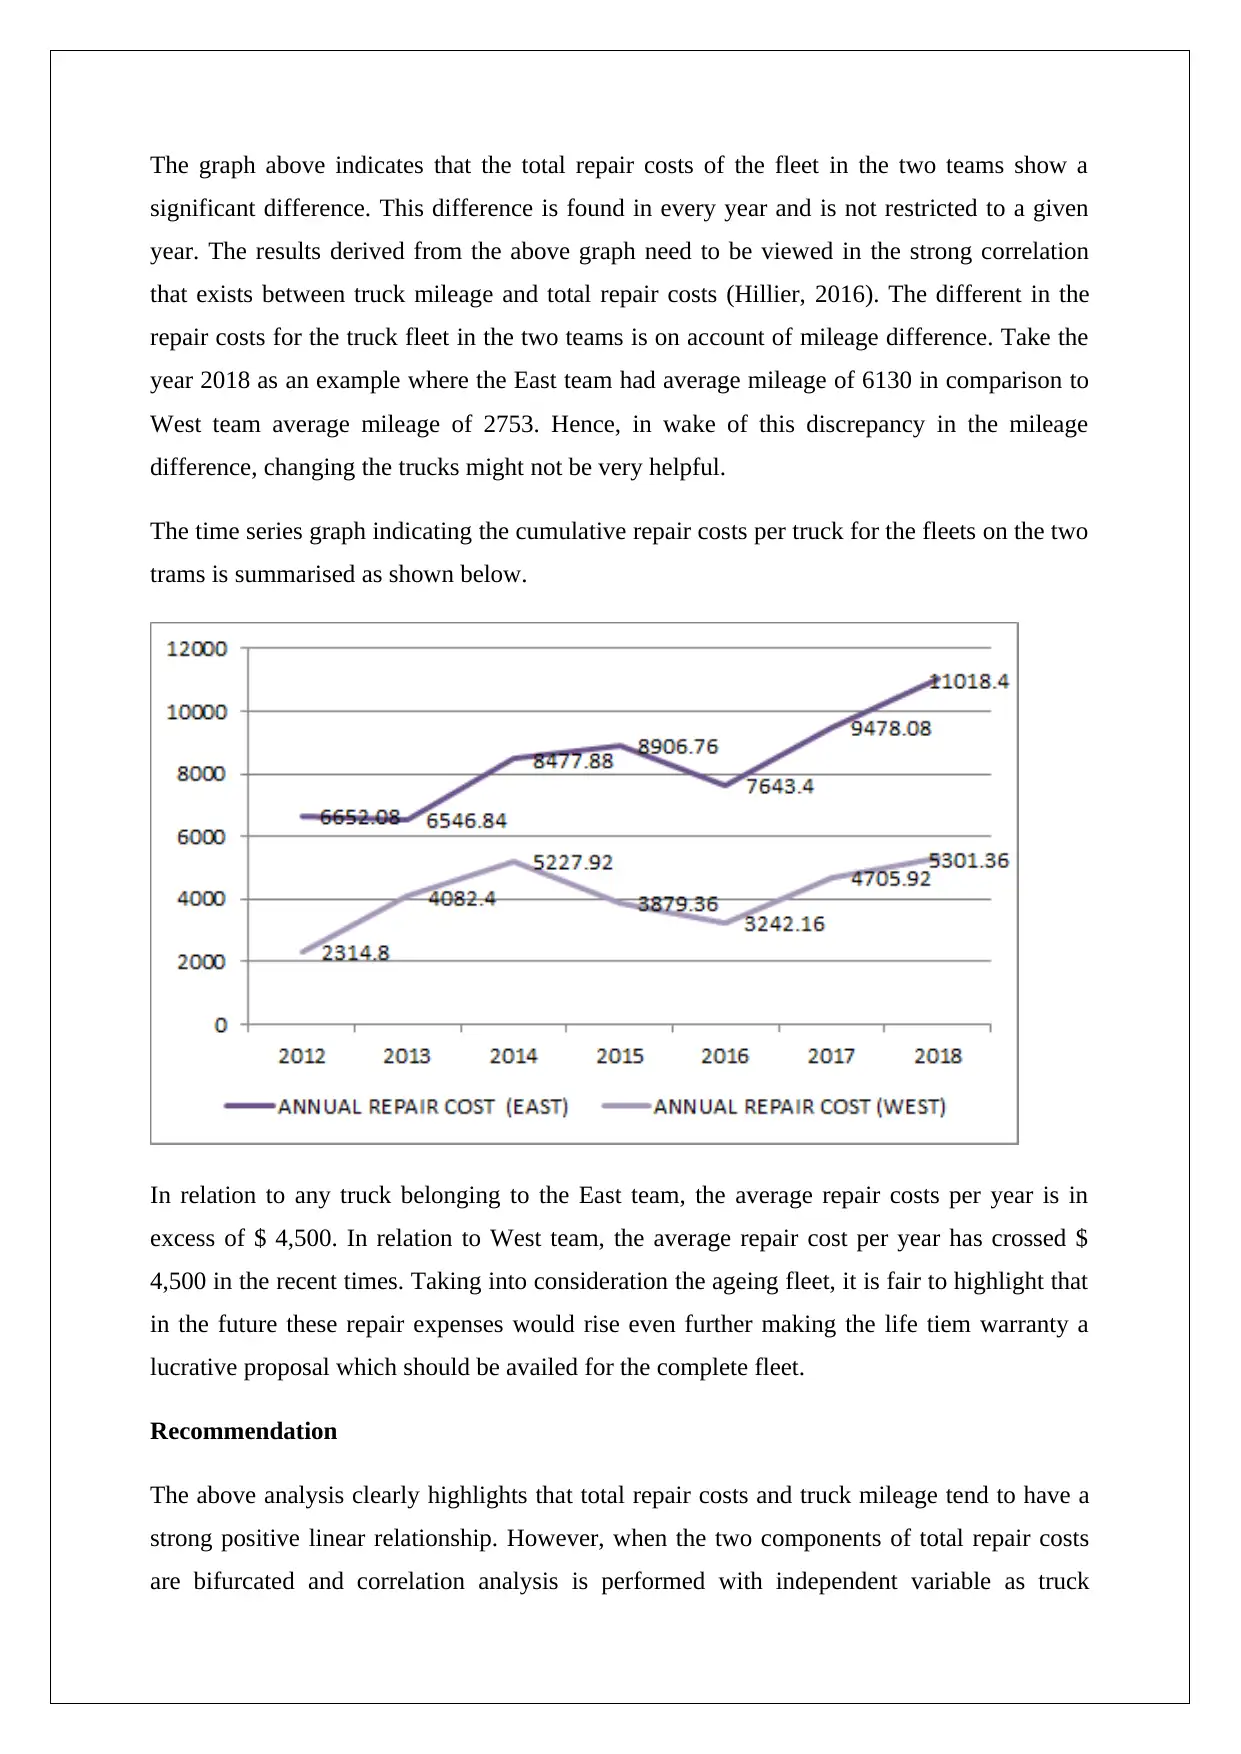
This report analyzes the operational challenges faced by Friendly Courier, focusing on declining revenues and rising fleet maintenance costs. A correlation analysis is conducted to understand the relationship between truck mileage and repair costs, revealing a strong positive linear relationship. The analysis extends to braking and suspension costs, highlighting differences in their correlation with mileage. The report also compares repair costs between the East and West teams, attributing differences to mileage variations. The recommendation suggests purchasing a lifetime warranty to cap repair costs, rather than swapping truck fleets between teams, as the mileage difference is the key factor. This analysis supports informed decision-making for Friendly Courier's operational strategy, emphasizing cost-effective solutions for fleet management.
Document Page
OPERATIONS MANAGEMENT
STUDENT ID:
[Pick the date]
tabler-icon-diamond-filled.svg

Secure Best Marks with AI Grader

Need help grading? Try our AI Grader for instant feedback on your assignments.
Document Page
Introduction
The given case relates to Friendly Courier which is based in Toronto and currently facing
issue in the form of revenue reduction. There is concern on account of decreasing revenues.
Yet another concern that the company is facing is a rise in the breakdown costs owing to the
ageing of fleet. The net result of that the related maintenance costs for the fleet are on the
rise. The owner of the business Joe is confident that buying the new fleet of trucks would not
solve the problem and hence wants to understand the nature and extent of relationship
between the mileage and total repair costs. Further, Joe also suggest that a possible solution
to the high maintenance problem could be the swapping of the fleets of the two teams
catering to East and West. Besides, recommendation also needs to be offered in relation to a
offer as per which for a $ 4,500 p.a. amount per truck, life time warranty with regards to
suspension and brakes would be provided.
Analysis
The primary task is to analyse the underlying relationship between the truck mileage and
repair costs incurred. Taking into consideration, the complete fleet from both regions, the
following scatter plot is derived.
From the scatter plot, it becomes clear that positive relationship exists between the given two
variables as the slope of the best fit line is positive. Further, the correlation magnitude
between the variables seems to be close to 1 as the deviations of the points from the best fit
Document Page
line are quite less. As a result, it would be fair to conclude that the increasing mileage of
trucks leads to increased repair costs (Hair, Wolfinbarger, Money, Samouel & Page, 2015).
While the above correlation analysis was conducted between truck mileage and total repairs,
the objective of given correlation analysis is to consider the two components of repair costs
separately to understand if the relationship for these two variables with mileage tends to
differ or not. The requisite scatter plot between the braking costs and mileage considering the
entire fleet available with the company is indicated below.
The linear relationship is apparent in this case also but the correlation coefficient is relatively
smaller as compared to the total cost. However, the two variables still tend to have a strong
linear relationship. Also, considering the equation of the regression line, it can be concluded
that a unit increase in the truck mileage would lead to increase in brake repair cost by $0.09
(Flick, 2015).
The requisite scatter plot between the suspension costs and mileage considering the entire
fleet available with the company is indicated below.
Document Page
The linear relationship is apparent in this case also but the correlation coefficient is relatively
smaller as compared to the total cost. But this is higher in comparison to that observed for
braking repair costs. However, the two variables still tend to have a strong linear relationship.
Also, considering the equation of the regression line, it can be concluded that a unit increase
in the truck mileage would lead to increase in brake repair cost by $0.06 (Eriksson &
Kovalainen, 2015). Based on the above correlation analysis, it can be concluded that braking
related repair costs increase is 150% of the corresponding suspension related repair cost
increase when a unit increase in truck mileage is realised.
The average repair costs from the fleets in two teams i.e. East and West need to be compared
for which the following graph is considered appropriate.
tabler-icon-diamond-filled.svg

Secure Best Marks with AI Grader

Need help grading? Try our AI Grader for instant feedback on your assignments.
Document Page
The graph above indicates that the total repair costs of the fleet in the two teams show a
significant difference. This difference is found in every year and is not restricted to a given
year. The results derived from the above graph need to be viewed in the strong correlation
that exists between truck mileage and total repair costs (Hillier, 2016). The different in the
repair costs for the truck fleet in the two teams is on account of mileage difference. Take the
year 2018 as an example where the East team had average mileage of 6130 in comparison to
West team average mileage of 2753. Hence, in wake of this discrepancy in the mileage
difference, changing the trucks might not be very helpful.
The time series graph indicating the cumulative repair costs per truck for the fleets on the two
trams is summarised as shown below.
In relation to any truck belonging to the East team, the average repair costs per year is in
excess of $ 4,500. In relation to West team, the average repair cost per year has crossed $
4,500 in the recent times. Taking into consideration the ageing fleet, it is fair to highlight that
in the future these repair expenses would rise even further making the life tiem warranty a
lucrative proposal which should be availed for the complete fleet.
Recommendation
The above analysis clearly highlights that total repair costs and truck mileage tend to have a
strong positive linear relationship. However, when the two components of total repair costs
are bifurcated and correlation analysis is performed with independent variable as truck
Document Page
mileage, the difference in the costs has come to light with regards to braking and suspension
costs. There is difference in the repair costs in the two teams but this is mainly on account of
the difference in mileage. Therefore, the idea involving truck swap between the two teams
may not serve the purpose of reducing the costs significantly. The most prudent solution for
the situation at hand would be to purchase the life time warranty and hence cap the repair
costs per truck at $ 4,500 per year.
Document Page
References
Eriksson, P. & Kovalainen, A. (2015). Quantitative methods in business research London:
Sage Publications.
Flick, U. (2015). Introducing research methodology: A beginner's guide to doing a research
project New York: Sage Publications.
Hair, J. F., Wolfinbarger, M., Money, A. H., Samouel, P., & Page, M. J. (2015). Essentials of
business research methods New York: Routledge.
Hillier, F. (2016). Introduction to Operations Research.New York: McGraw Hill
Publications.
chevron_up_icon
1 out of 7
circle_padding
hide_on_mobile
zoom_out_icon
logo.png

Your All-in-One AI-Powered Toolkit for Academic Success.

Available 24*7 on WhatsApp / Email

[object Object]