Data Analysis and Findings on GHG Emissions for FTSE 100 Companies
VerifiedAdded on 2023/06/08
|12
|3363
|226
Report
AI Summary
This report presents a quantitative analysis of GHG emissions for FTSE 100 companies. The methodology involves the use of SPSS for statistical analysis, testing three hypotheses related to the association between board gender diversity, non-executive directors, and various financial and corporate social responsibility (CSR) factors with GHG emissions. Hypothesis 1 examines the relationship between board gender diversity and GHG emissions. Hypothesis 2 investigates the impact of women non-executive directors on GHG emissions. Hypothesis 3 explores the effect of multiple variables, including CSR, ROA, board diversity, non-executive directors, and market capitalization, on GHG emissions. The analysis includes correlation, ANOVA, and regression to determine the significance of these relationships. The findings suggest a weak or no significant correlation between the variables, highlighting the complex nature of factors influencing GHG emissions within these companies.

Literature review
Paraphrase This Document
Need a fresh take? Get an instant paraphrase of this document with our AI Paraphraser
TABLE OF CONTENTS
TABLE OF CONTENTS..............................................................................................................2
CHAPTER 4: DATA ANALYSIS AND FINDING.......................................................................3
Outline of the methodology........................................................................................................3
Hypothesis 1................................................................................................................................3
Hypothesis 2................................................................................................................................4
Hypothesis 3................................................................................................................................7
CONCLUSION..............................................................................................................................10
REFERENCES..............................................................................................................................12
CHAPTER 4: DATA ANALYSIS AND FINDING
Outline of the methodology
In the above investigation, the chosen research methodology is quantitative analysis. This
means that investigator has gathered and analysed numerical data for the study. Researcher has
collected data in number so that research aim and objectives can be attained in valid and reliable
manner. To gather the data investigator has chosen various method and tools so that right data
can be gathered for the investigator. To know the perception of the social world, investigator has
selected positivism philosophy. In this objective data will be gathered so that social world can be
recognised in effective manner. The phenomenon used by the investigator will develop the
nature, skill, in quantitative manner. To test the hypothesis investigator has selected deductive
approach. This is because with the help of this existing formulated hypothesis can be tested
easily. This help in evaluating the hypothesis and gather the accurate result for the investigation.
In the present investigation, researcher has selected primary data collection source. That means
that first-hand information so that real time data can be acquired. In this investigator directly
gathered the data from the participants so that accurate information can be gathered
appropriately. The source for gathering the primary data is questionnaire so that data can be
gathered from large pool of applicants.
To analyse and inspect the information investigator has chosen SPSS tool so that data can
be inspected easily. Using this software mathematical and statistical data can be calculated in
easy manner. with the help of SPSS researcher will test the formulated hypothesis so that they
can know the relationship between the variable in ease way. The test which is performed in the
current research is correlation and Annona so that data existing hypothesis can be tested in ease
manner. With the help of this software useful mathematical and statistical solution is acquired to
test the hypothesis.
Hypothesis 1
H0- There is not any association being present among board gender diversity and GHG
emissions that is scope 1 and 2 for FTSE 100 companies.
H1- There is an association being present among GHG emission and board gender diversity
relating to FTSE 100 companies.
⊘ This is a preview!⊘
Do you want full access?
Subscribe today to unlock all pages.
Trusted by 1+ million students worldwide
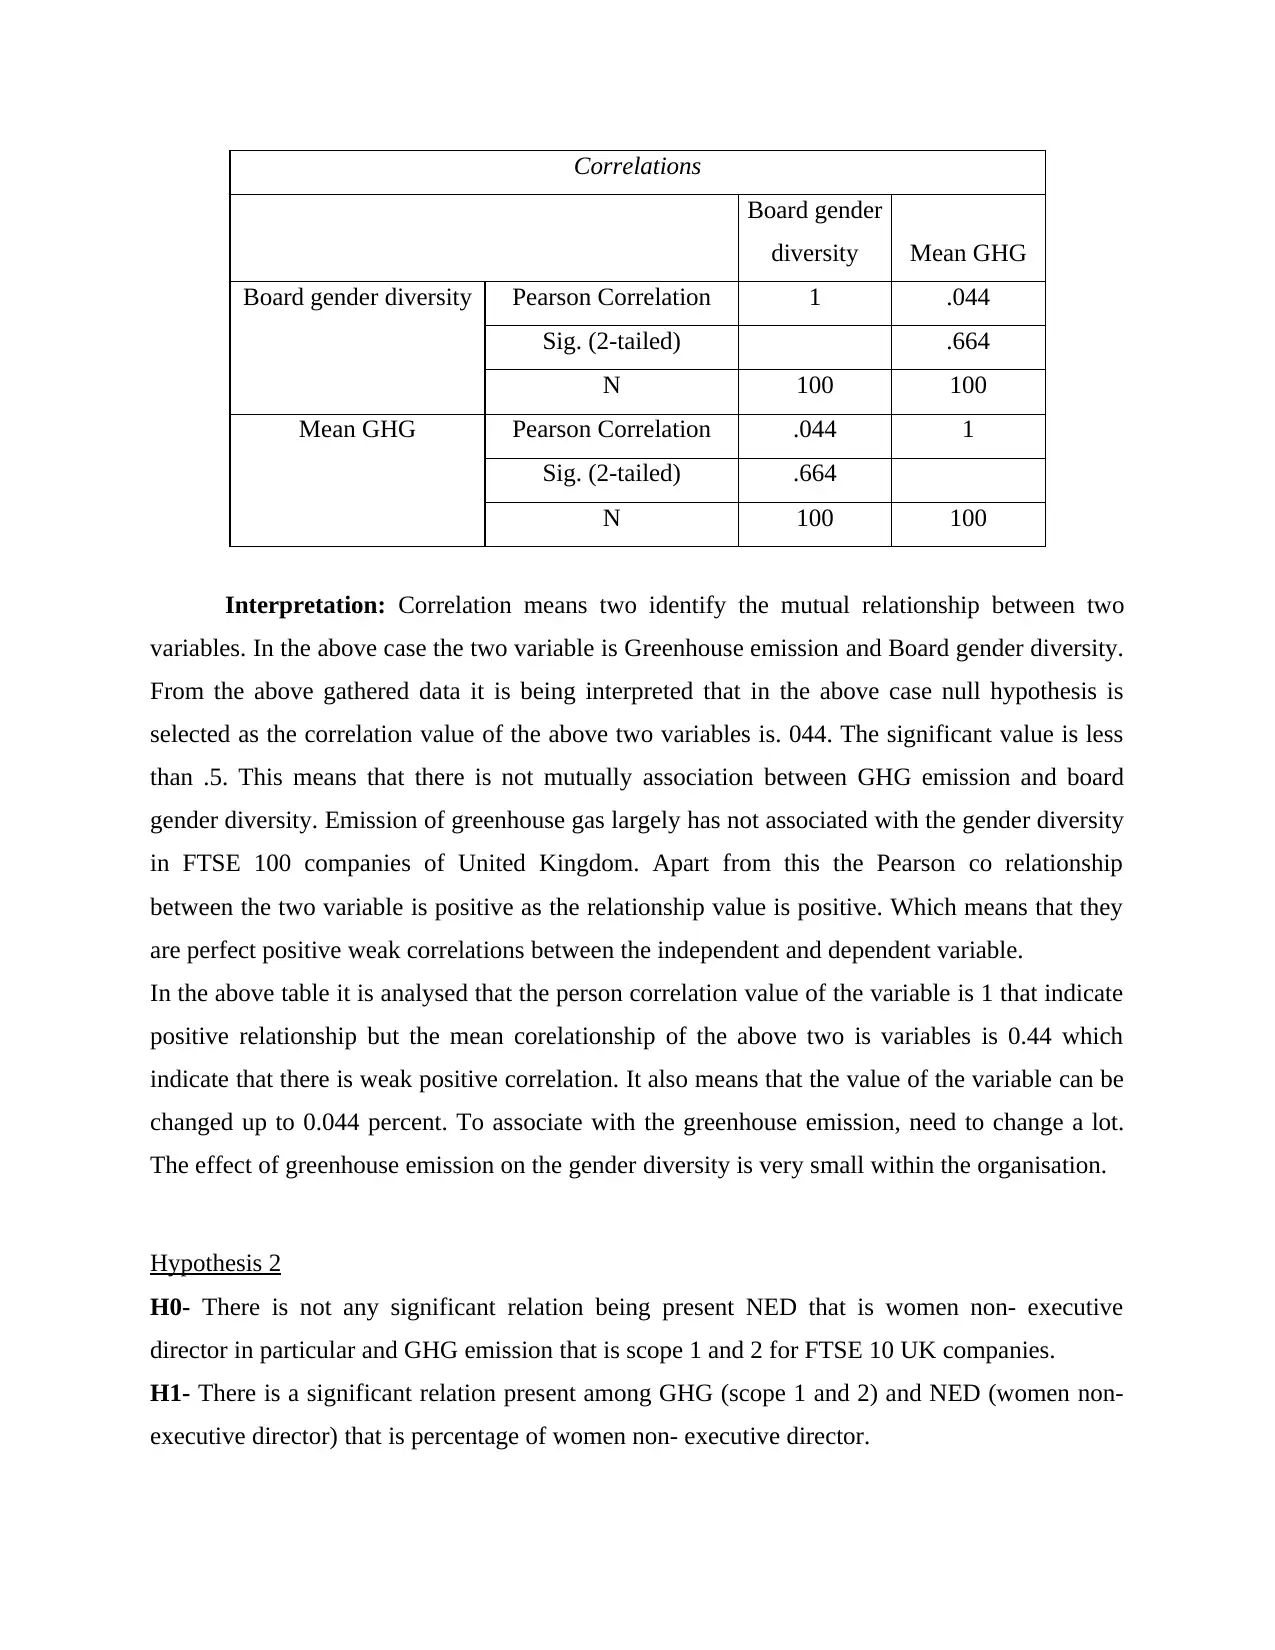
Correlations
Board gender
diversity Mean GHG
Board gender diversity Pearson Correlation 1 .044
Sig. (2-tailed) .664
N 100 100
Mean GHG Pearson Correlation .044 1
Sig. (2-tailed) .664
N 100 100
Interpretation: Correlation means two identify the mutual relationship between two
variables. In the above case the two variable is Greenhouse emission and Board gender diversity.
From the above gathered data it is being interpreted that in the above case null hypothesis is
selected as the correlation value of the above two variables is. 044. The significant value is less
than .5. This means that there is not mutually association between GHG emission and board
gender diversity. Emission of greenhouse gas largely has not associated with the gender diversity
in FTSE 100 companies of United Kingdom. Apart from this the Pearson co relationship
between the two variable is positive as the relationship value is positive. Which means that they
are perfect positive weak correlations between the independent and dependent variable.
In the above table it is analysed that the person correlation value of the variable is 1 that indicate
positive relationship but the mean corelationship of the above two is variables is 0.44 which
indicate that there is weak positive correlation. It also means that the value of the variable can be
changed up to 0.044 percent. To associate with the greenhouse emission, need to change a lot.
The effect of greenhouse emission on the gender diversity is very small within the organisation.
Hypothesis 2
H0- There is not any significant relation being present NED that is women non- executive
director in particular and GHG emission that is scope 1 and 2 for FTSE 10 UK companies.
H1- There is a significant relation present among GHG (scope 1 and 2) and NED (women non-
executive director) that is percentage of women non- executive director.
Paraphrase This Document
Need a fresh take? Get an instant paraphrase of this document with our AI Paraphraser
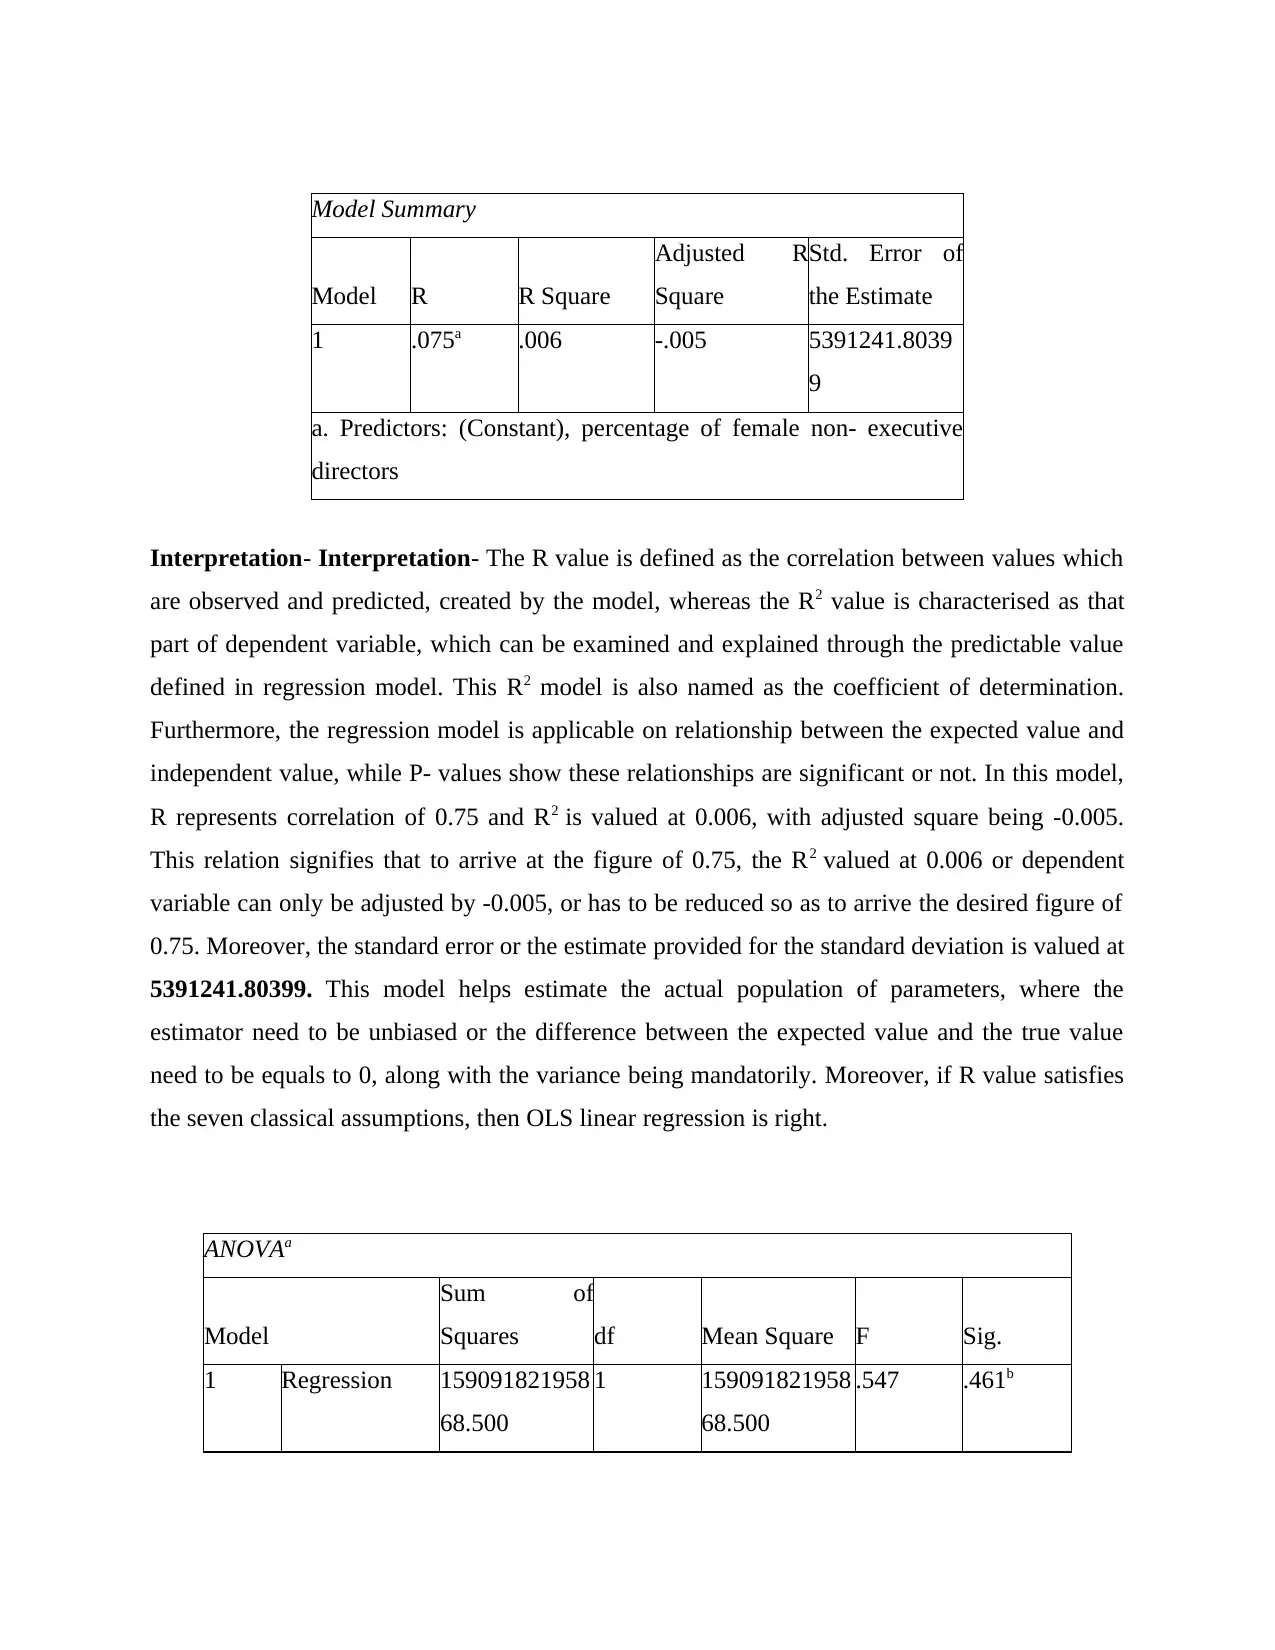
Model Summary
Model R R Square
Adjusted R
Square
Std. Error of
the Estimate
1 .075a .006 -.005 5391241.8039
9
a. Predictors: (Constant), percentage of female non- executive
directors
Interpretation- Interpretation- The R value is defined as the correlation between values which
are observed and predicted, created by the model, whereas the R2 value is characterised as that
part of dependent variable, which can be examined and explained through the predictable value
defined in regression model. This R2 model is also named as the coefficient of determination.
Furthermore, the regression model is applicable on relationship between the expected value and
independent value, while P- values show these relationships are significant or not. In this model,
R represents correlation of 0.75 and R2 is valued at 0.006, with adjusted square being -0.005.
This relation signifies that to arrive at the figure of 0.75, the R2 valued at 0.006 or dependent
variable can only be adjusted by -0.005, or has to be reduced so as to arrive the desired figure of
0.75. Moreover, the standard error or the estimate provided for the standard deviation is valued at
5391241.80399. This model helps estimate the actual population of parameters, where the
estimator need to be unbiased or the difference between the expected value and the true value
need to be equals to 0, along with the variance being mandatorily. Moreover, if R value satisfies
the seven classical assumptions, then OLS linear regression is right.
ANOVAa
Model
Sum of
Squares df Mean Square F Sig.
1 Regression 159091821958
68.500
1 159091821958
68.500
.547 .461b
Residual 284841784253
2776.000
98 290654881891
09.960
Total 286432702472
8644.500
99
a. Dependent Variable: Mean GHG
b. Predictors: (Constant), percentage of female non- executive directors
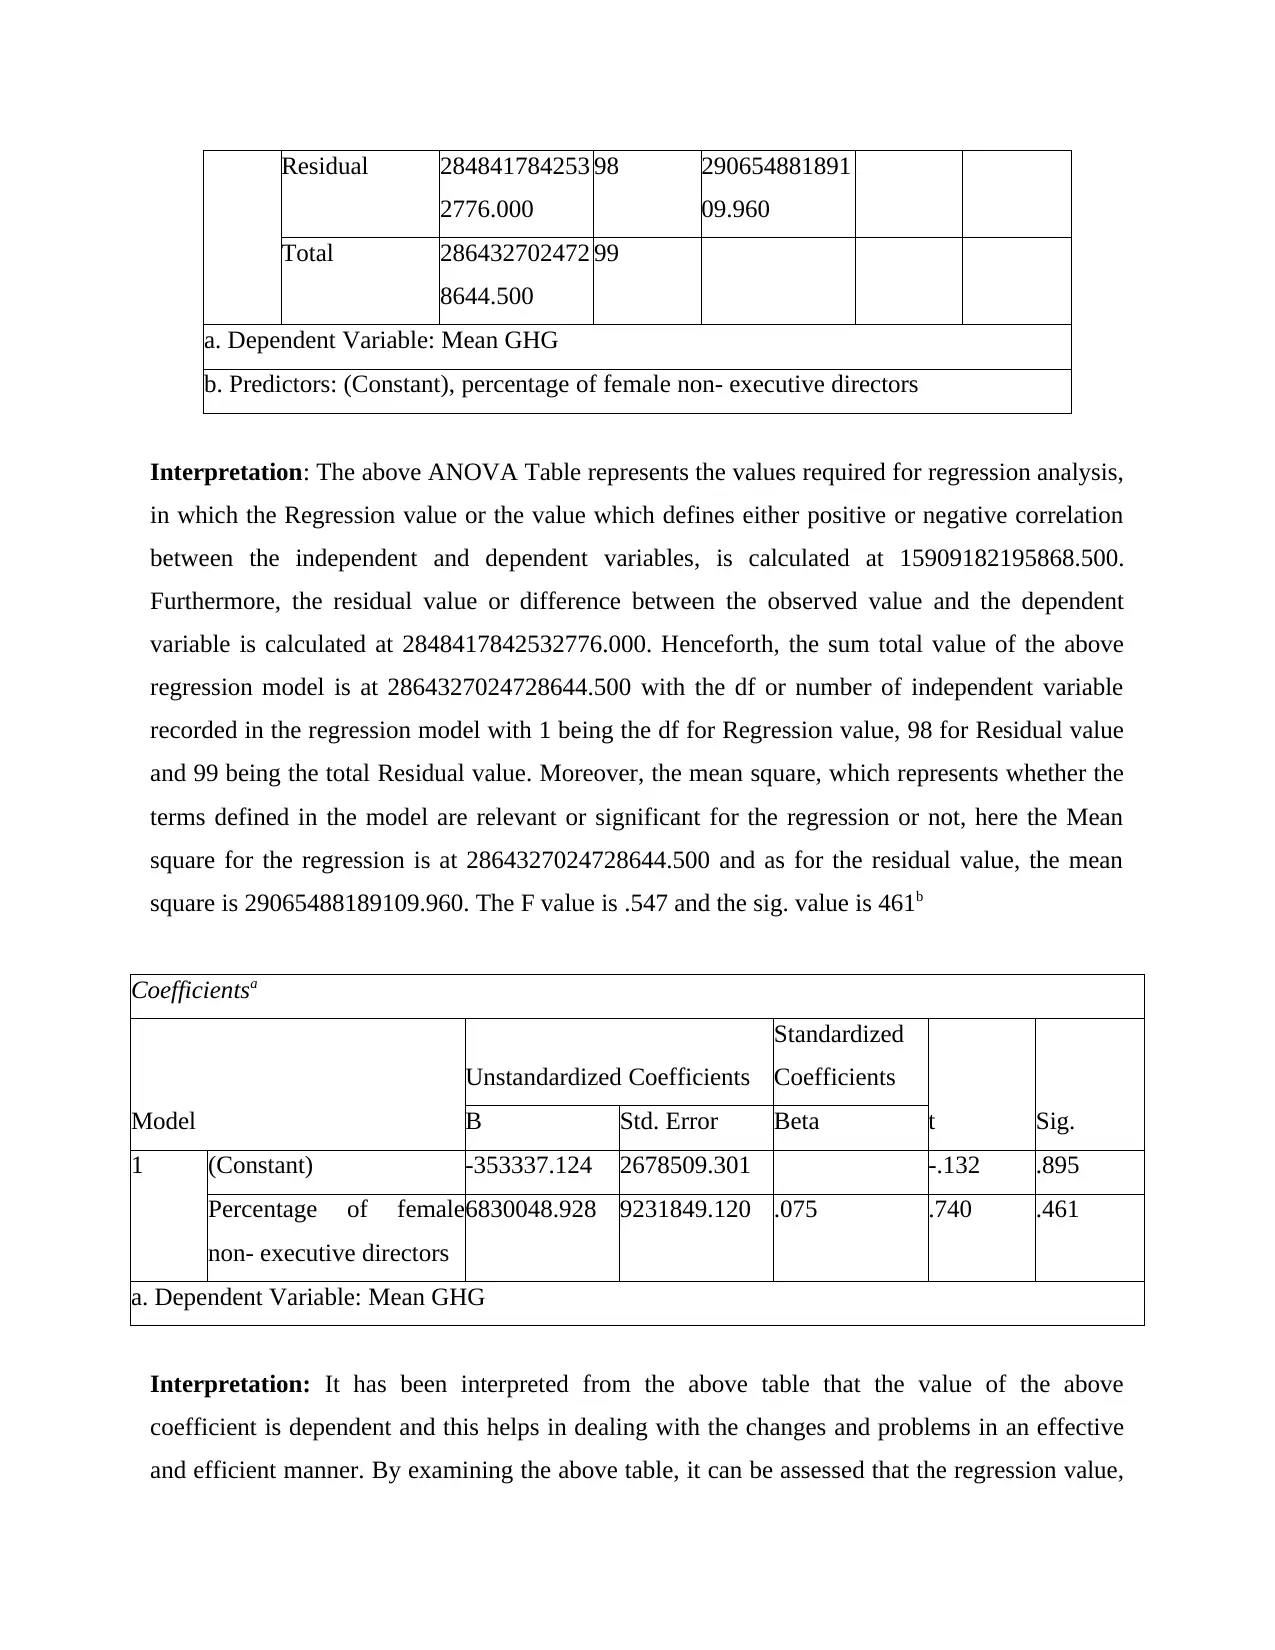
Interpretation: The above ANOVA Table represents the values required for regression analysis,
in which the Regression value or the value which defines either positive or negative correlation
between the independent and dependent variables, is calculated at 15909182195868.500.
Furthermore, the residual value or difference between the observed value and the dependent
variable is calculated at 2848417842532776.000. Henceforth, the sum total value of the above
regression model is at 2864327024728644.500 with the df or number of independent variable
recorded in the regression model with 1 being the df for Regression value, 98 for Residual value
and 99 being the total Residual value. Moreover, the mean square, which represents whether the
terms defined in the model are relevant or significant for the regression or not, here the Mean
square for the regression is at 2864327024728644.500 and as for the residual value, the mean
square is 29065488189109.960. The F value is .547 and the sig. value is 461b
Coefficientsa
Model
Unstandardized Coefficients
Standardized
Coefficients
t Sig.B Std. Error Beta
1 (Constant) -353337.124 2678509.301 -.132 .895
Percentage of female
non- executive directors
6830048.928 9231849.120 .075 .740 .461
a. Dependent Variable: Mean GHG
Interpretation: It has been interpreted from the above table that the value of the above
coefficient is dependent and this helps in dealing with the changes and problems in an effective
and efficient manner. By examining the above table, it can be assessed that the regression value,
2776.000
98 290654881891
09.960
Total 286432702472
8644.500
99
a. Dependent Variable: Mean GHG
b. Predictors: (Constant), percentage of female non- executive directors
Interpretation: The above ANOVA Table represents the values required for regression analysis,
in which the Regression value or the value which defines either positive or negative correlation
between the independent and dependent variables, is calculated at 15909182195868.500.
Furthermore, the residual value or difference between the observed value and the dependent
variable is calculated at 2848417842532776.000. Henceforth, the sum total value of the above
regression model is at 2864327024728644.500 with the df or number of independent variable
recorded in the regression model with 1 being the df for Regression value, 98 for Residual value
and 99 being the total Residual value. Moreover, the mean square, which represents whether the
terms defined in the model are relevant or significant for the regression or not, here the Mean
square for the regression is at 2864327024728644.500 and as for the residual value, the mean
square is 29065488189109.960. The F value is .547 and the sig. value is 461b
Coefficientsa
Model
Unstandardized Coefficients
Standardized
Coefficients
t Sig.B Std. Error Beta
1 (Constant) -353337.124 2678509.301 -.132 .895
Percentage of female
non- executive directors
6830048.928 9231849.120 .075 .740 .461
a. Dependent Variable: Mean GHG
Interpretation: It has been interpreted from the above table that the value of the above
coefficient is dependent and this helps in dealing with the changes and problems in an effective
and efficient manner. By examining the above table, it can be assessed that the regression value,
⊘ This is a preview!⊘
Do you want full access?
Subscribe today to unlock all pages.
Trusted by 1+ million students worldwide
which is represented by ‘B’ is calculated at -353337.124. The other value that is gained from the
above interpretation is 6830048.928 which represents the percentage of female non-executive
directors, with the standard error value for the constant condition being 2678509.301 and other
condition’s standard error is valued at 9231849.120, which helps in gaining high regression
value and this results in getting the value of Beta that is gained at .075 which is a positive value
so that they provide a proper and appropriate value.
Hypothesis 3
H0- There is not any effect being created over GHG emission by different variables like CSR,
ROA, board diversity, non- executive directors and market capitalisation.
H1- There is a significant impact created over GHG emission by changes in other variables that
is market capitalisation, NED, diversity of board, CSR and ROA.
Model Summary
Model R R Square
Adjusted R
Square
Std. Error of
the Estimate
1 .517a .267 .228 4749163.5020
1
a. Predictors: (
b. Constant), non- executive board director, board gender
diversity, CSR committee, market capitalization, ROA
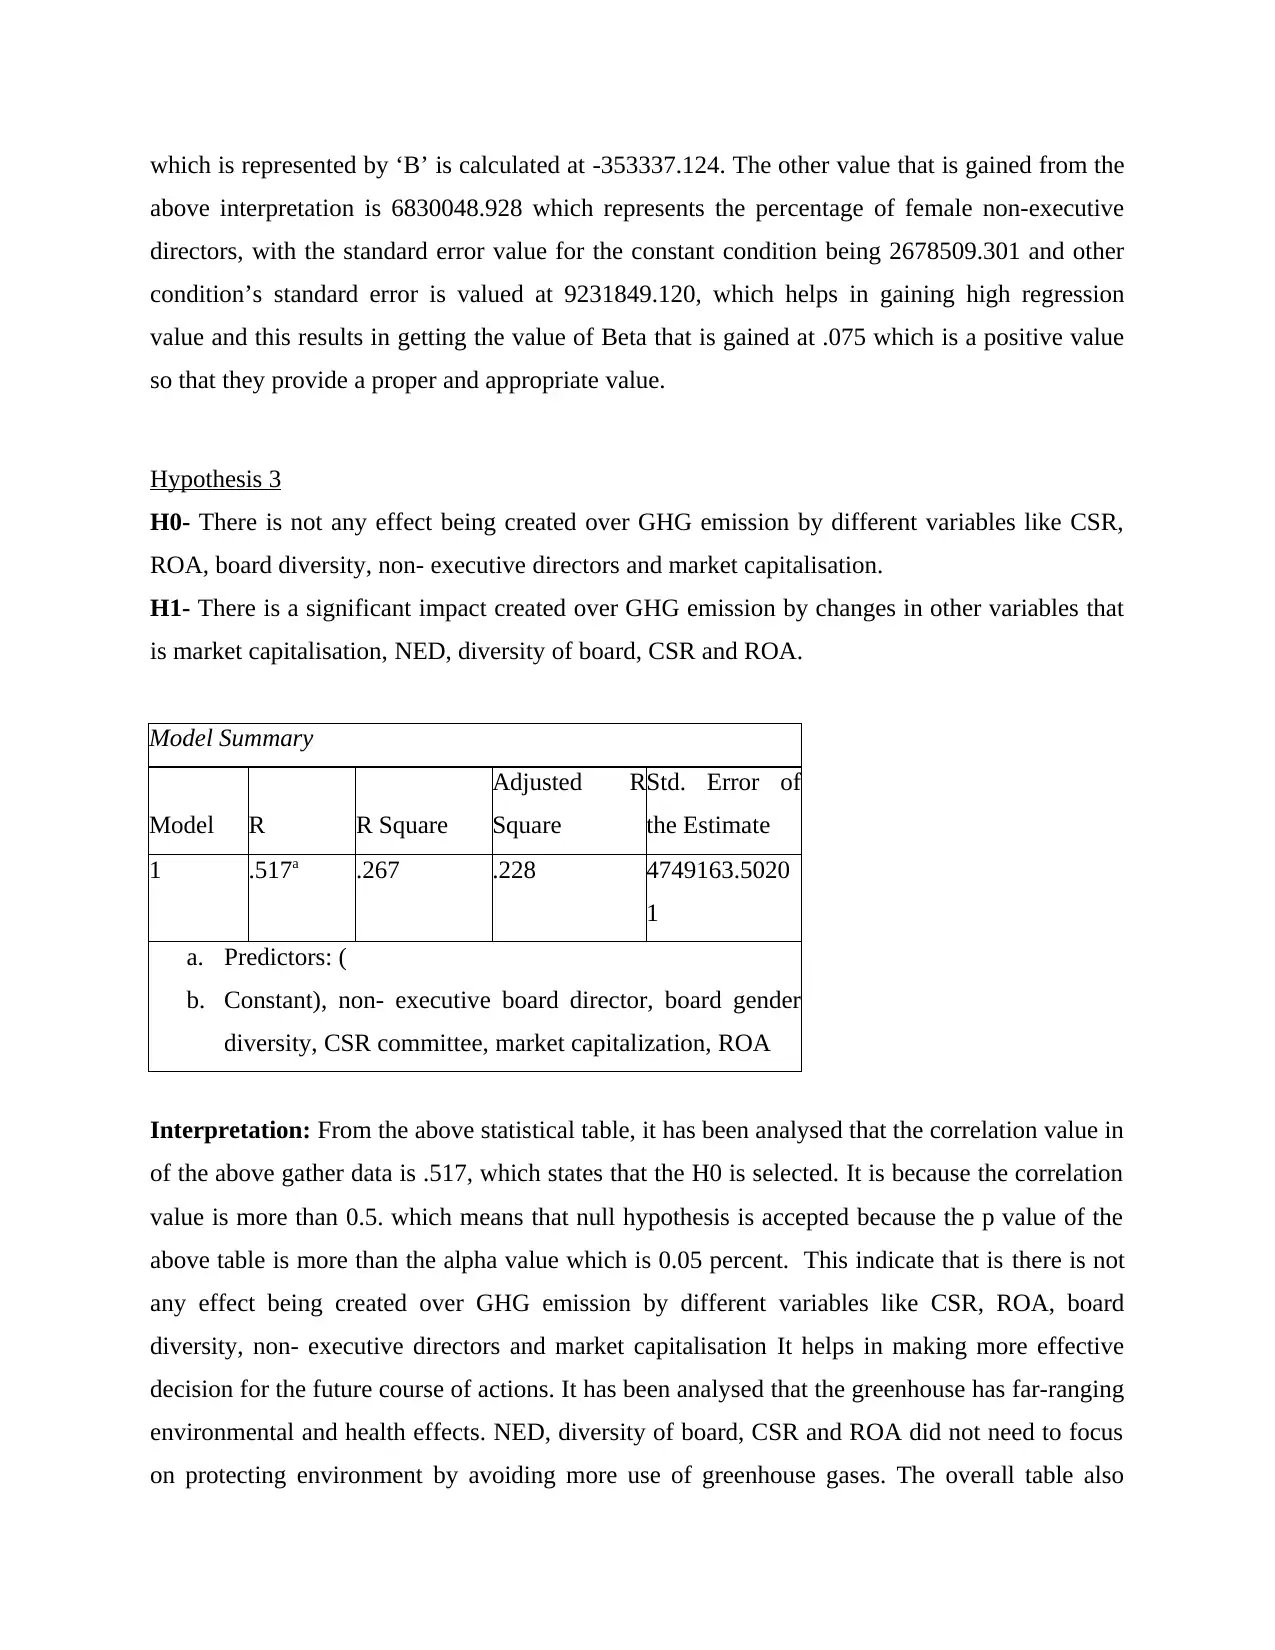
Interpretation: From the above statistical table, it has been analysed that the correlation value in
of the above gather data is .517, which states that the H0 is selected. It is because the correlation
value is more than 0.5. which means that null hypothesis is accepted because the p value of the
above table is more than the alpha value which is 0.05 percent. This indicate that is there is not
any effect being created over GHG emission by different variables like CSR, ROA, board
diversity, non- executive directors and market capitalisation It helps in making more effective
decision for the future course of actions. It has been analysed that the greenhouse has far-ranging
environmental and health effects. NED, diversity of board, CSR and ROA did not need to focus
on protecting environment by avoiding more use of greenhouse gases. The overall table also
above interpretation is 6830048.928 which represents the percentage of female non-executive
directors, with the standard error value for the constant condition being 2678509.301 and other
condition’s standard error is valued at 9231849.120, which helps in gaining high regression
value and this results in getting the value of Beta that is gained at .075 which is a positive value
so that they provide a proper and appropriate value.
Hypothesis 3
H0- There is not any effect being created over GHG emission by different variables like CSR,
ROA, board diversity, non- executive directors and market capitalisation.
H1- There is a significant impact created over GHG emission by changes in other variables that
is market capitalisation, NED, diversity of board, CSR and ROA.
Model Summary
Model R R Square
Adjusted R
Square
Std. Error of
the Estimate
1 .517a .267 .228 4749163.5020
1
a. Predictors: (
b. Constant), non- executive board director, board gender
diversity, CSR committee, market capitalization, ROA
Interpretation: From the above statistical table, it has been analysed that the correlation value in
of the above gather data is .517, which states that the H0 is selected. It is because the correlation
value is more than 0.5. which means that null hypothesis is accepted because the p value of the
above table is more than the alpha value which is 0.05 percent. This indicate that is there is not
any effect being created over GHG emission by different variables like CSR, ROA, board
diversity, non- executive directors and market capitalisation It helps in making more effective
decision for the future course of actions. It has been analysed that the greenhouse has far-ranging
environmental and health effects. NED, diversity of board, CSR and ROA did not need to focus
on protecting environment by avoiding more use of greenhouse gases. The overall table also
Paraphrase This Document
Need a fresh take? Get an instant paraphrase of this document with our AI Paraphraser
shows that the sum square of all the variables is 2.67. it also indicates that the variable square of
at the different variable can be adjusted to plus .228, that is in positive direction.
ANOVAa
Model
Sum of
Squares df Mean Square F Sig.
1 Regression 764451647234
840.200
5 152890329446
968.060
6.779 .000b
Residual 209757351909
8994.800
93 225545539688
06.395
Total 286202516633
3835.000
98
a. Dependent Variable: Mean GHG
b. Predictors: (Constant), non- executive board director, board gender diversity, CSR
committee, market capitalization, ROA
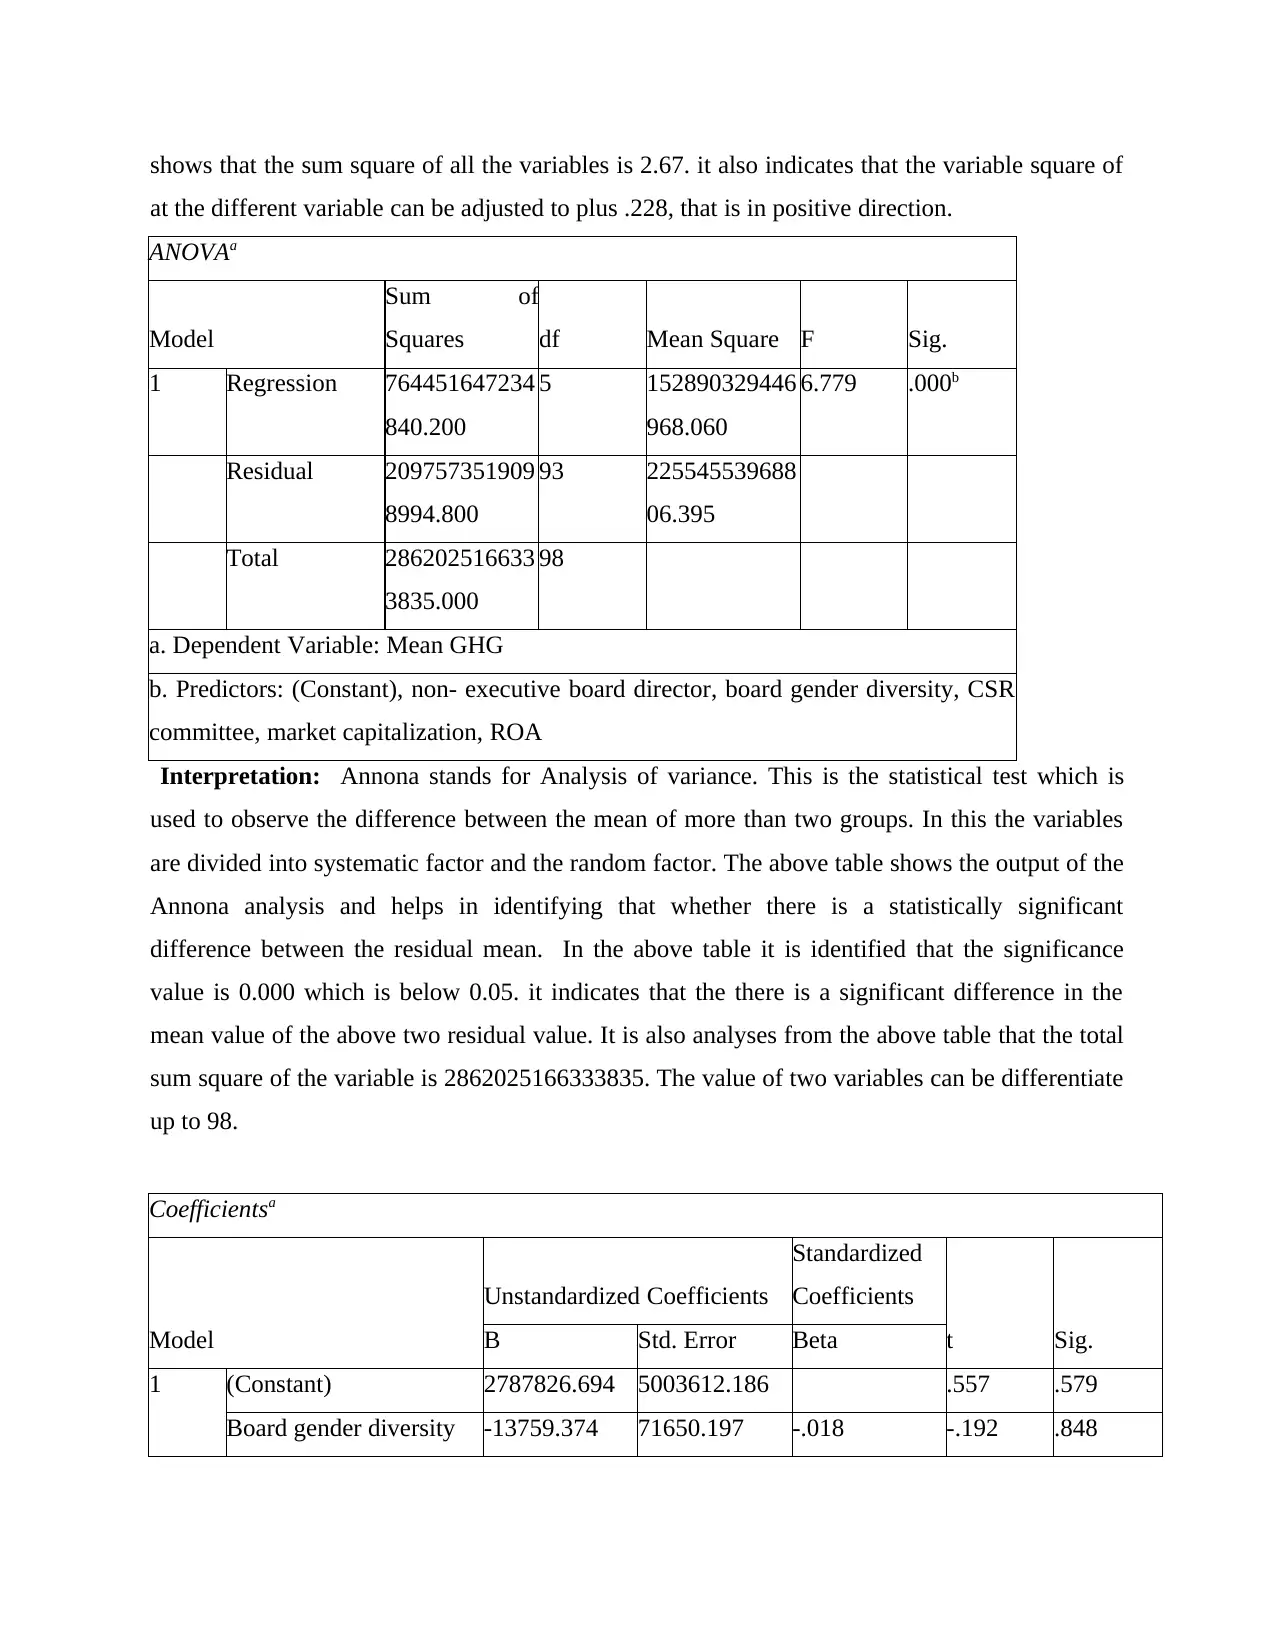
Interpretation: Annona stands for Analysis of variance. This is the statistical test which is
used to observe the difference between the mean of more than two groups. In this the variables
are divided into systematic factor and the random factor. The above table shows the output of the
Annona analysis and helps in identifying that whether there is a statistically significant
difference between the residual mean. In the above table it is identified that the significance
value is 0.000 which is below 0.05. it indicates that the there is a significant difference in the
mean value of the above two residual value. It is also analyses from the above table that the total
sum square of the variable is 2862025166333835. The value of two variables can be differentiate
up to 98.
Coefficientsa
Model
Unstandardized Coefficients
Standardized
Coefficients
t Sig.B Std. Error Beta
1 (Constant) 2787826.694 5003612.186 .557 .579
Board gender diversity -13759.374 71650.197 -.018 -.192 .848
at the different variable can be adjusted to plus .228, that is in positive direction.
ANOVAa
Model
Sum of
Squares df Mean Square F Sig.
1 Regression 764451647234
840.200
5 152890329446
968.060
6.779 .000b
Residual 209757351909
8994.800
93 225545539688
06.395
Total 286202516633
3835.000
98
a. Dependent Variable: Mean GHG
b. Predictors: (Constant), non- executive board director, board gender diversity, CSR
committee, market capitalization, ROA
Interpretation: Annona stands for Analysis of variance. This is the statistical test which is
used to observe the difference between the mean of more than two groups. In this the variables
are divided into systematic factor and the random factor. The above table shows the output of the
Annona analysis and helps in identifying that whether there is a statistically significant
difference between the residual mean. In the above table it is identified that the significance
value is 0.000 which is below 0.05. it indicates that the there is a significant difference in the
mean value of the above two residual value. It is also analyses from the above table that the total
sum square of the variable is 2862025166333835. The value of two variables can be differentiate
up to 98.
Coefficientsa
Model
Unstandardized Coefficients
Standardized
Coefficients
t Sig.B Std. Error Beta
1 (Constant) 2787826.694 5003612.186 .557 .579
Board gender diversity -13759.374 71650.197 -.018 -.192 .848
ROA -8091.805 26909.274 -.029 -.301 .764
Market capitalization .087 .016 .533 5.513 .000
CSR committee 163739.362 1709255.922 .009 .096 .924
Non- executive board
director
-35986.107 55367.084 -.062 -.650 .517
a. Dependent Variable: Mean GHG
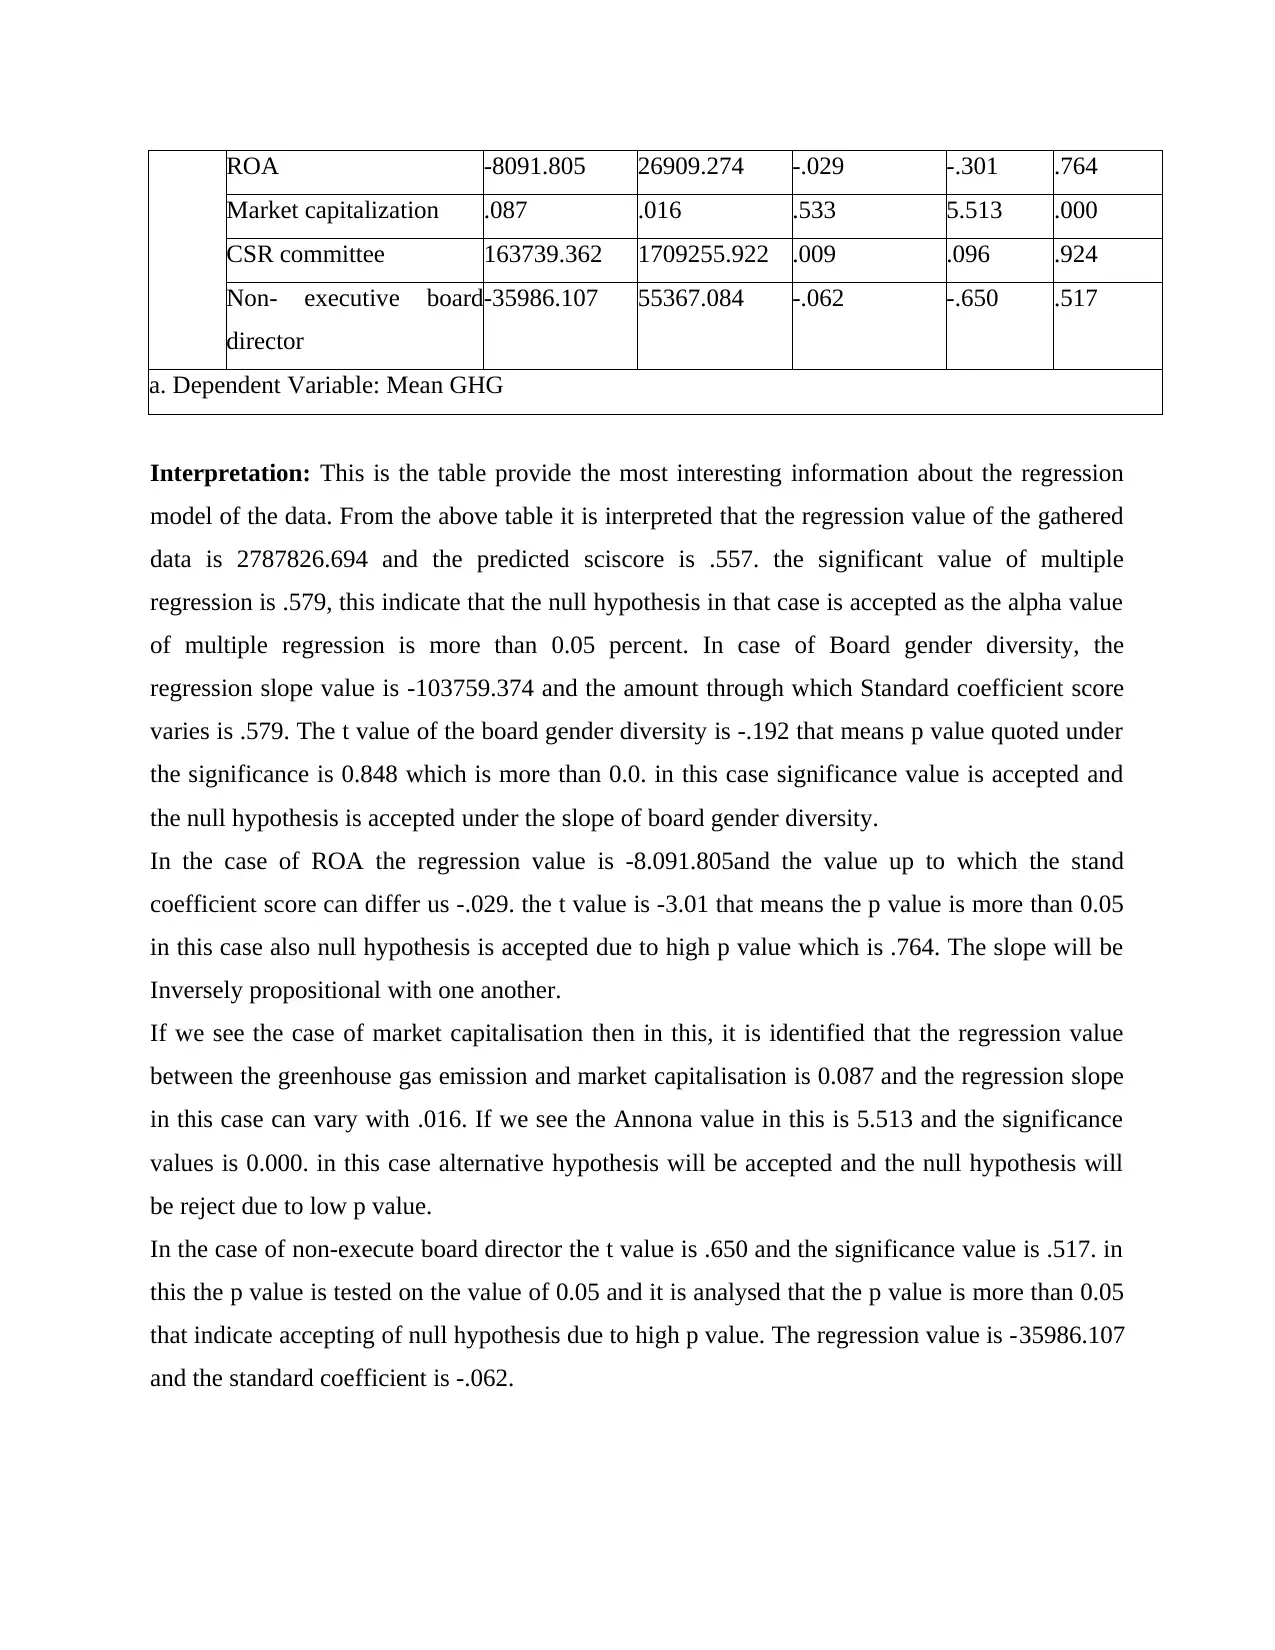
Interpretation: This is the table provide the most interesting information about the regression
model of the data. From the above table it is interpreted that the regression value of the gathered
data is 2787826.694 and the predicted sciscore is .557. the significant value of multiple
regression is .579, this indicate that the null hypothesis in that case is accepted as the alpha value
of multiple regression is more than 0.05 percent. In case of Board gender diversity, the
regression slope value is -103759.374 and the amount through which Standard coefficient score
varies is .579. The t value of the board gender diversity is -.192 that means p value quoted under
the significance is 0.848 which is more than 0.0. in this case significance value is accepted and
the null hypothesis is accepted under the slope of board gender diversity.
In the case of ROA the regression value is -8.091.805and the value up to which the stand
coefficient score can differ us -.029. the t value is -3.01 that means the p value is more than 0.05
in this case also null hypothesis is accepted due to high p value which is .764. The slope will be
Inversely propositional with one another.
If we see the case of market capitalisation then in this, it is identified that the regression value
between the greenhouse gas emission and market capitalisation is 0.087 and the regression slope
in this case can vary with .016. If we see the Annona value in this is 5.513 and the significance
values is 0.000. in this case alternative hypothesis will be accepted and the null hypothesis will
be reject due to low p value.
In the case of non-execute board director the t value is .650 and the significance value is .517. in
this the p value is tested on the value of 0.05 and it is analysed that the p value is more than 0.05
that indicate accepting of null hypothesis due to high p value. The regression value is -35986.107
and the standard coefficient is -.062.
Market capitalization .087 .016 .533 5.513 .000
CSR committee 163739.362 1709255.922 .009 .096 .924
Non- executive board
director
-35986.107 55367.084 -.062 -.650 .517
a. Dependent Variable: Mean GHG
Interpretation: This is the table provide the most interesting information about the regression
model of the data. From the above table it is interpreted that the regression value of the gathered
data is 2787826.694 and the predicted sciscore is .557. the significant value of multiple
regression is .579, this indicate that the null hypothesis in that case is accepted as the alpha value
of multiple regression is more than 0.05 percent. In case of Board gender diversity, the
regression slope value is -103759.374 and the amount through which Standard coefficient score
varies is .579. The t value of the board gender diversity is -.192 that means p value quoted under
the significance is 0.848 which is more than 0.0. in this case significance value is accepted and
the null hypothesis is accepted under the slope of board gender diversity.
In the case of ROA the regression value is -8.091.805and the value up to which the stand
coefficient score can differ us -.029. the t value is -3.01 that means the p value is more than 0.05
in this case also null hypothesis is accepted due to high p value which is .764. The slope will be
Inversely propositional with one another.
If we see the case of market capitalisation then in this, it is identified that the regression value
between the greenhouse gas emission and market capitalisation is 0.087 and the regression slope
in this case can vary with .016. If we see the Annona value in this is 5.513 and the significance
values is 0.000. in this case alternative hypothesis will be accepted and the null hypothesis will
be reject due to low p value.
In the case of non-execute board director the t value is .650 and the significance value is .517. in
this the p value is tested on the value of 0.05 and it is analysed that the p value is more than 0.05
that indicate accepting of null hypothesis due to high p value. The regression value is -35986.107
and the standard coefficient is -.062.
⊘ This is a preview!⊘
Do you want full access?
Subscribe today to unlock all pages.
Trusted by 1+ million students worldwide
CONCLUSION
It is being concluded from the above information that greenhouse emission gas creates a great
impact on the human activities as it is produced by burning fuel for power or heat and through
chemical reactions. The four main greenhouse gases are overview, carbon dioxide, methane,
nitrous oxide, fluorinated gases and many others. These greenhouse gases create a negative
impact on the environment. The biggest source of greenhouse gases is burning fossil fuels for
heat, electricity and transportation. In order to reduce greenhouse gases, it is important to use
renewable energy, install solar lights, use energy saving materials and many others. There are
various theories implemented such as legitimacy theory, the agency theory, and the stakeholder
theory. Corporate greenhouse gas emission also creates a great impact on the society and
environment. Company, government, environmental groups, scientists and other stakeholders of
business are encouraging to boost the efficiency of their corporate governance mechanism. The
most important corporate governance mechanism that has proven its effectiveness is board
gender diversity. It means male and female have equal participation in board and also they can
contribute in decision making process equally. Thus, the presence of women is considered as
positive within an organisation and also helps in creating strong brand image and reputation. It is
being identified that the higher the proportion of female within an organisation the greater the
reduction in GHG emissions. It is also being determined that the higher the number of non-
executive directors in the corporate boardroom, the better the environmental performance of
businesses which helps in reducing carbon emission. From the above study, it has been
concluded that mitigation of greenhouse gas (GHG) and other harmful emissions is creating
many challenged and issues for the environment because it is reducing the business's carbon
footprints. It is affecting the firm’s decision while taking the serious decisions steps for the
business. There are two main factors of literature such as corporate governance characteristics
and other companies. Where effective corporate governance refers to the strive that helps to
achieve the equilibrium between the social objectives and financial objectives. It is also striving
between communal purpose and personal. It has been analysed from the above that they are
using the sample size between 144 companies which are listed on the FTSE index. It is also
found the negative link between the female directors and CSR communities within the firms and
GHG emissions. It has based on the above analysed of data that is derived from the best and top
Paraphrase This Document
Need a fresh take? Get an instant paraphrase of this document with our AI Paraphraser
hundred firms of Australia between 2016 and 2018. on the other hand, corporate governance
characteristics and other business functions is including the profitability and its size as well
which is the important aspects for their policy towards influencing the external environment. It is
the tendency which is reducing the carbon emissions-related levels from the business as well. It
has been concluded from the above by utilizing the literature it is justify and clarifying the
relation between the ratio of female’s executives and business policies which is regarding the to
the external environment. There are some more emissions-related to the environment which
include legitimacy theory which claims to the legitimize theory for operating the policies for the
disclosure to the external environment. On the other hand, regarding corporate GHG emissions-
related which is reducing the management frequency as well.
From the overall investigation it is concluded that there is no significant association of
greenhouse emission with all the other variables which CSR, ROA, board diversity, non-
executive directors and market capitalisation. No effect is being created over GHG emission by
different variables and they all function independently. There is no significant dependency of the
variable on greenhouse gas emission. In the above study various test is being run to see the effect
created by the different variable on greenhouse gas emission. Some of the test which is run in the
above investigation are correlation test, regression analysis and t test. All this helps in finding the
valid and accurate result for the investigation. It is also identified that in most of the cases the P
value is more than the significance Value which is 0.05 percent. So in most of the cases null
hypothesis is accepted which indicate that there is no effect created on greenhouse emission by
other variable study in the investigation.
REFERENCES
Books and Journals
Shen, M and et. al., 2020. (Micro) plastic crisis: un-ignorable contribution to global greenhouse
gas emissions and climate change. Journal of Cleaner Production, 254, p.120138.
Panchasara, H., Samrat, N. H. and Islam, N., 2021. Greenhouse gas emissions trends and
mitigation measures in australian agriculture sector—A review. Agriculture, 11(2), p.85.
Liobikienė, G. and Butkus, M., 2019. Scale, composition, and technique effects through which
the economic growth, foreign direct investment, urbanization, and trade affect
greenhouse gas emissions. Renewable Energy, 132, pp.1310-1322.
Liu, Z and et. al., 2021. How does the global plastic waste trade contribute to environmental
benefits: Implication for reductions of greenhouse gas emissions?. Journal of
Environmental Management, 287, p.112283.
Deng, Q an et. al., 2020. Greenhouse gas emissions, non-renewable energy consumption, and
output in South America: the role of the productive structure. Environmental Science and
Pollution Research, 27(13), pp.14477-14491.
Hertwich, E., 2019. The carbon footprint of material production rises to 23% of global
greenhouse gas emissions (No. n9ecw). Center for Open Science.
⊘ This is a preview!⊘
Do you want full access?
Subscribe today to unlock all pages.
Trusted by 1+ million students worldwide
1 out of 12
Related Documents


Your All-in-One AI-Powered Toolkit for Academic Success.
+13062052269
info@desklib.com
Available 24*7 on WhatsApp / Email
![[object Object]](/_next/static/media/star-bottom.7253800d.svg)
Unlock your academic potential
Copyright © 2020–2026 A2Z Services. All Rights Reserved. Developed and managed by ZUCOL.