Global Networks and Innovation: Fujitsu Ltd Network Analysis Project
VerifiedAdded on 2020/07/23
|11
|2439
|31
Project
AI Summary
This project analyzes Fujitsu Ltd's internationalization strategy and global network, focusing on the visualization of parent-subsidiary relationships using network analysis techniques. The project utilizes Netdraw software to create network visualizations, employing centrality measures such as closeness, betweenness, and eigenvector centrality to understand the structure and influence within the network. The introduction provides an overview of Fujitsu Ltd's internationalization strategy, highlighting its expansion through subsidiary companies to promote innovation and geographical presence. The analysis details the process of creating edge lists, importing them into Netdraw, and interpreting the resulting network visualizations. The project also explores the implications of industry and country environments on Fujitsu's innovation strategy, emphasizing the importance of innovation for competitiveness. The conclusion summarizes the findings, highlighting the usefulness of Netdraw in visualizing network relationships and the positive impact of Fujitsu's internationalization strategy on its market leadership. The project also includes an analysis of Fujitsu's revenue by segment, illustrating the company's diverse product portfolio and its contribution to its global presence and competitive advantage.

Global Networks and Innovation project
Paraphrase This Document
Need a fresh take? Get an instant paraphrase of this document with our AI Paraphraser

Table of Contents
INTRODUCTION................................................................................................................................1
Overview of the internationalization strategy..................................................................................1
Network analysis techniques and visualizations to present parent-subsidiary network..................2
Network centrality measures...........................................................................................................3
Implications of the industry and country environment on innovation strategy...............................6
CONCLUSION....................................................................................................................................7
REFERENCES.....................................................................................................................................8
INTRODUCTION
In the complex environment, companies use various techniques to analyze various things
and relationship. Network diagram is one of the tool that is use to visualize various components and
their relationship. Fujitsu Ltd is an Information and Communication Technology Provider (ICT) that
had rapidly expanded its operations all across the globe. The main strategy of the business
enterprise is to promote innovation and expand its geographical presence across distinctive parts of
the world by establishing subsidiaries companies so as to attain long-term success. The aim of the
current research is to visualize parent and subsidiary relationship for Fujitsu Ltd. It will be created
in Netdraw software using different centrality measures such as closeness, betweenness and
eigenvector relationship.
Overview of the internationalization strategy
In current times, each and every company focuses on expanding their businesses into
number of countries so as to create multinational presence. Internationalization strategy seems a
great interest in the corporate world and in economy; it is define as a process wherein business get
involved in the international marketplace. The strategy significantly changed the business landscape
due to dynamic market environment with severe rivalries giving tough competition to the enterprise.
There are many reasons why company decides to internationalize their functions including
expanding their audience base, cheaper availability of resources like material and labour in overseas
market, benefits of economies of scale, higher market share and many others.
Considering Fujitsu Limited, it is a multinational corporation that operates in many countries
of the world. Company had successfully expanded its business across number of nations to
popularize its brand in the international marketplace. Under the internationalization strategy, it had
established its own subsidiary firms into other countries which are controlled by the parent, Fujitsu
Ltd. It supervises, administrate, monitor and control the working of subsidiary undertakings and
make plans to succeed in the competitive market. Again, subsidiaries firms established own firms
under the part of its expansion (Katoh, 2006). Organization had found diversified businesses
operating in technological solution, transaction solution, investment Company, consulting firm,
retirement management, network communication, microelectronics, computer products, mobile
electronics, automotive, financial service, insurance management and many others. It had
strengthen its product portfolio and grab the benefit through attracting maximum number of people
all over the globe.
The internationalization strategy of expanding business unit into various locations benefited
Fujitsu Ltd to take the benefit of market opportunity by serving crowded audiences with its
1
⊘ This is a preview!⊘
Do you want full access?
Subscribe today to unlock all pages.
Trusted by 1+ million students worldwide
diversified product portfolio. With the help of it, undertaking became able to capture greater share
in the market during stiff competitive era and successfully compete with the rivals. Expansion in
London, Canada, America, China, Korea, Australia, Asia, Luxembourg and other nations had
contributed wonderfully in establishing its presence in the international market (Fujitsu Ltd’s
competitive IT strategy, 2016). At the same time, incorporating new products in its product portfolio
like retirement management, financial services, consultancy and others is the part of its
diversification strategy which definitely contributes towards strengthening its total group turnover.
The plan had enable entity to maximize its profitability and business performance, as a result, firm
had stable its position and stay competitively strong.
Network analysis techniques and visualizations to present parent-subsidiary network
The most important step in network creation is to create edge list or a list of node pairs in the
MS spreadsheet. In order to construct network-visualization in Netdraw presenting parent and
subsidiary firm, edgelist-containing information can be imported in .dl-formatted file. When file is
imported into Netdraw, it automatically created a visualization map using default setting. It works
on a standard algorithm so as to push the connected or related notes to the centre and least
connected nodes are depicted in the periphery. Network visualization is a powerful tool to provide
a clear insight to present the parent and subsidiary relationship. Netdraw is one of the useful
software that clearly visualizes interactions between groups. It is mainly used for creating social
network model. The analysis presents three fundamental ways of presentation that includes degree
centrality, closeness and eigenvector centrality.
Network visualization main target is to create a meaningful presentation of a visual network
dataset. Its creation entirely depends on the particular algorithm as well as output media. NetDraw
is one of the great tool that has various editing features and options that allows users to create better
visualization so as to convey a clear meaning of the data to the reader. Nodes can be easily moved
from its position just by clicking and dragging feature (Borgatti, 2002). Besides this, size, shape,
color, labelling and other features are quite interesting that helps in better presentation. It is the
ethical accountability of every researcher to make it sure that all the editing that he or she is going
to use is only applied for the purpose of enhancing the data communication to present it more
effectively. The most significant way of this is to start the network visualization through standard
algorithm and minimize editing strictly just to clarify its meaning.
2
Paraphrase This Document
Need a fresh take? Get an instant paraphrase of this document with our AI Paraphraser
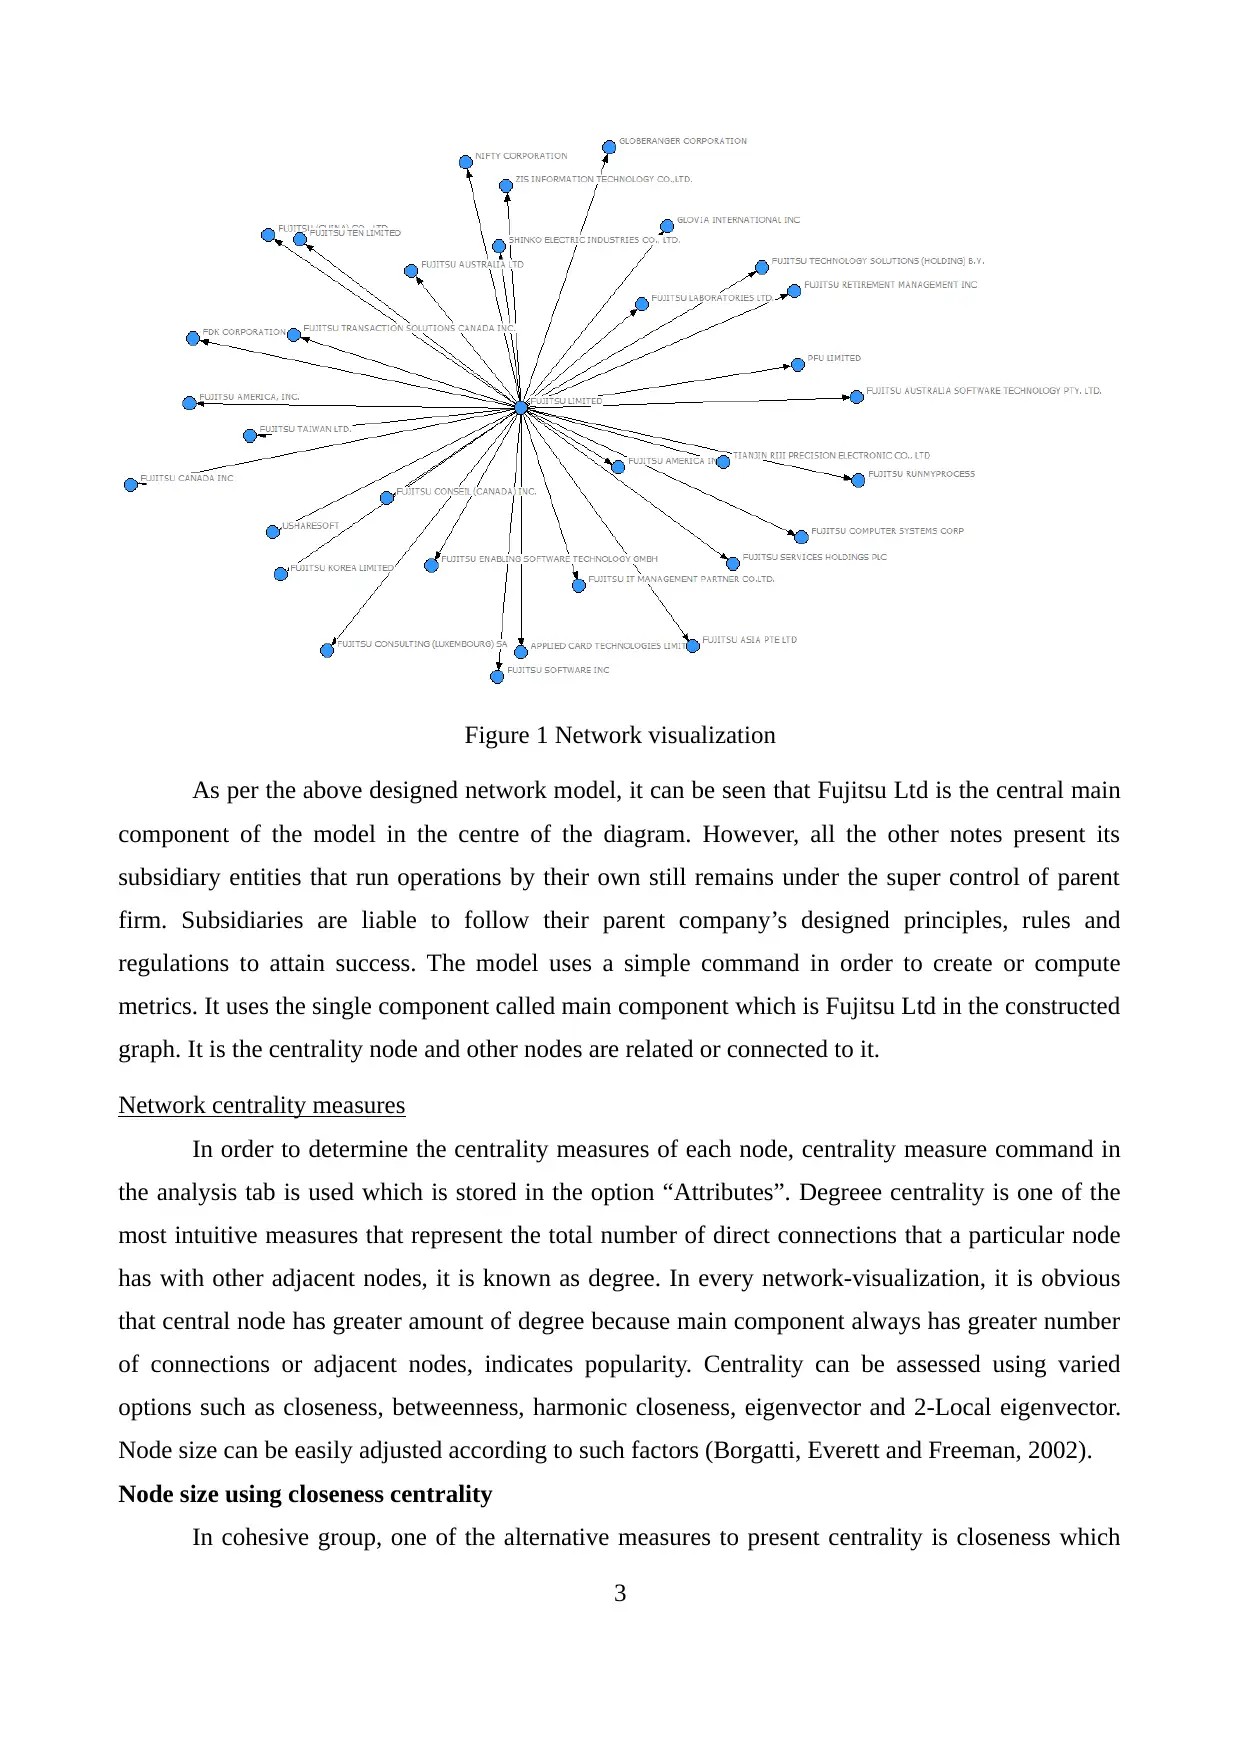
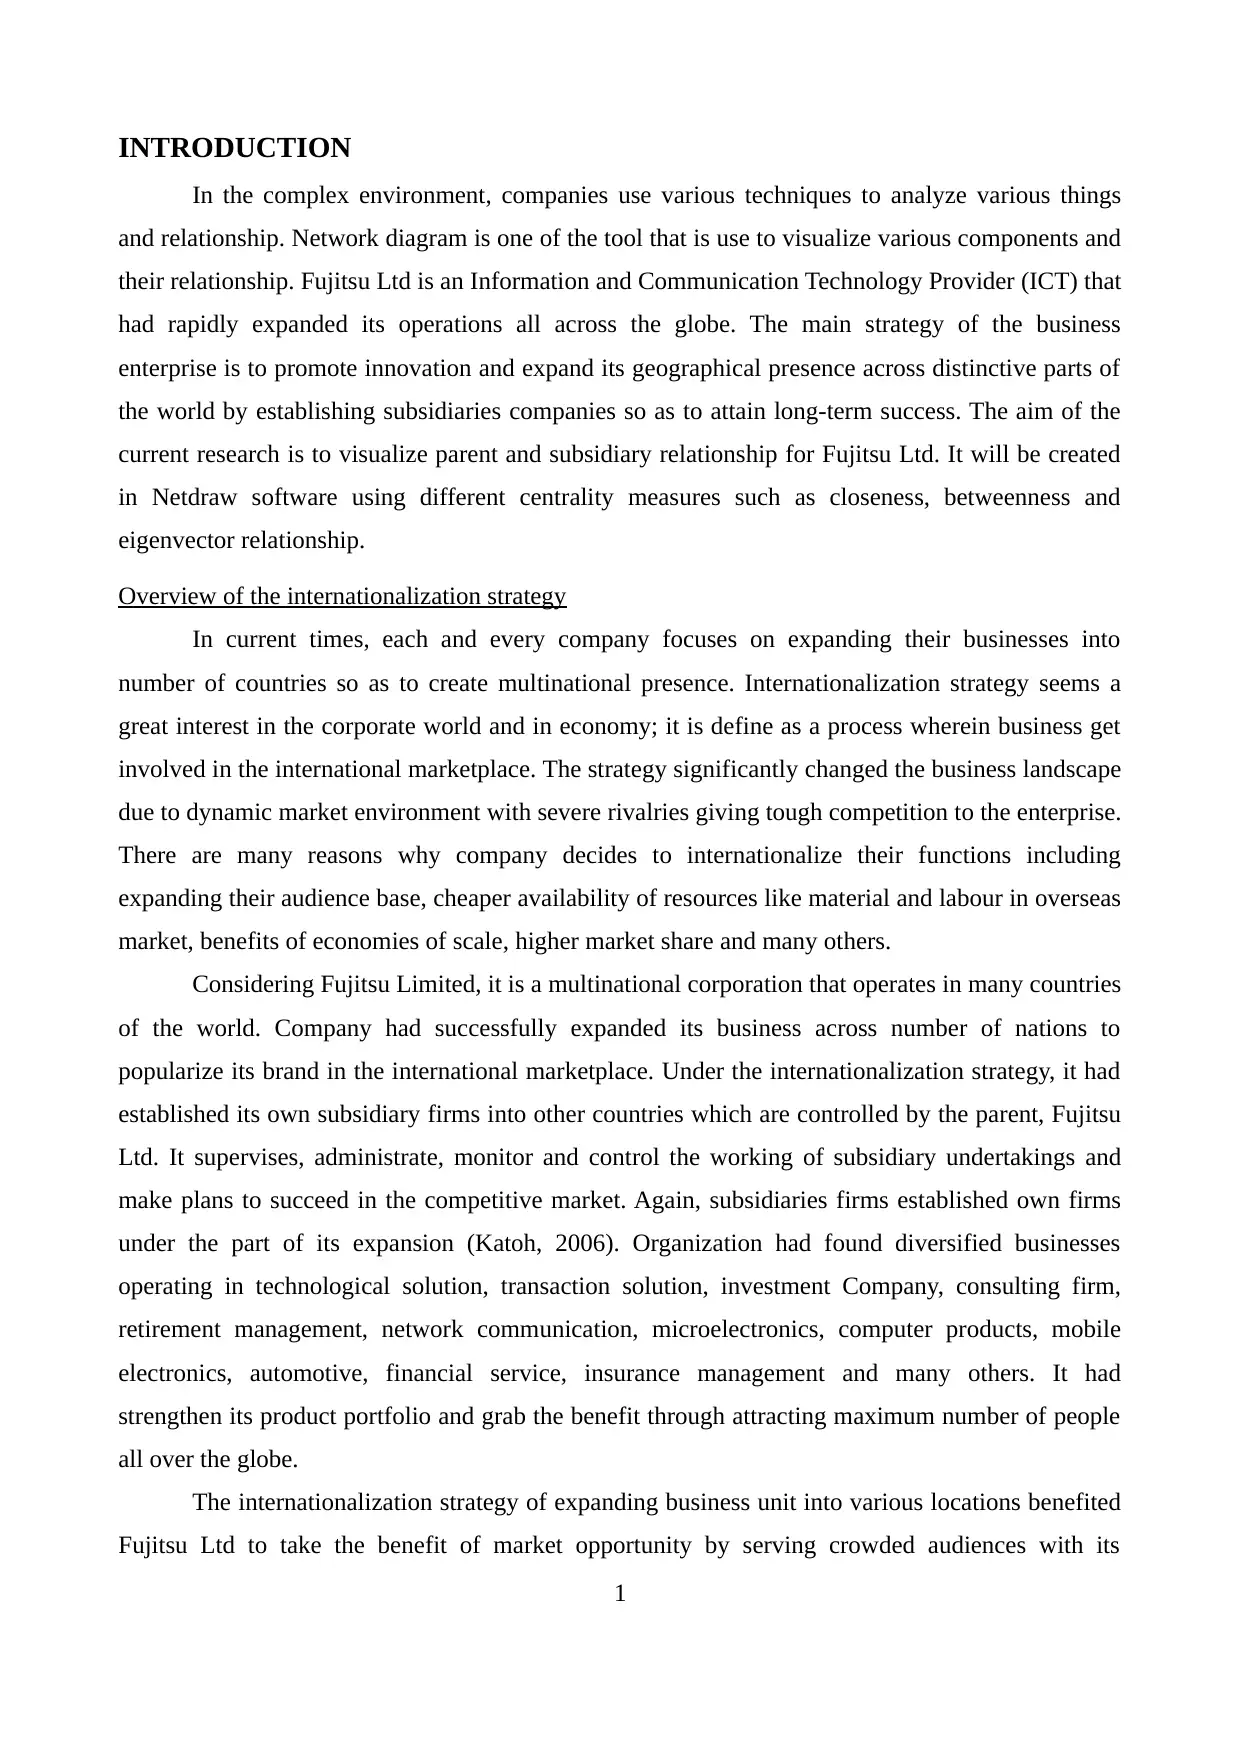
Figure 1 Network visualization
As per the above designed network model, it can be seen that Fujitsu Ltd is the central main
component of the model in the centre of the diagram. However, all the other notes present its
subsidiary entities that run operations by their own still remains under the super control of parent
firm. Subsidiaries are liable to follow their parent company’s designed principles, rules and
regulations to attain success. The model uses a simple command in order to create or compute
metrics. It uses the single component called main component which is Fujitsu Ltd in the constructed
graph. It is the centrality node and other nodes are related or connected to it.
Network centrality measures
In order to determine the centrality measures of each node, centrality measure command in
the analysis tab is used which is stored in the option “Attributes”. Degreee centrality is one of the
most intuitive measures that represent the total number of direct connections that a particular node
has with other adjacent nodes, it is known as degree. In every network-visualization, it is obvious
that central node has greater amount of degree because main component always has greater number
of connections or adjacent nodes, indicates popularity. Centrality can be assessed using varied
options such as closeness, betweenness, harmonic closeness, eigenvector and 2-Local eigenvector.
Node size can be easily adjusted according to such factors (Borgatti, Everett and Freeman, 2002).
Node size using closeness centrality
In cohesive group, one of the alternative measures to present centrality is closeness which
3
does not consider the position of other nodes that are the part of network diagram. The factor
closeness can be perceived in the terms of farness, reciprocal which can be found by adding
together the path distance by shifting from one node to other. In Netdraw, such measures can be
captured through using analysis/centrality measure command. Closeness, as name itself, determines
the degree to ascertain that which nodes are near to other networks or nodes. Thus, by this way, it is
adverse to the total of shortest path distance. Here, it is necessary to report that by default,
programme always depicts farness instead of centrality. Henceforth, in order to correct it and
present closeness, it is essential to check reverse values option so as to adjust the size of nodes by
selecting closeness attributes. It measures the mean distance of the node from vertex to other
vertices.
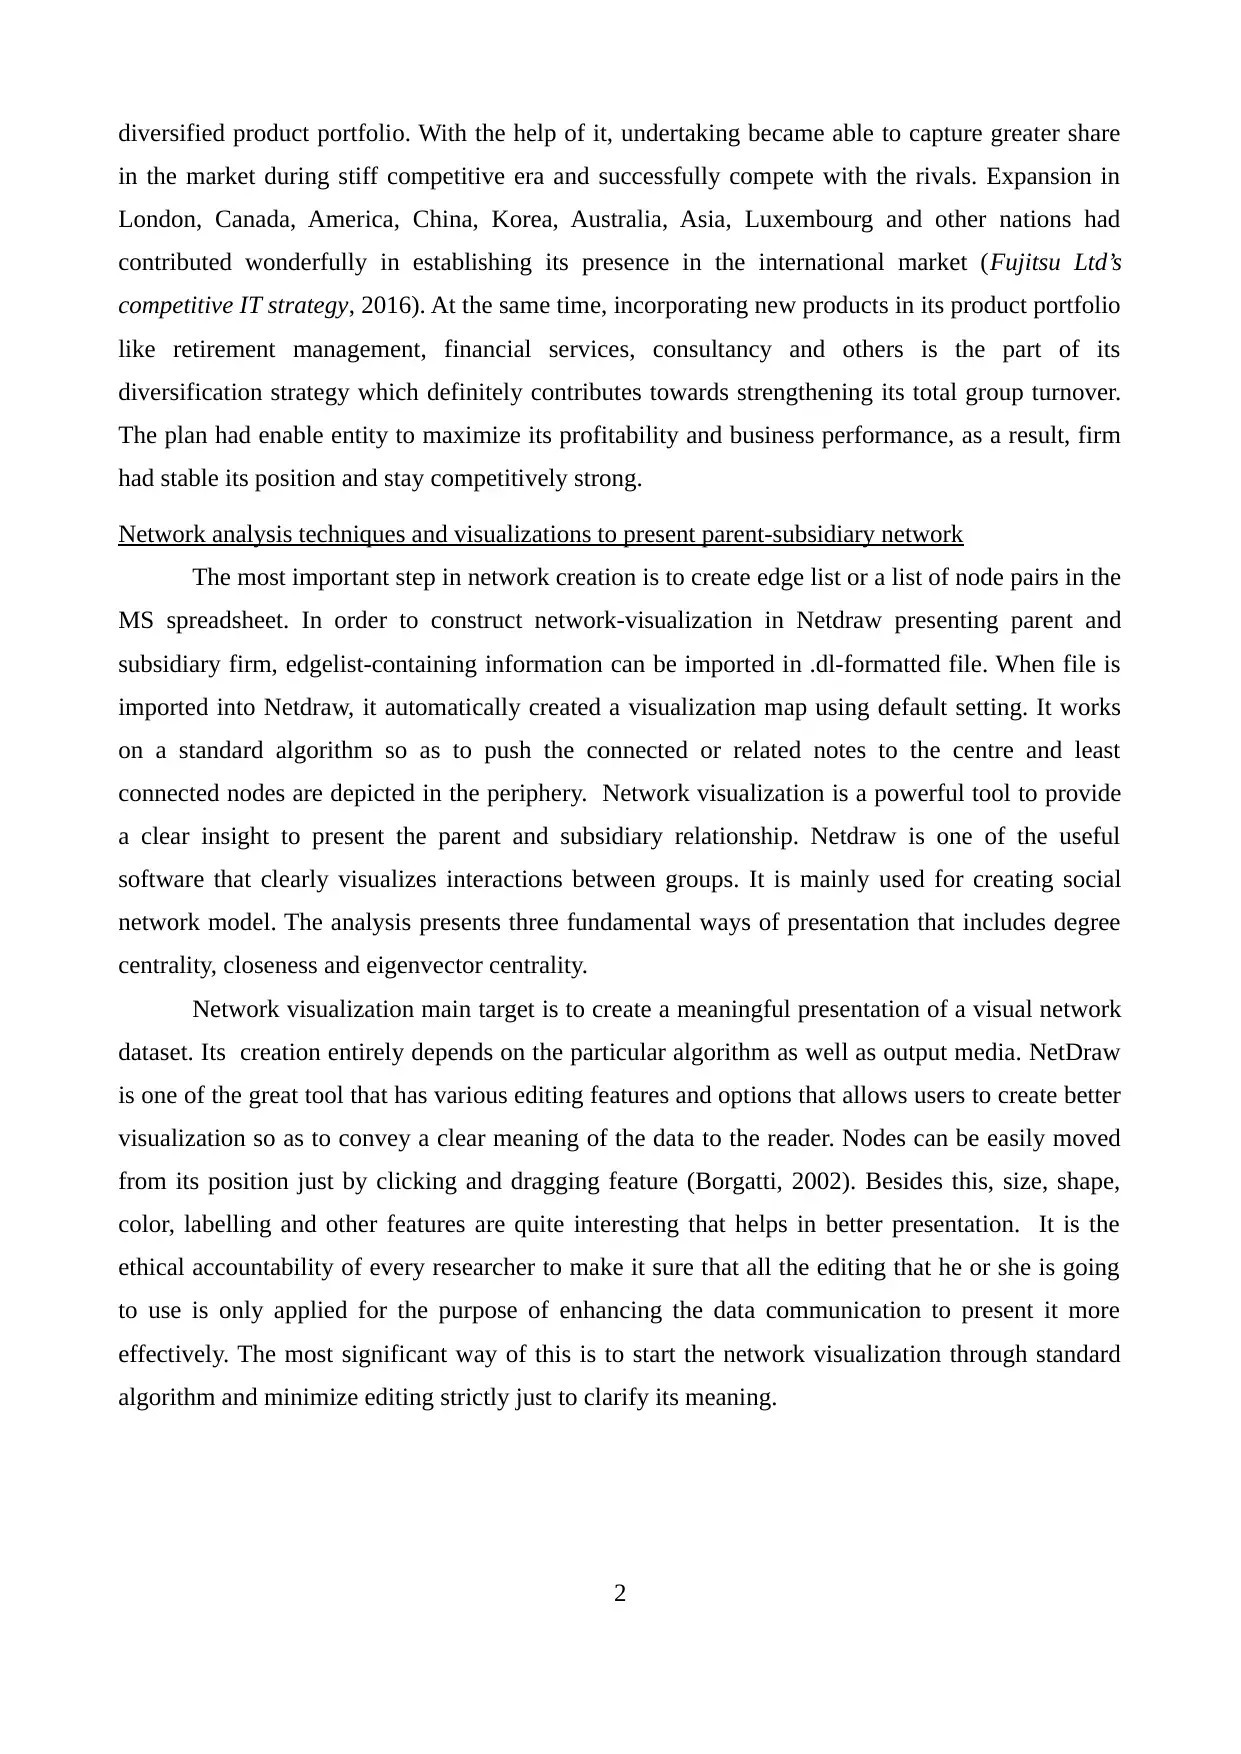
Figure 2 Network visualization by closeness centrality
Above created graph clearly presents that different nodes shows different sizes on the basis
of the closeness centrality. Geographical location is the reason behind different node size on the
basis of closeness. In the closeness centrality, ZIS Information Technology, Shinko Electric
Industries, Tijanjin Riji Precision, Usharesoft nodes are comparatively greater in size compare to
other nodes.
Node size by Betweeness centrality
Unlike closeness centrality, betweenness centrality determines such nodes that bridges less
connected part to the network. Betweeness feature indicates the proportion of times on which a
node is presented on the shortest path between each pair.
4
closeness can be perceived in the terms of farness, reciprocal which can be found by adding
together the path distance by shifting from one node to other. In Netdraw, such measures can be
captured through using analysis/centrality measure command. Closeness, as name itself, determines
the degree to ascertain that which nodes are near to other networks or nodes. Thus, by this way, it is
adverse to the total of shortest path distance. Here, it is necessary to report that by default,
programme always depicts farness instead of centrality. Henceforth, in order to correct it and
present closeness, it is essential to check reverse values option so as to adjust the size of nodes by
selecting closeness attributes. It measures the mean distance of the node from vertex to other
vertices.
Figure 2 Network visualization by closeness centrality
Above created graph clearly presents that different nodes shows different sizes on the basis
of the closeness centrality. Geographical location is the reason behind different node size on the
basis of closeness. In the closeness centrality, ZIS Information Technology, Shinko Electric
Industries, Tijanjin Riji Precision, Usharesoft nodes are comparatively greater in size compare to
other nodes.
Node size by Betweeness centrality
Unlike closeness centrality, betweenness centrality determines such nodes that bridges less
connected part to the network. Betweeness feature indicates the proportion of times on which a
node is presented on the shortest path between each pair.
4
⊘ This is a preview!⊘
Do you want full access?
Subscribe today to unlock all pages.
Trusted by 1+ million students worldwide
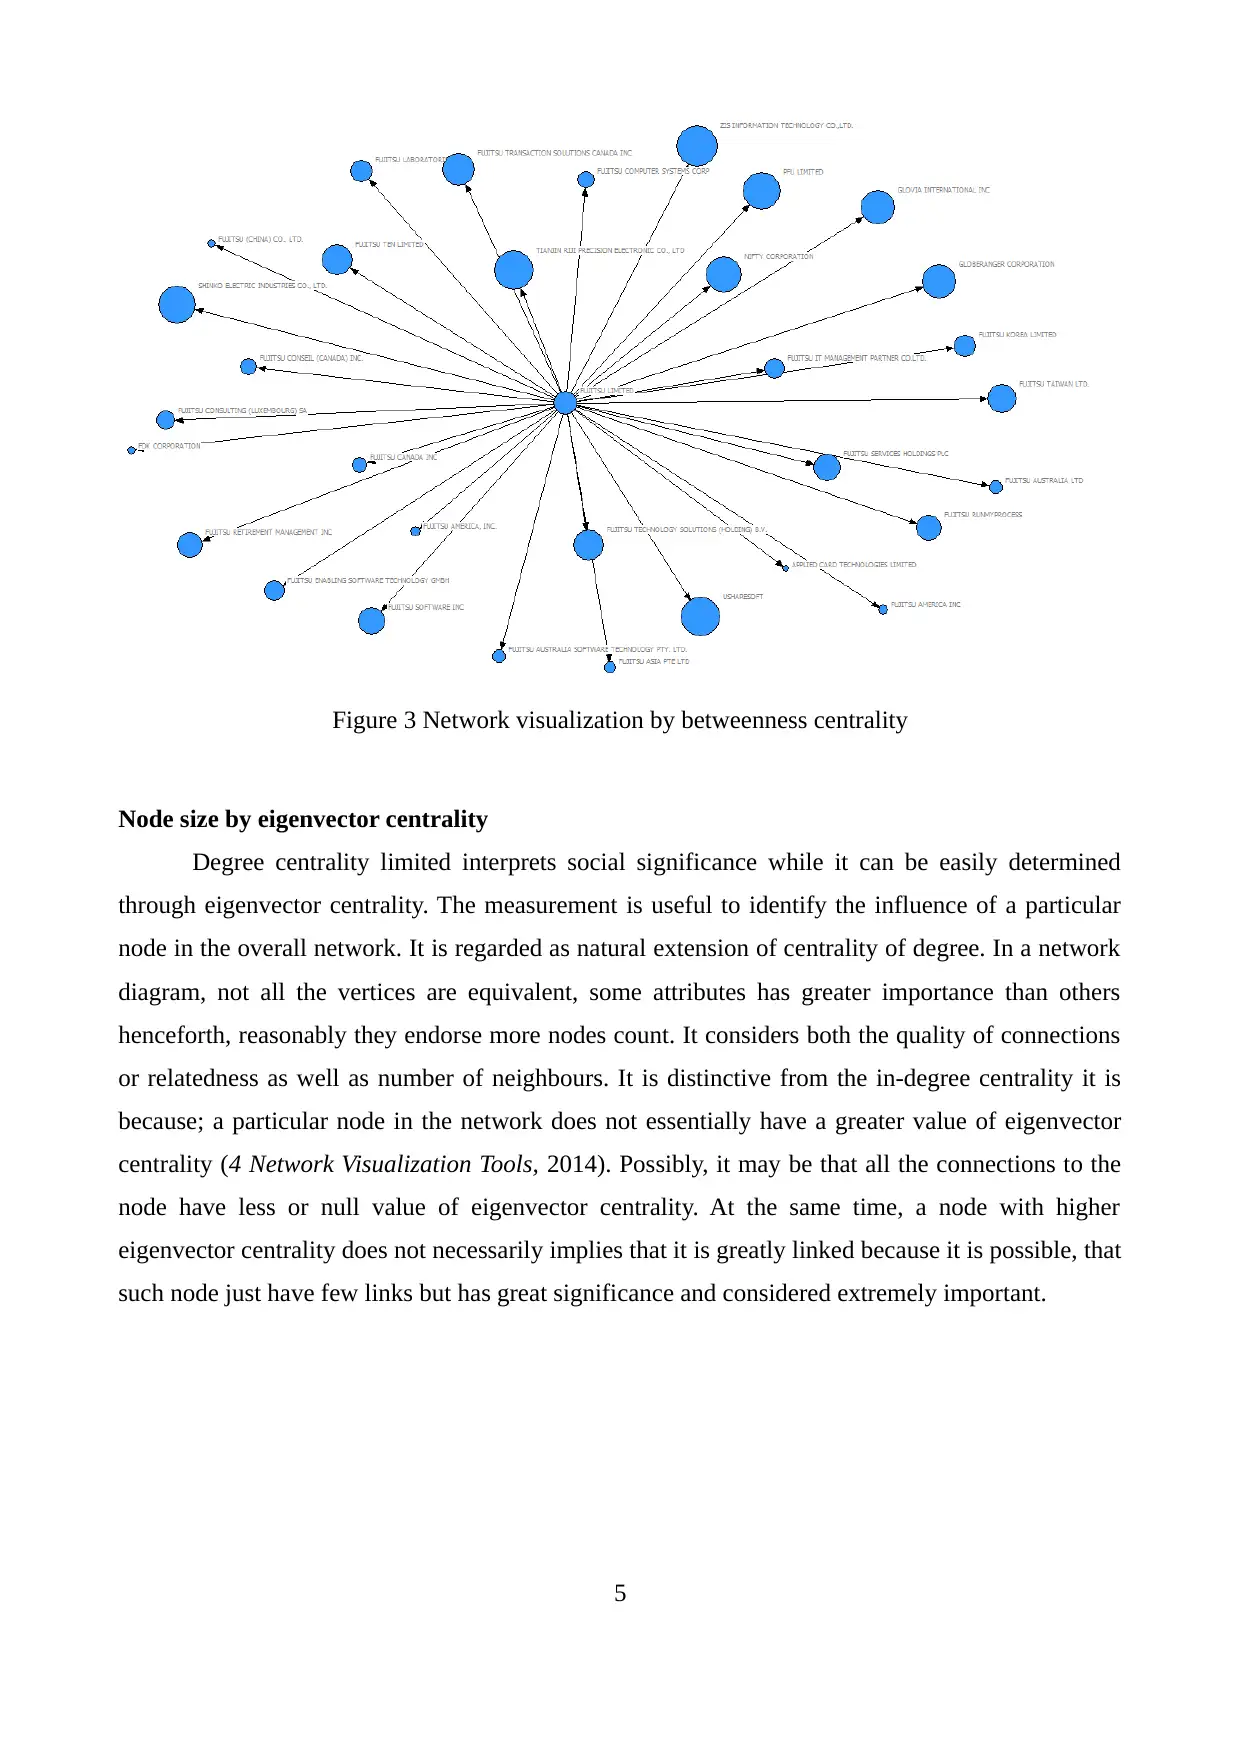
Figure 3 Network visualization by betweenness centrality
Node size by eigenvector centrality
Degree centrality limited interprets social significance while it can be easily determined
through eigenvector centrality. The measurement is useful to identify the influence of a particular
node in the overall network. It is regarded as natural extension of centrality of degree. In a network
diagram, not all the vertices are equivalent, some attributes has greater importance than others
henceforth, reasonably they endorse more nodes count. It considers both the quality of connections
or relatedness as well as number of neighbours. It is distinctive from the in-degree centrality it is
because; a particular node in the network does not essentially have a greater value of eigenvector
centrality (4 Network Visualization Tools, 2014). Possibly, it may be that all the connections to the
node have less or null value of eigenvector centrality. At the same time, a node with higher
eigenvector centrality does not necessarily implies that it is greatly linked because it is possible, that
such node just have few links but has great significance and considered extremely important.
5
Paraphrase This Document
Need a fresh take? Get an instant paraphrase of this document with our AI Paraphraser
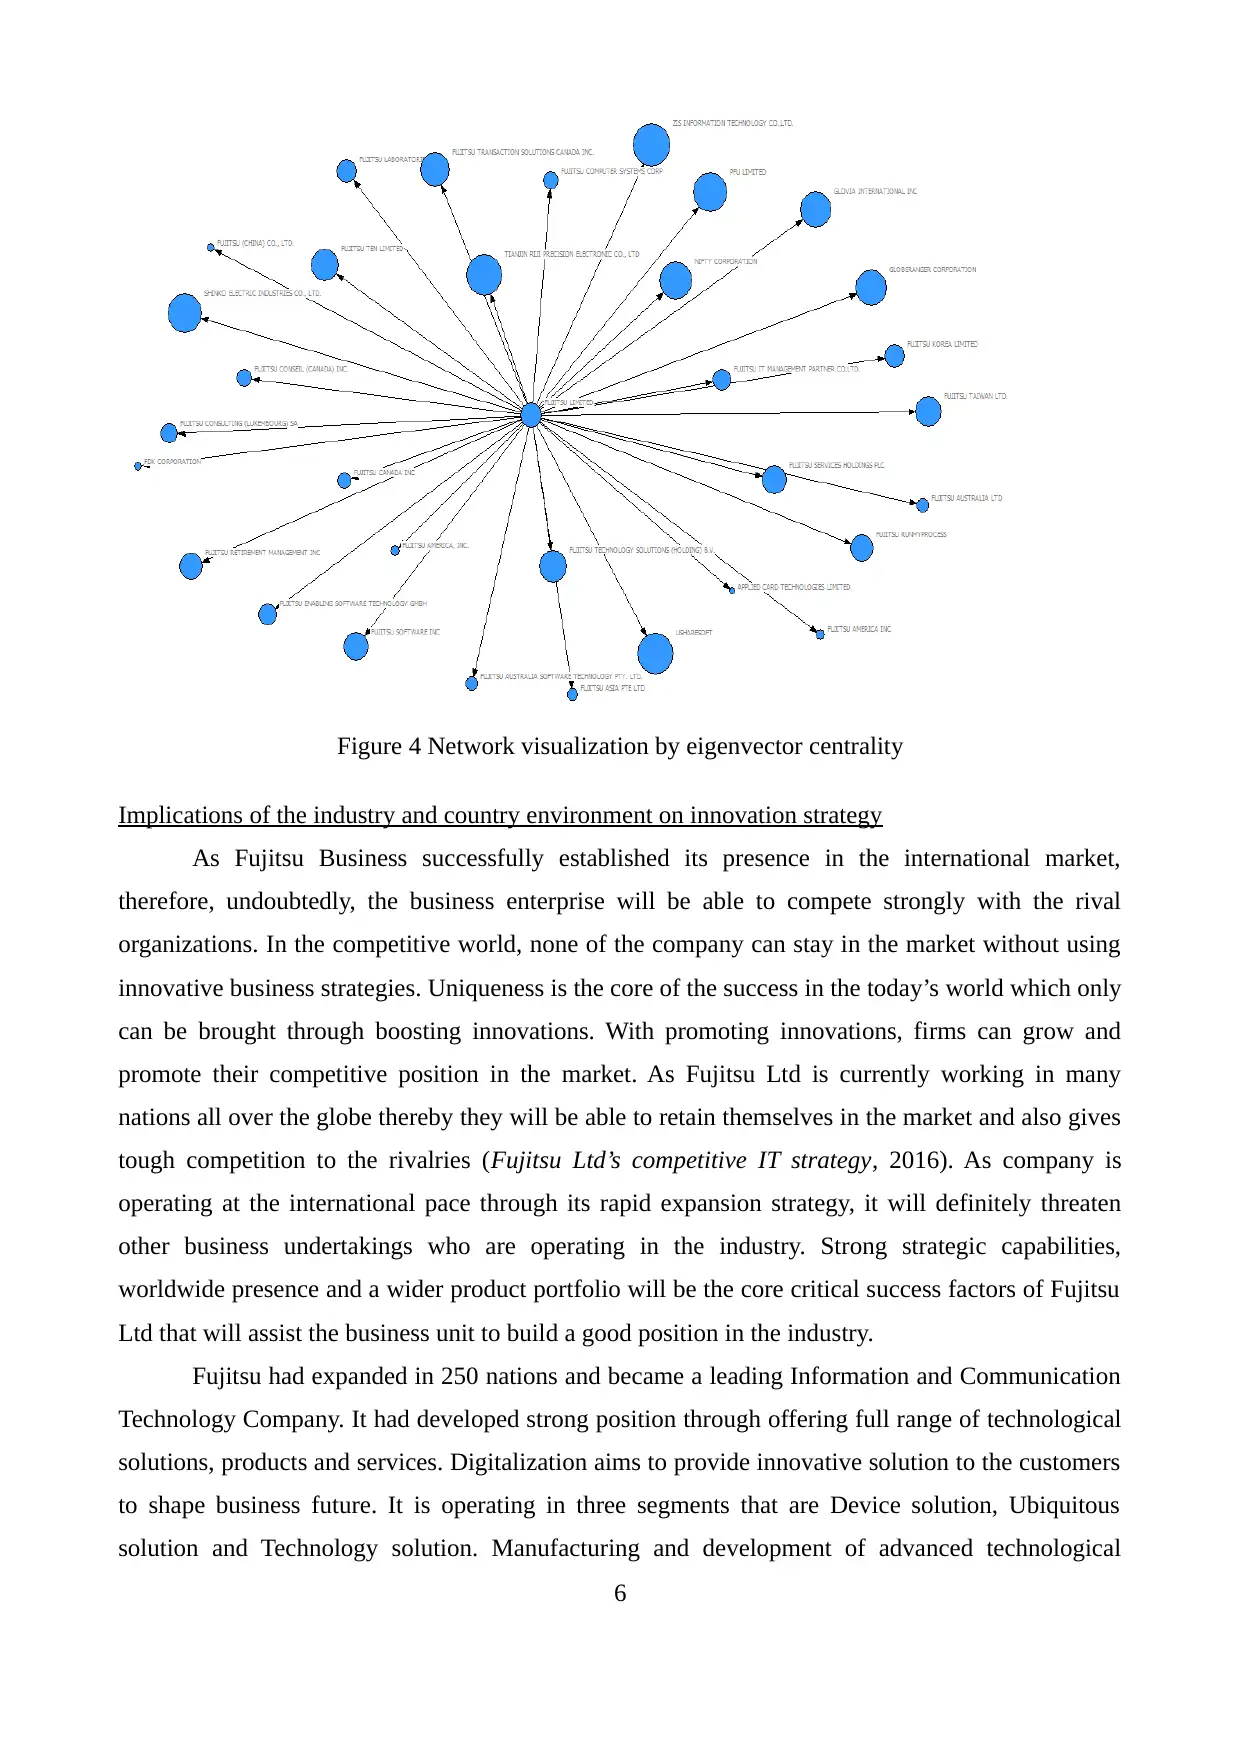
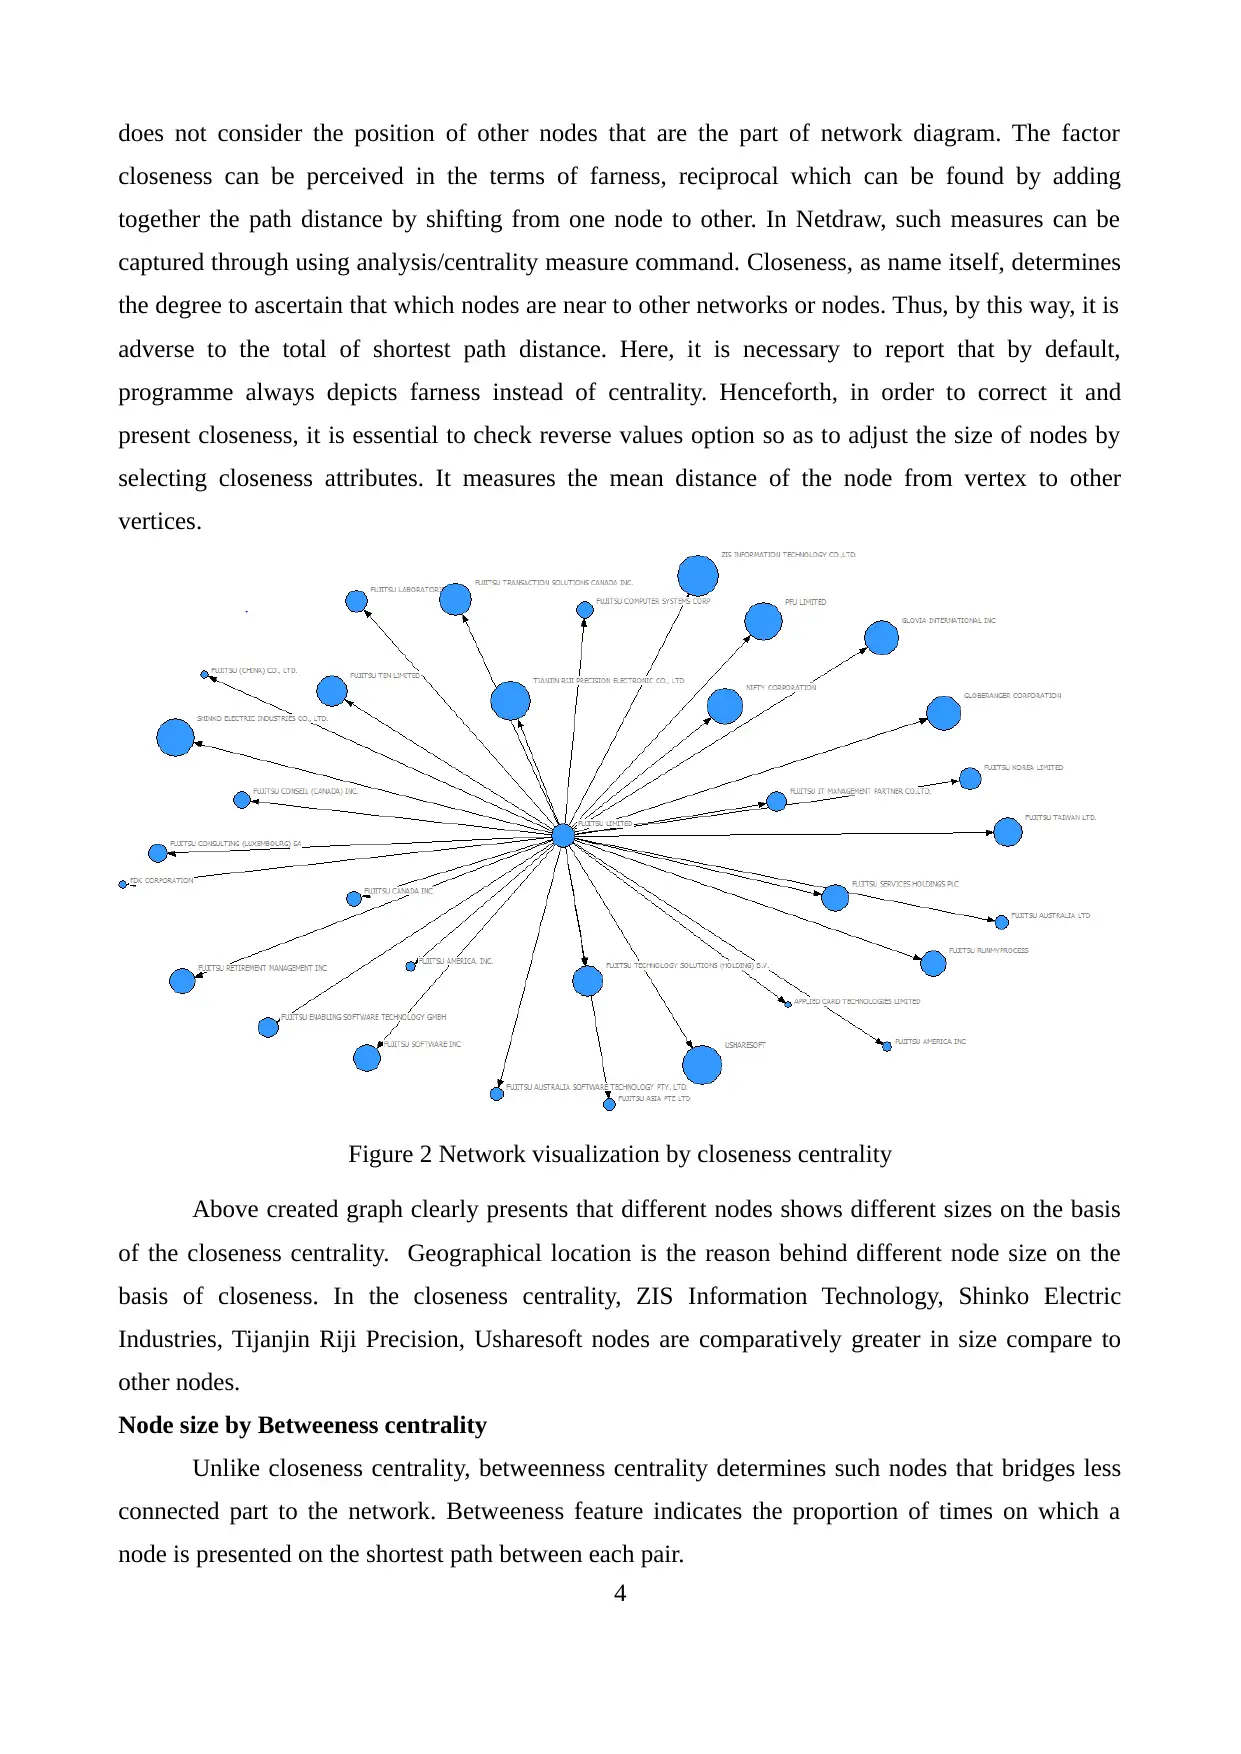
Figure 4 Network visualization by eigenvector centrality
Implications of the industry and country environment on innovation strategy
As Fujitsu Business successfully established its presence in the international market,
therefore, undoubtedly, the business enterprise will be able to compete strongly with the rival
organizations. In the competitive world, none of the company can stay in the market without using
innovative business strategies. Uniqueness is the core of the success in the today’s world which only
can be brought through boosting innovations. With promoting innovations, firms can grow and
promote their competitive position in the market. As Fujitsu Ltd is currently working in many
nations all over the globe thereby they will be able to retain themselves in the market and also gives
tough competition to the rivalries (Fujitsu Ltd’s competitive IT strategy, 2016). As company is
operating at the international pace through its rapid expansion strategy, it will definitely threaten
other business undertakings who are operating in the industry. Strong strategic capabilities,
worldwide presence and a wider product portfolio will be the core critical success factors of Fujitsu
Ltd that will assist the business unit to build a good position in the industry.
Fujitsu had expanded in 250 nations and became a leading Information and Communication
Technology Company. It had developed strong position through offering full range of technological
solutions, products and services. Digitalization aims to provide innovative solution to the customers
to shape business future. It is operating in three segments that are Device solution, Ubiquitous
solution and Technology solution. Manufacturing and development of advanced technological
6
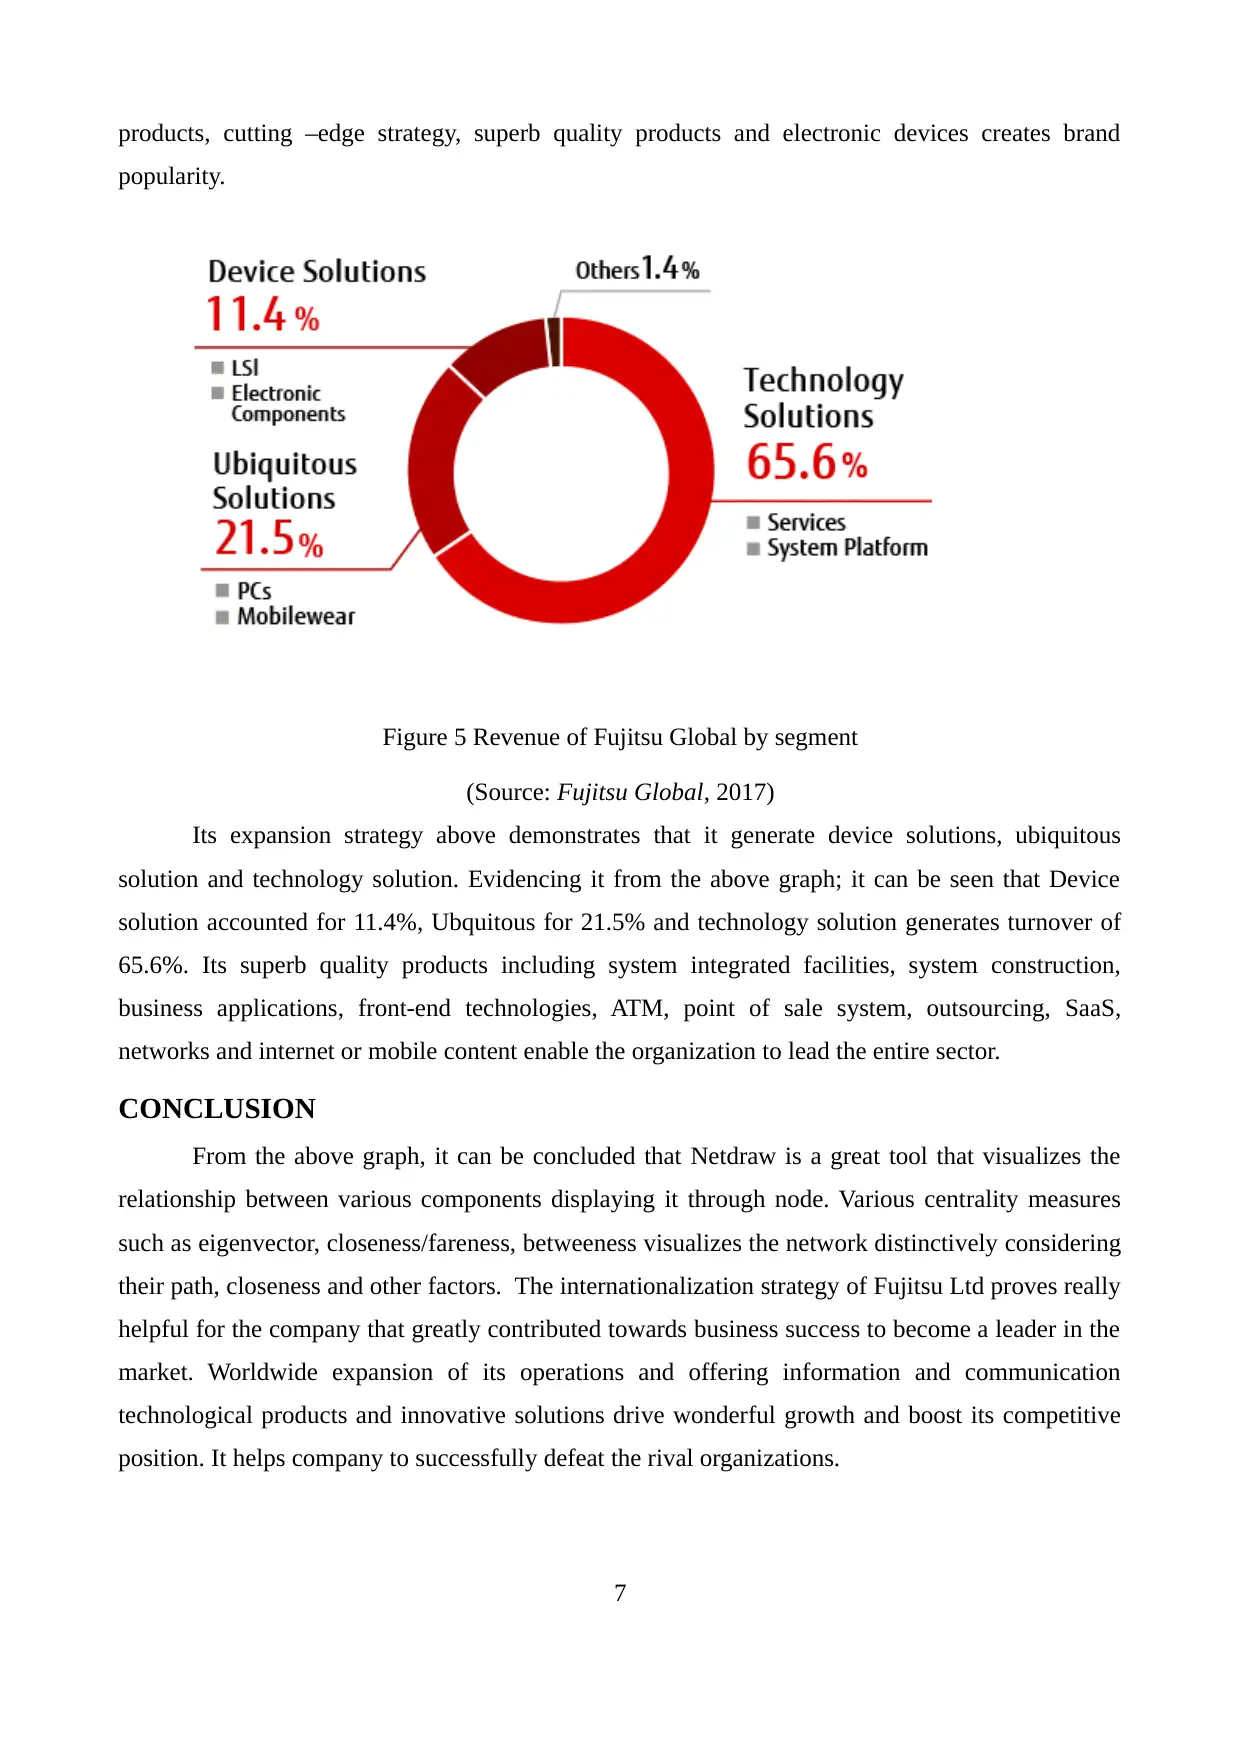
products, cutting –edge strategy, superb quality products and electronic devices creates brand
popularity.
Figure 5 Revenue of Fujitsu Global by segment
(Source: Fujitsu Global, 2017)
Its expansion strategy above demonstrates that it generate device solutions, ubiquitous
solution and technology solution. Evidencing it from the above graph; it can be seen that Device
solution accounted for 11.4%, Ubquitous for 21.5% and technology solution generates turnover of
65.6%. Its superb quality products including system integrated facilities, system construction,
business applications, front-end technologies, ATM, point of sale system, outsourcing, SaaS,
networks and internet or mobile content enable the organization to lead the entire sector.
CONCLUSION
From the above graph, it can be concluded that Netdraw is a great tool that visualizes the
relationship between various components displaying it through node. Various centrality measures
such as eigenvector, closeness/fareness, betweeness visualizes the network distinctively considering
their path, closeness and other factors. The internationalization strategy of Fujitsu Ltd proves really
helpful for the company that greatly contributed towards business success to become a leader in the
market. Worldwide expansion of its operations and offering information and communication
technological products and innovative solutions drive wonderful growth and boost its competitive
position. It helps company to successfully defeat the rival organizations.
7
⊘ This is a preview!⊘
Do you want full access?
Subscribe today to unlock all pages.
Trusted by 1+ million students worldwide
REFERENCES
Books and Journals
Borgatti, S. P. 2002. NetDraw: Graph visualization software. Harvard: Analytic Technologies.
Borgatti, S. P., Everett, M.G. and Freeman, L.C. 2002. Ucinet for Windows: software for social
network analysis. Harvard, MA: Analytic Technologies. Borgatti, S.P. and Molina, J-L. 2003.
Ethical and strategic issues in organizational network analysis. Journal of Applied Behavioral
Science 39(3): 337-350.
Fujitsu Global. 2017. [Online]. Available through: <
http://www.fujitsu.com/global/about/businesspolicy/business/>.
Online
4 Network Visualization Tools. 2014. [Online]. Available through: <
https://schoolofdata.org/2014/08/20/4-network-visualisation-tools/>.
Katoh, M., 2006. Fujitsu’s Intellectual Property Strategy. [Online]. Available through:
https://www.fujitsu.com/global/documents/about/ir/library/presentations/060412-2e.pdf.
Fujitsu Ltd’s competitive IT strategy, 2016. [Online]. Available through: <
http://www.fujitsu.com/global/about/resources/news/press-releases/2017/0531-01.html>.
8
Paraphrase This Document
Need a fresh take? Get an instant paraphrase of this document with our AI Paraphraser

9
1 out of 11
Related Documents


Your All-in-One AI-Powered Toolkit for Academic Success.
+13062052269
info@desklib.com
Available 24*7 on WhatsApp / Email
![[object Object]](/_next/static/media/star-bottom.7253800d.svg)
Unlock your academic potential
Copyright © 2020–2026 A2Z Services. All Rights Reserved. Developed and managed by ZUCOL.